

piranka/E+ via Getty Images
Boy, That Escalated Quickly…
Investment sentiment shifted dramatically during the first half of 2022. The S&P 500 is off to its worst start since 1970. It’s not just equities. U.S. government bonds are tracking toward their worst year since 1865. Yes, back when the United States was still using Greenbacks to finance the Civil War. Today’s ubiquitous Federal Reserve Notes were a five-decades-hence twinkle in a central banker’s eye. This year is shaping up as one for the record books.
The ever-popular “60-40” stock-bond portfolio1 has been shellacked by rising interest rates, rampaging inflation, and fears of recession. In the ninety-five years since 1928, the 60-40 has been positive almost 80% of the time. Consistent winning is how you become a popular strategy.2 Yet 60-40 was down more than -15% in the first half, its worst showing since 1937.
In our April Client Letter, we predicted a difficult decade for stocks.3 As a refresher, we decomposed equity returns into five factors and gave our estimates for the next ten years.
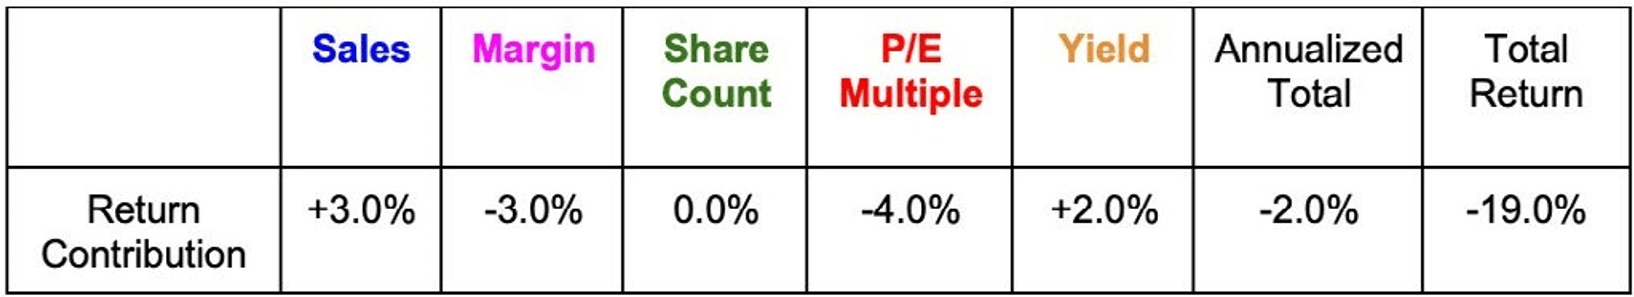
Little did we know we’d get almost all of that -19% in the next three months. The what is more knowable than the when.
Does that mean we’re done? That it’s time to get back to riding the bull for another ten years? Despite all the certainty you see on CNBC or twitter, no one really knows. But there’s a universal truth: the magnitude of the hangover must match the indulgence of the party. It’s hard to imagine we’re in the clear after such a spiked punch bowl.
What if a recession impacts consumers and causes sales to decrease?
Or inflation from rising energy and labor costs, plus reshoring new supply chains, pinches corporate margins?
Or negative sentiment hammers the P/E multiple?
Or dividends must be cut to insure corporate survival?
Or struggling companies issue equity to stave off bankruptcy, thereby increasing total share count?
Pass the aspirin.
Any of the above would negatively impact investor returns. One of the dastardly traits of stationary data sets: you have to spend time below the mean on occasion. And we’ve been living high on the statistical-mean-hog for a decade.
Yet we remain long-term optimists. Hard times are the wire brush of progress. Scraping off the excess is the painful requirement for healthy growth. We’ll make it through a difficult period and emerge better for it. Our society could stand some economic hormesis.
Easy Quiz
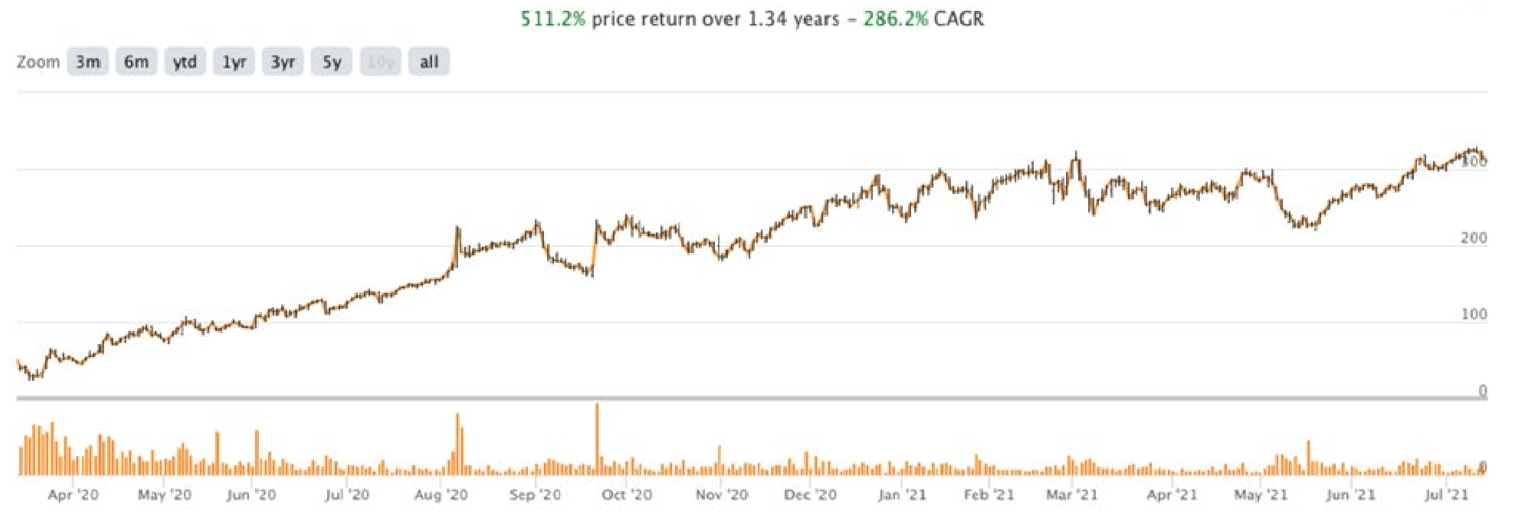
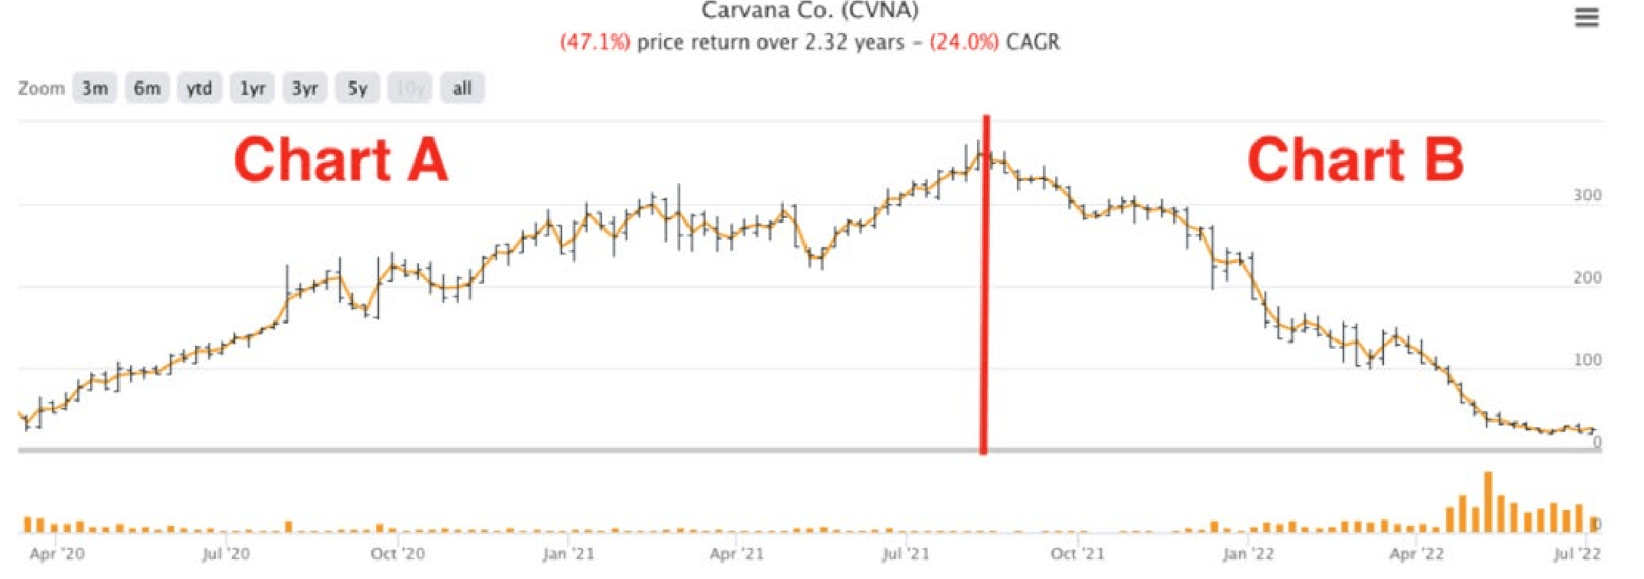
Would you rather be associated with Stock Chart A that went up more than 500% in 15 months?
Or Stock Chart B that went down more than -90% in less than a year?
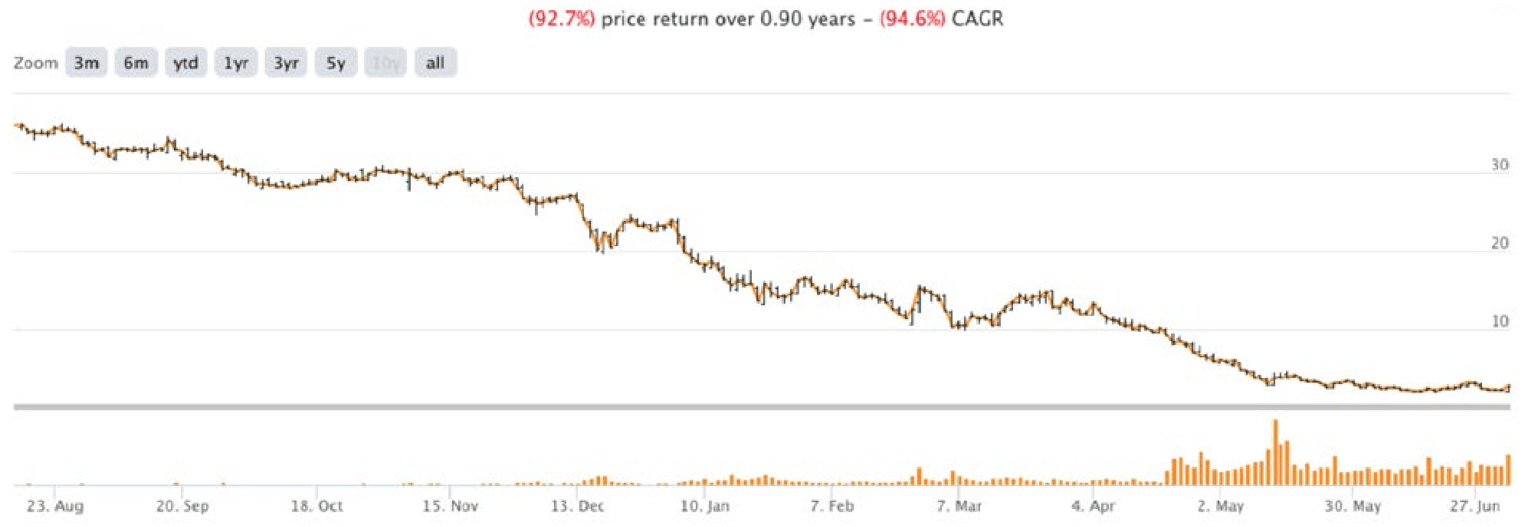
As expected, this is a trick question. These are the same company, Carvana (CVNA), who experienced a wild round trip over the last few years.
It’s possible the world can be divided into two types of investors. Those who cheer the rising prices of Chart A, and those who celebrate prices going down like in Chart B. (My guess is there are more in the Chart A camp.)
Different market regimes reward each group. The last ten years of bull market were decidedly for people who preferred rising prices. Yet-to-profitable technology companies with promising stories soared. The future gleamed; growth investors rejoiced. Recall that the increase in P/E multiple added +6.4% per year to the S&P’s returns. That’s a cumulative +86% return just based on an increase in excitement. Momentum can be self-sustaining… for a while.
Yet everything is cyclical. It’s likely the next ten years will reward people who like to see retreating prices. But if we’re supposed to buy low and sell high, how does one still profit in a world of falling prices?
It won’t be from huge topline growth and multiple expansion. Those are glittering bull market spoils.
New Recipes
Here’s one possible pattern that may serve you well. We’ll use our familiar five factor analysis to deconstruct how you can still win.
Take the very real business we’ll call “Company X.”
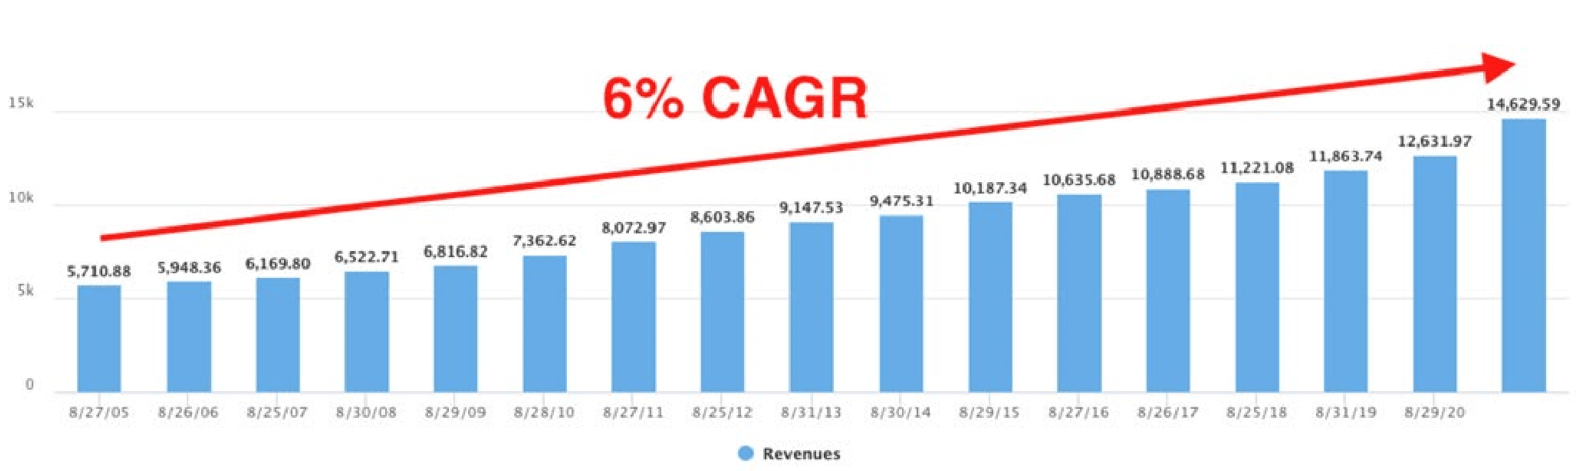
From 2005-2021, it grew sales at a +6% clip. Progress came from new stores expanding at a +3.9% rate, and same-store-sales improving added +2.1%. This would not qualify as hyper-growth.
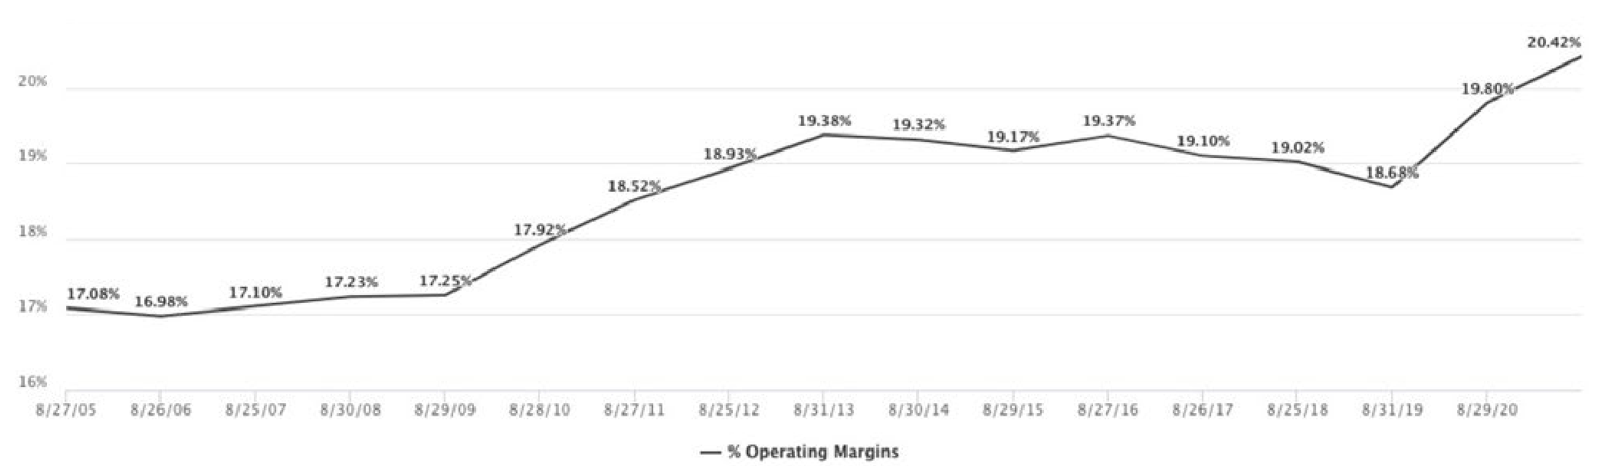
Profit margins hovered around a healthy 17-20%. The business had decent, dependable economics.
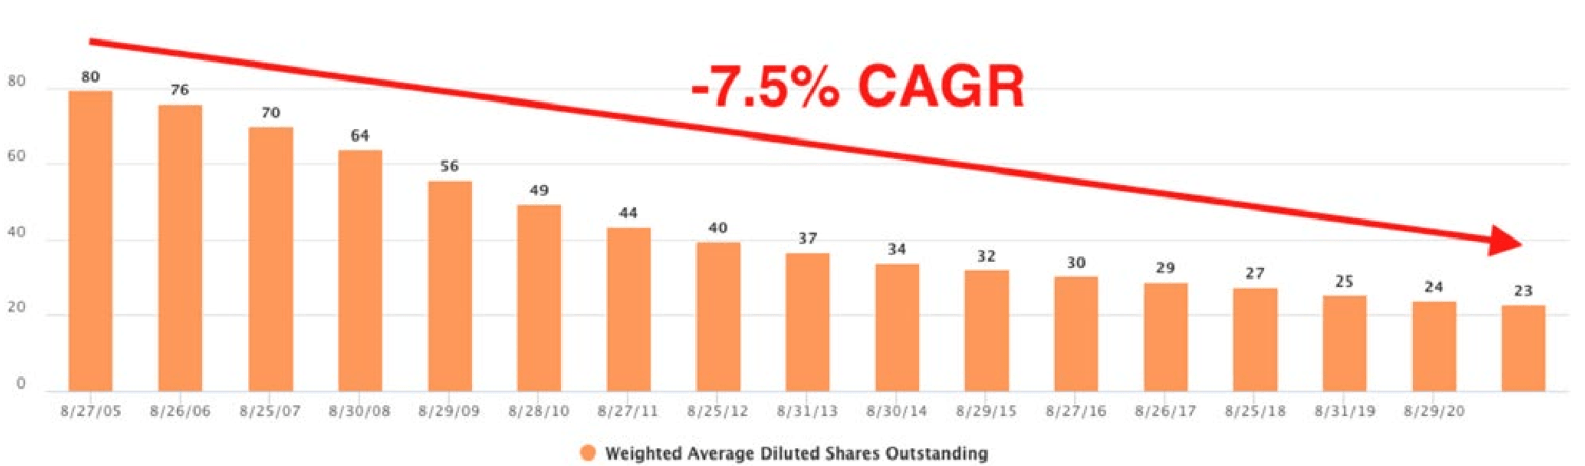
Share count went from 80 million shares outstanding down to 23 million. This is what Charlie Munger would call a “cannibal.” Eating itself to this degree should catch your attention.
In fact, the company used $22 billion of funds to reduce its share count. That represented 85% of the cumulative cash flow from operations over those seventeen years. Management directed the capital allocation firehose toward sopping up shares.
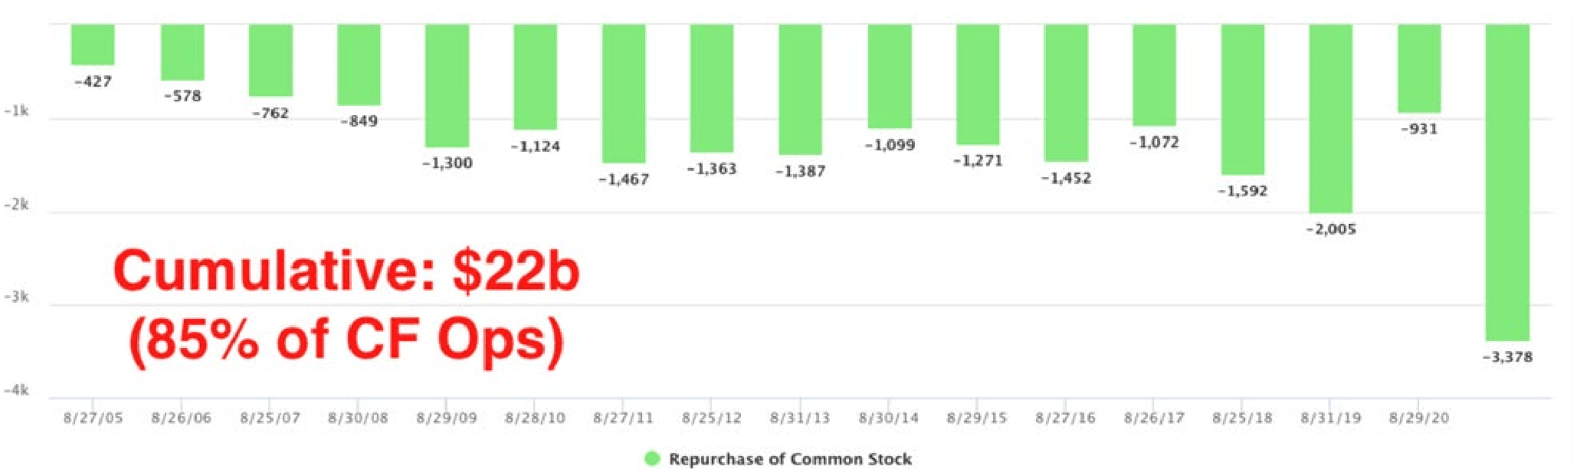
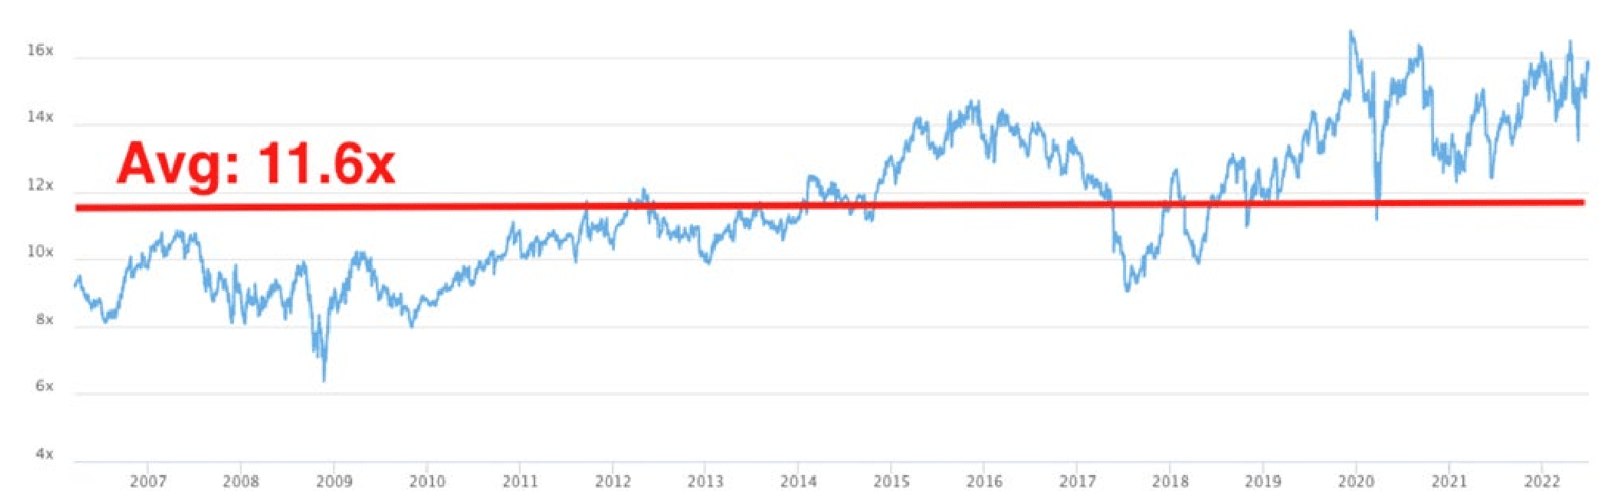
Yet buybacks aren’t an unalloyed good. The prices paid matter. Pay too high a price, and intrinsic value waltzes out the door, leaving remaining shareholders poorer. Company X was able to execute its buybacks in the range of 11-12x EV/EBIT, a very reasonable price. That’s good capital allocation.
Here’s a summary of the return contributions:
Sales +6.0%
Margin +3.0%
Share Count +7.5%
P/E Multiple +3.5%
Yield 0.0% (no dividends)
Company X returned +20% annualized for 17 years, summing to more than +2100%. Cash flow per share went from $4.64 to $130.27 for a 23% rate of compounding. Wow.
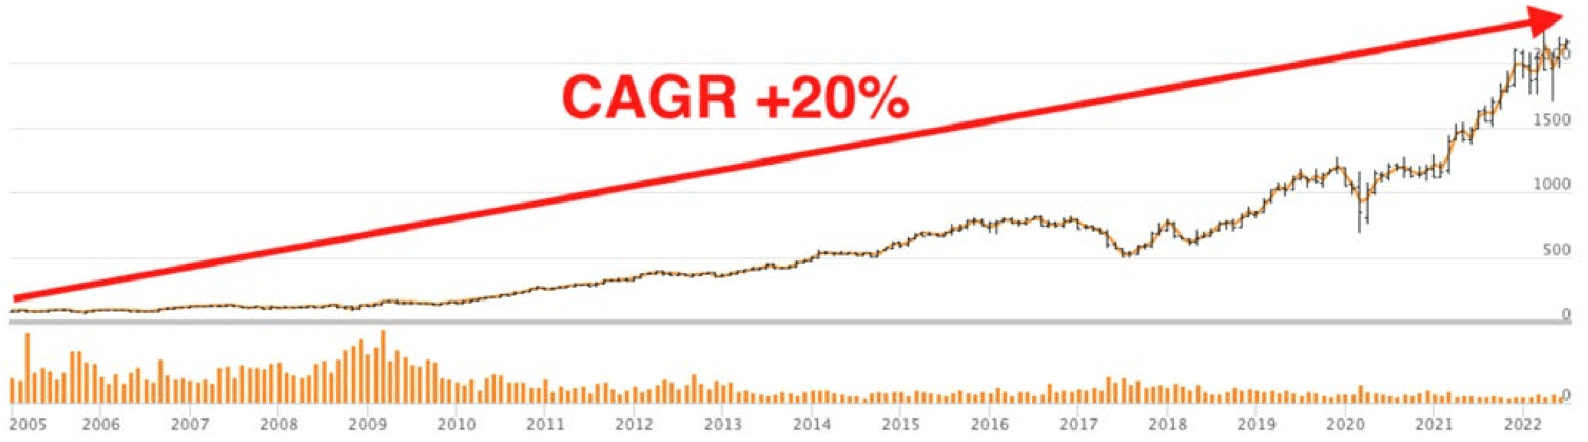
With such windfall results, you’d think Company X must have discovered a breakthrough cancer treatment, or figured out how to land rockets on barges. Alas, investing need not be so dramatic.
Company X is Autozone (AZO). One would struggle to find a more boring business than retailing auto parts. And yet if you bought in 2005 and held on, you absolutely crushed it for a chunk of an investment career.
There’s a catch: holding was no small feat. For the first four years, you were basically flat, up a whopping total of +8%. It would have felt like you were going nowhere for almost 1500 days. You also endured several -30% drawdowns, along with significant doldrums. The temptation to sell would have been strong as your ownership had all the excitement of watching paint dry.
Mr. Buffett was right: “Investing is simple, but it isn’t easy.”
Micro Machines
The unit economics of Autozone are fascinating for a business analyst to unpack. In a world driven by macro headlines, let’s get micro and break down the evolution of the average store.
In 2005, a typical store had eight employees and drove $1.55 million of revenue through its four walls every year. EBIT was $237k; imagine about $650 being sent back to the Memphis, TN headquarters every day. Shares outstanding were around 80 million, meaning there were nearly 22k publicly-traded “claim checks” per store. If you bought 22k shares, you could imagine owning your closest Autozone unit all to yourself.
Over the next seventeen years, the company outlayed $6.8 billion to build 3,094 new stores. Sounds like a lot of money, but that’s fairly modest growth: $2.1 million per new store at a pace of 3.5 openings per week.
Fast forward to 2021. The average store had ten employees and drove $2.16 million in topline per year.
Increased revenue spread over fixed costs allowed $413k per store to be sent back to Memphis HQ. Perhaps most importantly, after Herculian buybacks, there were just 3,400 claim checks outstanding per store. More and better stores, plus less claims per store meant each ticket is naturally worth more. If you hung on to your claim tickets, you had quite the satisfactory result.
Summarizing Autozone’s recipe for success:
Decent, steady business
+ Modest growth
+ Disciplined capital allocation buying back shares when cheap
= Still winning in a falling market
You can now become a Chart B enthusiast and be happy about the lower prices you’ll likely experience this decade.
Pattern Matching
We have several companies in our portfolio that fit the Autozone mold. Here are my rough mathematical assumptions for one of them. This case study illustrates why I wake up every morning hoping the price will drop that day.
- Over the next ten years, the company will open fifty-two new stores per year.
- Measured growth.Each store will experience +1% in same-store-sales growth. Modest annual improvement.
- The economics will yield 12% EBIT margins. Nothing flashy, and we’re assuming no margin improvement.
- Opening one store per week will require $75 million in capital expenditures per year.
- All of the remaining free cash flow will be directed toward buybacks. No dividends.
- The starting multiple today is at 20x price-to-earnings.
- The ending multiple in ten years will also be 20x price-to-earnings. We aren’t winning because Mr. Market gets excited about our stock during our ownership.
Here’s the key.
If the valuations in Year Two through Year Nine are expensive at a 40x P/E, the buybacks won’t go as far and we’ll only earn an +11% annual return. Not bad, but not a home run.
However, if the stock is cheap during those eight middle years at a 5x P/E, the buybacks will retire a boatload of shares and will give us a +32% compounded return.
Reality will likely fall somewhere between these estimates, and the real world can always deviate from our simple assumptions and teach us a new lesson.
But here’s the takeaway: Opportunistic capital allocation can be the difference between $1 turning into $2.84 with high prices, and $16.06 if pessimism presents the opportunity of low prices. You can see why we’re excited for the next decade of a new market regime. It will be a time for solid operators, disciplined capital allocators, and patient investors.
“To the moon!” will no longer work as an investment thesis.
FSI BBQ
Save the date of September 24th as the Farnam Street “Family Reunion” is back on for 2022. More details to follow; we’re beyond excited to see everyone again in person.
As always, we’re thankful to have such great partners in this wealth creation journey.
Jake
Footnotes
160% S&P 500, 40% 10-Year U.S. Treasuries.
2Falling interest rates sure don’t hurt either.
3We’ve also viewed bonds (especially long-duration) as quite dangerous “return-free risk” for a long time.
4Sales, margins, multiple, share count, dividend.
5EV/EBIT = Enterprise Value / Earnings Before Interest and Taxes
Editor’s Note: The summary bullets for this article were chosen by Seeking Alpha editors.
Be the first to comment