

AustinArtist/E+ via Getty Images
As a relative value investor how can I justify having a large Farmland Partners (NYSE:NYSE:FPI) position when it is trading near a 52 week high and more than double where it was a few years ago when everything else is down 20ish percent?
Well, the fundamentals have kept up with the price.
The Buy Thesis
Farmland continues to be a dominant asset class, appreciating at a rapid pace and allowing landlords to raise rent significantly. Recent data suggests the appreciation may continue longer than previously anticipated increasing the runway of growth. Specifically, I would point to 2 new factors:
- Ag commodity prices remain elevated even as most other commodities come back down to earth
- The Olympic averaging structure of farm bill programs will extend the good times at least 2 years beyond the peak whenever that may be
In this environment, I think FPI’s net asset value (‘NAV’) per share will continue to rise at a pace exceeding $1.50 per year. In combination with the dividend, that presents a great total return. Let me begin by discussing the value trajectory of farmland broadly and follow with how that translates to FPI’s return prospects.
Ag Inflation
Corn and Soybeans remain remarkably strong as other commodities have come back down. Here are the 25 year charts of corn and soybeans.
Tradingeconomics Tradingeconomics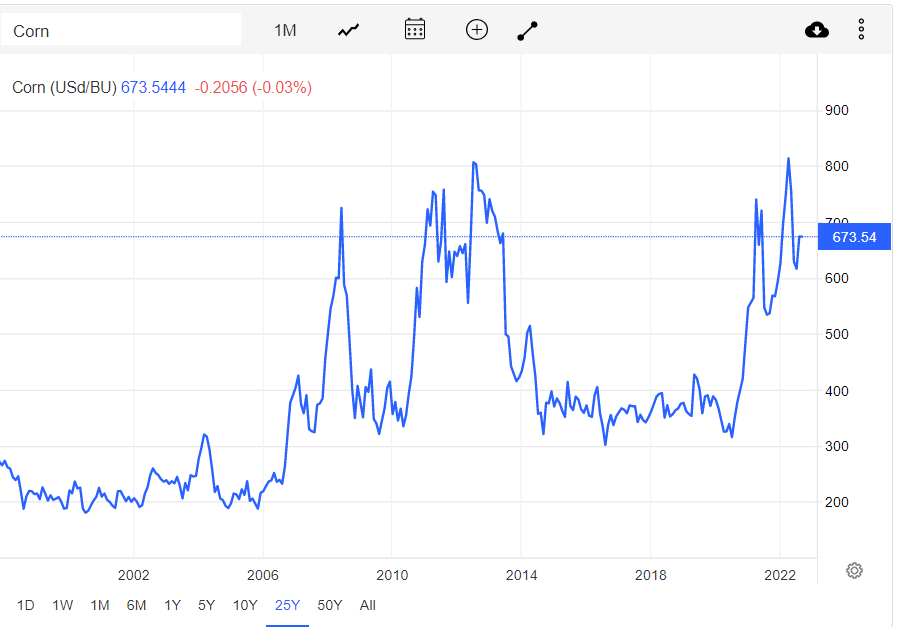
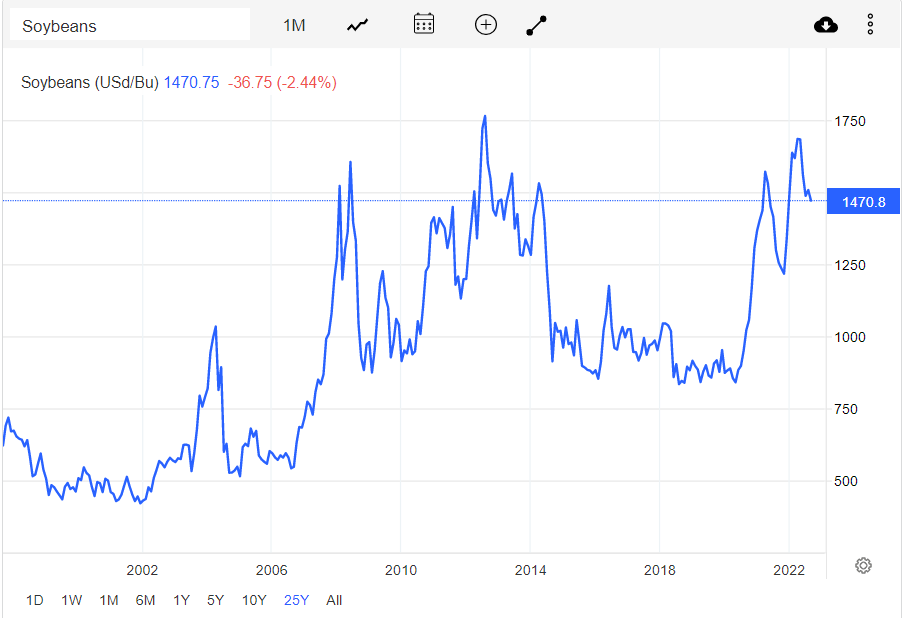
Both are roughly in the ballpark of their 25 year highs.
Such high prices were not abnormal for commodities a couple quarters ago with inflation taking just about everything to fresh highs. The difference here is that when other commodities came back down to normal levels corn and soybeans remained high.
Oil is back to a normal level.
Tradingeconomics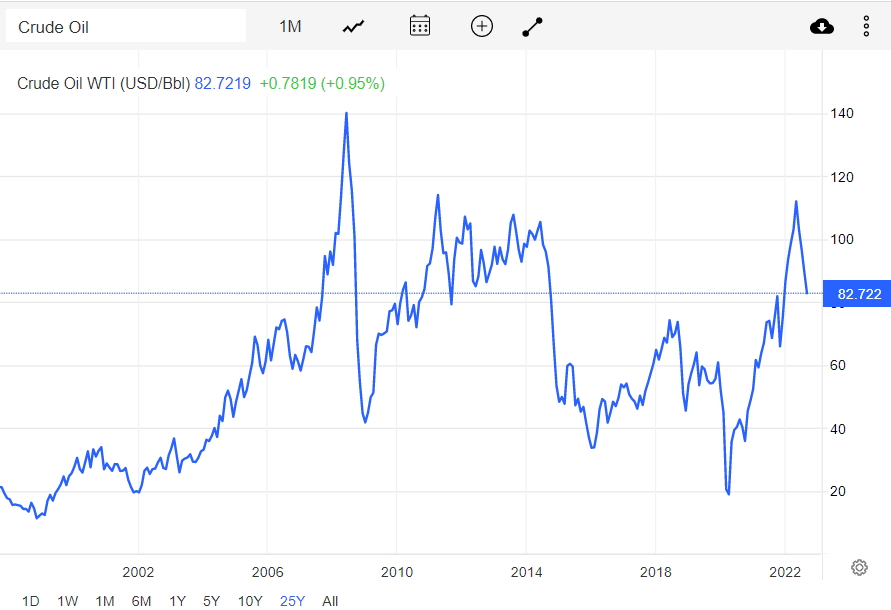
Steel is approximately at its 10 year median.
Tradingeconomics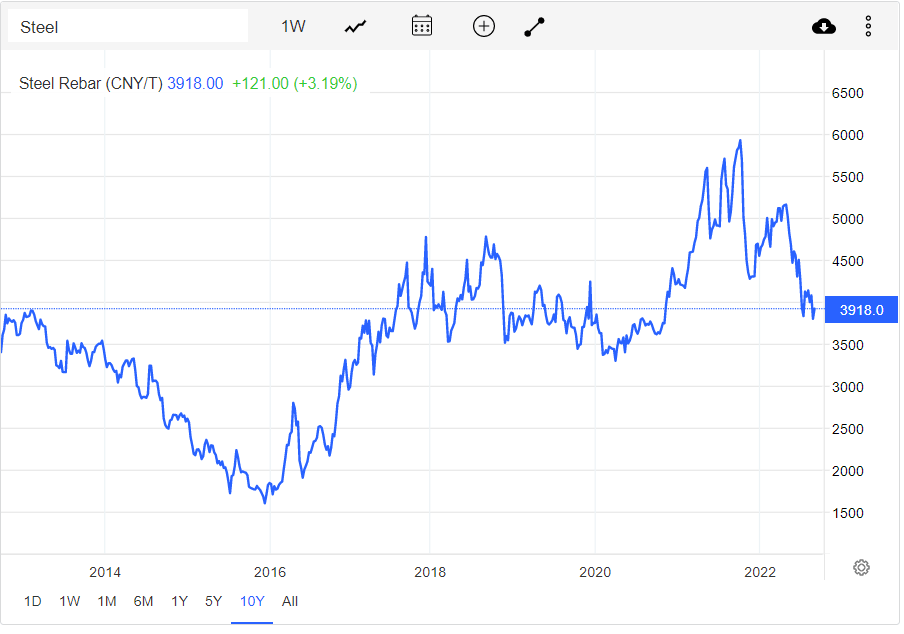
Lumber is still elevated relative to its 25 year history, but down about 2/3 from where it peaked.
Tradingeconomics
Why are the food commodities staying up?
Corn and soybeans are a massive global market on both the supply and demand side so there are quite a few factors going into it. Here are some that I think are making its pricing stay so high:
- Large purchase volumes from China
- Secular demand growth
- Droughts, floods, infrastructure, war, fertilizer prices and HBU
2021 featured heavy agricultural purchase from China and 2022 is coming in at an even faster pace.
Agricultural economic insights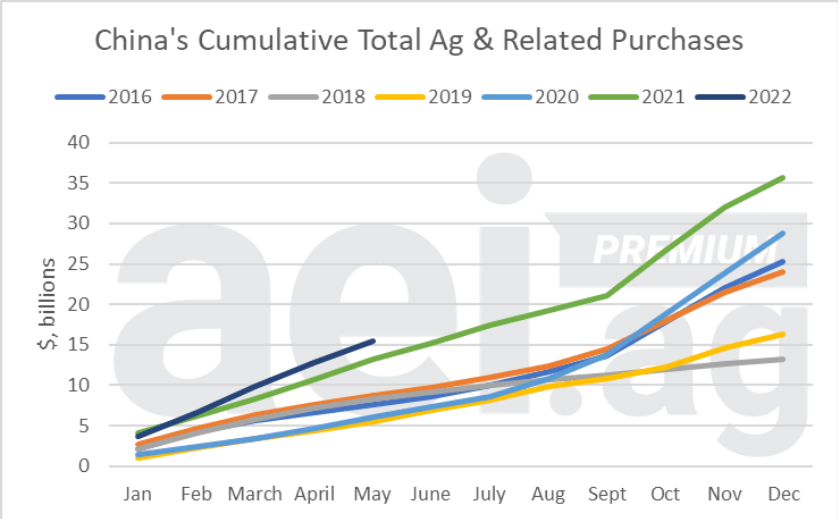
China’s corn and soybean production is not enough domestically so they have to import. Beef demand/consumption in China is particularly strong which of course increases demand for feedstock grains.
Secular demand drivers
The other commodities are largely cyclical in nature. Their prices spiked as the economy heated up, but once interest rates started rising and activity slowed they fell back down. Food consumption is not cyclical. As long as world population is increasing, food consumption is increasing. Growing global wealth is further accelerating food demand as meat requires far more grains than direct grain consumption.
I don’t see these trends changing anytime soon.
Somewhat weak supply
A number of factors have inhibited supply of corn and soybeans, some of which are temporary, and others are permanent.
Temporary factors:
- High fertilizer prices may have encouraged farmers to use less which could adversely affect yields.
- Drought and flooding in various parts of the world delayed planting and/or damaged crops
- Ukraine and Russia are big grain producers. The ongoing conflict is impacting both the quantity of crops grown and the ability to get the products to market.
Permanent factors:
With exception to the U.S. which happens to have a massive amount of land area relative to its population, most of the food net exporters of the world are economically poor countries. This is chronically causing realized yields to drastically underperform potential yields with proper infrastructure, technique, and equipment.
I don’t think those outside the farming world truly understand the amount of investment that goes into the strong yields per acre of the United States. Farm owners, particularly those of the bigger operations, tend to be highly educated. Proper management requires personnel with master’s degree level understanding of botany, engineering, meteorology and probably other areas that I am not considering, as I am not a farmer.
This means that for a country to have high yield per acre it needs great universities in addition to infrastructure like grain elevators and access highways from farms to seaports. Individual farmers need to have sufficient wealth to buy the literally millions of dollars-worth of equipment. The combine shown below costs north of $400,000.
tractorusaprice.com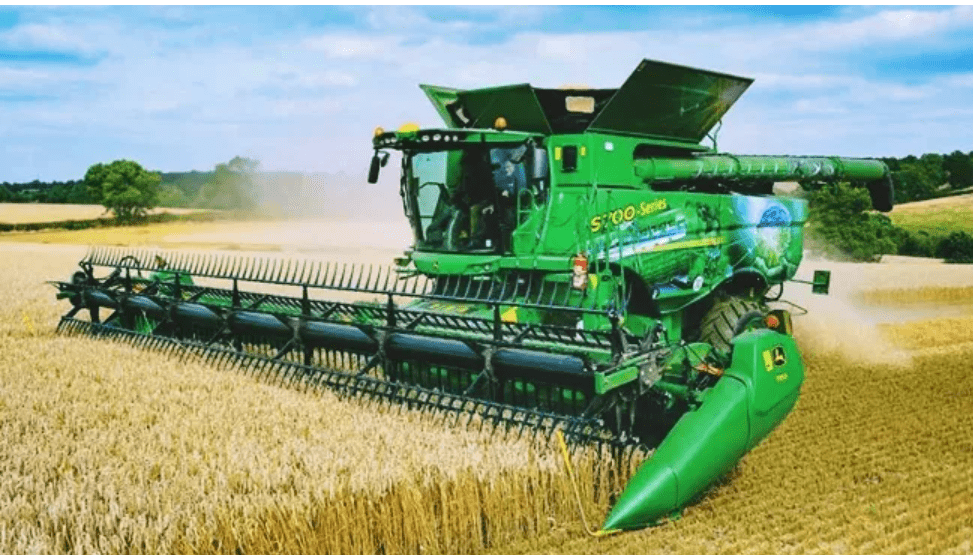
It requires the sort of asset wealth that farmers in the U.S. have built up over a dozen generations. This sort of wealth accumulation has not been possible in most of the world’s primary growing regions as government instability (corruption in some cases) and general economic distress have kept farmers poor in many countries.
Catch-22 of economic prosperity
In theory, global crop yields will increase going forward as countries get wealthier and build out the proper infrastructure. However, that yield increase would be on a per acre basis and not necessarily overall. See, the same public infrastructure and economic prosperity of a country that leads to better yields also increases the alternative use value of the land. So wealth increases will tend to lead to reduced farmland acres because more of it will be sold for HBU (higher better use).
The UK, for example, is prosperous and has great infrastructure, but it is also losing much of its farmland to HBU. Since 1960, percent of land allocated to agriculture in the UK has dropped from 82% to just north of 71%.
data.worldbank.org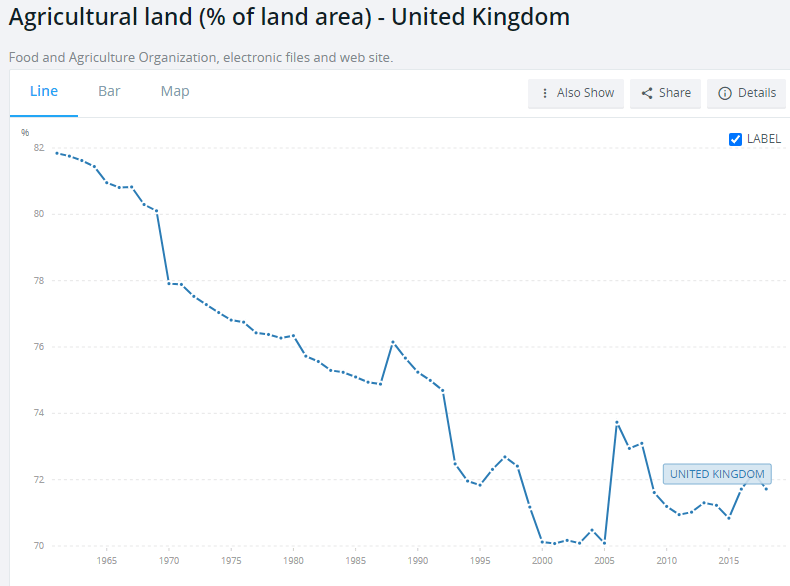
As a result, the UK has become a net importer of food despite having good land and good infrastructure. According to the USDA:
“While, over 70 percent of UK land is used for agriculture, the UK’s large population compared to the amount of arable land makes it a net agricultural importer. The UK imported $75.5 billion in agricultural and related goods in 2020 and exported $30.5 billion.”
The U.S. is the exception to the rule being one of very few growing regions that has ample land, good infrastructure and highly equipped/educated farmers.
This globally constrained supply in combination with the secular growth to demand lead me to believe commodity prices will trend up over time. There will always be lumpiness with some years having high global yield pulling prices down and other years scarcity will spike prices up, but the general trend should be upward.
In the coming years, farmers will largely be protected from such lumpiness due to an oddity in the way the farm bill is designed.
Olympic average used for farm insurance nearly guarantees good farmer income over coming years
The 2018 farm bill reinstituted the oddities of the previous farm bill with regard to the 2 main program types ARC-CO and PLC. ARC-CO is county level Agricultural Risk Coverage which pays out when the actual county level receipts are less than the ARC-CO guarantee for the selected crop. Price Loss Coverage (‘PLC’) is triggered when the price of a covered commodity falls below the reference price.
The oddity is the way in which the reference price and revenue guarantee are calculated.
According to the USDA:
“The ARC-CO benchmark revenue is the 5-year Olympic average MYA price multiplied by the 5-year Olympic average county yield. Benchmark yields and MYA’s will be calculated using the 5 years preceding the year prior to the program year. The ARC-CO guarantee is determined by multiplying the ARC-CO benchmark revenue by 86%”
I think the idea behind using a 5 year Olympic average is that it is supposed to make a more stable reference price by eliminating single year spikes and troughs. In practice, however, ag cycles can last a long time which creates substantial volatility in the 5 year average.
2012-2014 were boom years for farm revenues so as this period got included in the 5 year Olympic average and the weak period preceding it rolled out of the 5 year average the reference levels were great. As you can see in the chart below, insurance guarantees in the following years were quite high with a benchmark price over $5 per bushel for corn.
Agricultural economic insights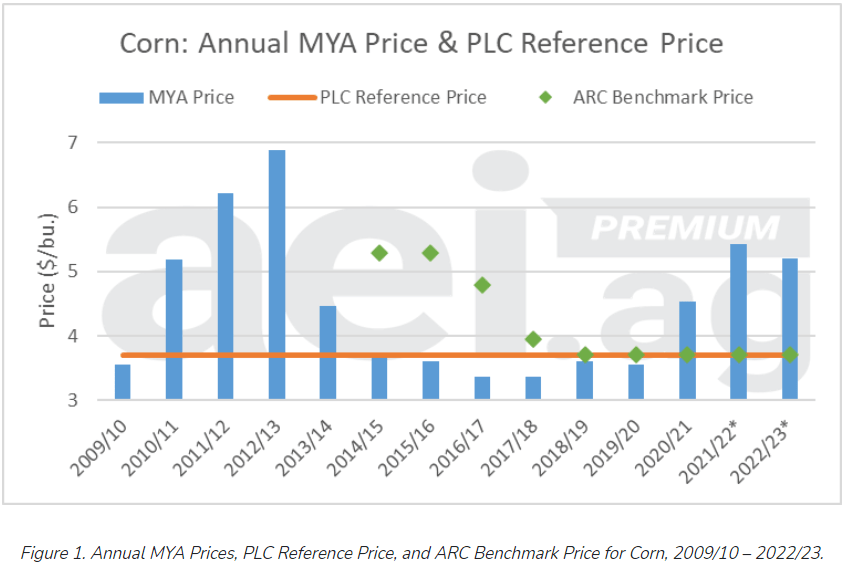
However, as the commodity trough dragged on the extended period of weak pricing led to insurance reference prices collapsing so around 2019 farmers were left dealing with terrible pricing and minimal insurance backup.
Going forward, however, farmers are set up for a period of strong government program reference prices such that even if commodity prices drop back down, their net of farm bill income should be quite strong.
Soon the Olympic average will be dominated by the commodity pricing boom of 2021 and 2022.
So while I think commodity prices will remain high due to the demand vs supply dynamics discussed above, farmer income should remain high even if commodity prices drop as a result of the lagged reference price of crop insurance.
Farmland Partners has its farmers on crop insurance. Last I checked, they were primarily using ARC-CO, but that is an election the farmers can make each year.
USDA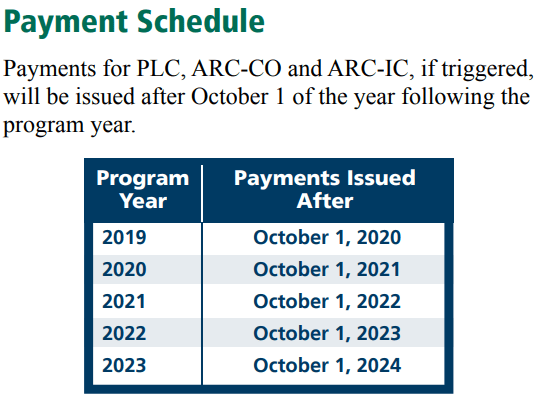
Note that the benchmark levels for farm bill programs this year are quite low, but that is unlikely to matter because commodity prices are great. It is the forward benchmark rates that will be factored into expected farmer income.
With this somewhat locked in high level of farmer income, I think FPI will be able to really push rents in the coming years. Recent quarters show rent increases of 10%-20% but rent as a percentage of farmer income remains low so I think there is substantial room for further increases.
FPI’s lease terms are usually 3 years so it takes 3 years of lease rolls to fully adjust to market rates.
Substantial AFFO growth ahead
Shown below are the sell-side consensus AFFO estimates for FPI.
S&P Global Market Intelligence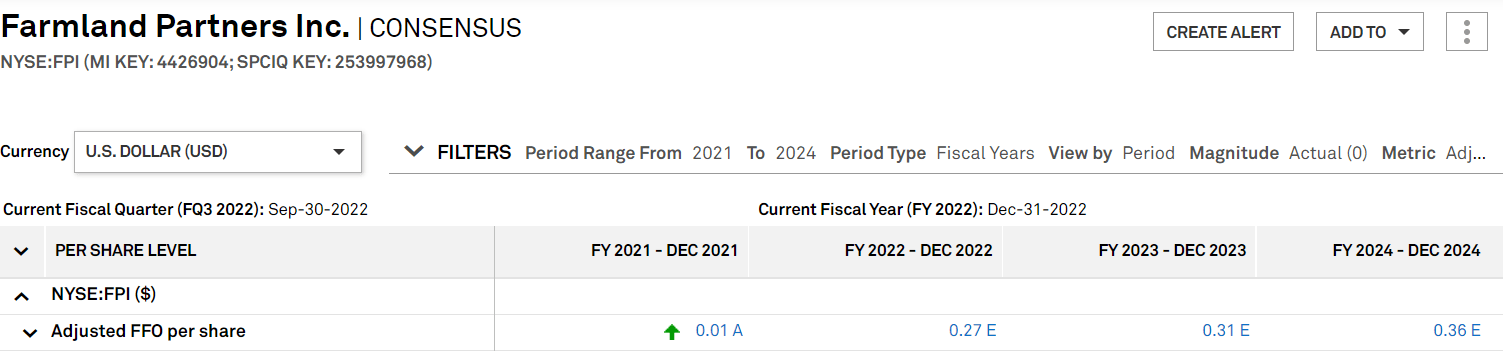
The huge jump from $0.01 in 2021 to $0.27 in 2022 is largely the result of the preferred B conversion. Beyond that, the analysts have FPI growing by $0.04 in 2023 and another $0.05 in 2024 representing a CAGR well north of 10%.
Fundamentally, I think this growth is quite reasonably achievable. The rental rate growth alone just about gets there and the revival of the high cap rate loan program does the rest. For those unfamiliar, FPI will sometimes provide loans to farmers at fairly high interest rates (roughly 7%-9%).
These are win-win loans because it gives farmers access to capital on short notice that they might not otherwise be able to get and FPI wins through the high return via the interest paid. I view risk level of these loans as extremely low because default would actually be a good thing for FPI as the loans are overcollateralized by farmland. In other words, a default would result in FPI acquiring farmland at somewhere around 60% of fair value.
Farmland Partners’ NAV growth
The USDA report that came out in August showed cropland values increasing 14.3% in 2022.
USDA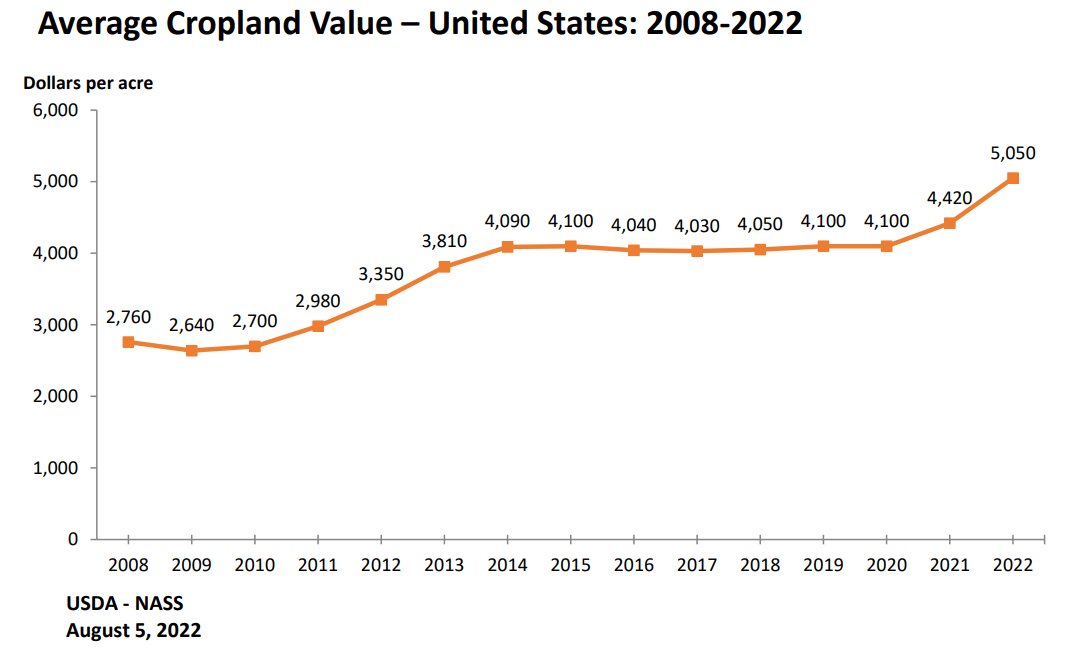
FPI has a market cap of $809 million.
It has assets of $1.166 billion at cost. True asset value is higher due to appreciation since purchase, but let’s go with this number for the math.
14.3% appreciation on $1.166 billion of assets is appreciation of $166.7 million. With 54.031 million shares outstanding 2022 asset appreciation was roughly $3.08 per share.
2022 was an unusual year. Farmland does not need inflation to appreciate, but the inflation certainly helped. Going forward I think appreciation will moderate from this high level down to a pace of about 7% per year before eventually falling down to a more normal 4%-6%.
At the 7% pace, FPI’s NAV would rise by about $1.50 per year. Against a stock price below $15, that alone is a 10% return (assuming market price stays a constant percentage of NAV).
Risks to investing in FPI
There are 2 types of risk that I think are worth discussing.
- Things that could make market price go down
- Things that are actually fundamentally concerning
A sharp downward move in corn and soybean prices tends to correspond to a drop in FPI’s price. The value of farmland is more related to long term fundamentals, so I don’t care all that much about spot pricing, but the market does. So if you are holding FPI short term or can’t stomach volatility, commodity prices are a risk factor.
Longer term fundamental concern
Brazil is number 1 on my threat list with regard to U.S. farmland. The country has a huge landmass and weather conditions permit more than 1 growing season of row crops per year. The only thing holding its production back is horrendous infrastructure resulting in increased crop spoilage before it gets to market among other problems.
They have the potential to avoid the catch 22 referenced above with regard to wealth and infrastructure reducing farmed acres because much like the U.S. they just have a ton of land.
Thus, Brazil getting its infrastructure game on point could long term impair price realizations of U.S. farmers.
For the sake of the world, I hope they do.
For the sake of my investment in FPI, I am watching it as a risk factor.
Be the first to comment