


halbergman/iStock via Getty Images
Earnings of Farmers and Merchants Bancorp, Inc. (NASDAQ:FMAO) will continue to grow through the end of 2023 on the back of organic loan growth. Slight margin expansion will also support the bottom line. Overall, I’m expecting Farmers and Merchants Bancorp to report earnings of $2.61 per share for 2022, up 30% year-over-year. For 2023, I’m expecting earnings to grow by 3% to $2.69 per share. The December 2023 target price is quite close to the current market price. Therefore, I’m adopting a hold rating on Farmers and Merchants Bancorp.
Organic Loan Growth to Drive Earnings
Farmers and Merchants Bancorp’s loan portfolio grew by a remarkable 5.3% in the third quarter, or 21% annualized. Loan growth will likely remain elevated in the fourth quarter partly because of merger and acquisition activity. Farmers and Merchants Bancorp completed the acquisition of People-Sidney Financial Corporation on October 3, 2022, as mentioned in a press release. Based on the information given in an older press release, I’m estimating the transaction to have increased Farmers and Merchants Bancorp’s loans by 5%. Further, robust pipelines will keep growth elevated till the end of 2022. The management mentioned in the earnings release that it has started the fourth quarter with a robust pipeline.
However, starting in early 2023, growth will most probably slow down as high borrowing costs will discourage borrowers. Further, Farmers and Merchants Bancorp relies on acquisitions for growth. The company has completed five acquisitions since 2019. As there are currently no upcoming M&A plans, I have excluded this factor from my forecast for next year. Instead, I’ve considered organic loan growth, which has been at best only moderate in the past.
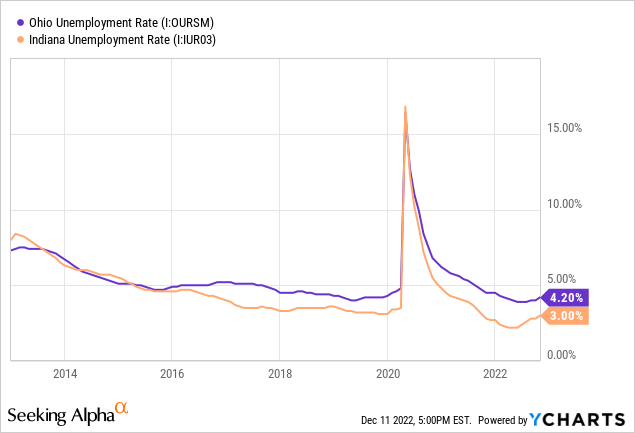
However, improving job markets will keep growth from dropping too low. Farmers and Merchants Bancorp mainly operates in Ohio and Indiana. The unemployment rates in both states are currently quite low compared to their respective histories.
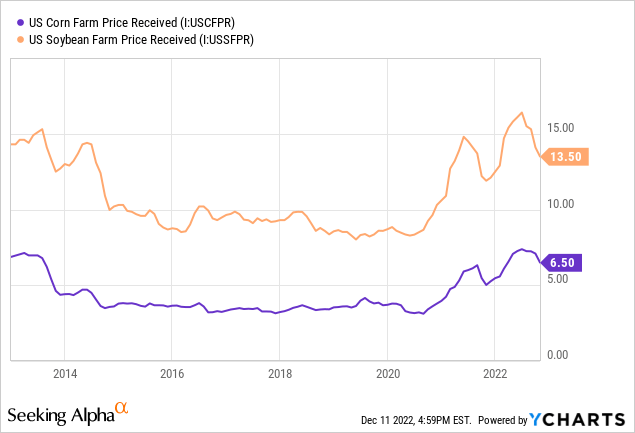
As agricultural loans make up around 16% of total loans, agricultural commodity prices are also an important indicator of credit demand. As shown below, commodity prices have recently started trending downwards but are still quite high in a historical context.
Considering these factors, I’m expecting the loan portfolio to grow by 18% in 2022 and 4% in 2023. Meanwhile, I’m expecting deposits to grow in line with loans. The following table shows my balance sheet estimates. (Please note that the tangible book value per share, TBVPS, given below is different from the TBVPS mentioned in the earnings release. This is because the management excludes unrealized gains/losses on securities from the calculation. I always include unrealized losses in my equity calculation for all banks and feel that it’s inappropriate to make an exception for FMAO. Unrealized losses are racked up on fixed-rate, available-for-sale securities when interest rates rise.)
| Financial Position | FY18 | FY19 | FY20 | FY21 | FY22E | FY23E |
| Net Loans | 840 | 1,212 | 1,289 | 1,841 | 2,165 | 2,253 |
| Growth of Net Loans | 2.9% | NA | 6.4% | 42.8% | 17.6% | 4.1% |
| Other Earning Assets | 178 | 238 | 404 | 502 | 414 | 431 |
| Deposits | 929 | 1,288 | 1,596 | 2,193 | 2,306 | 2,399 |
| Borrowings and Sub-Debt | 32 | 73 | 48 | 128 | 204 | 212 |
| Common equity | 143 | 230 | 249 | 297 | 277 | 290 |
| Book Value Per Share ($) | 15.6 | 20.9 | 22.5 | 25.7 | 21.3 | 22.3 |
| Tangible BVPS ($) | 15.2 | 16.6 | 18.2 | 18.7 | 15.1 | 16.1 |
| Source: SEC Filings, Earnings Releases, Author’s Estimates (In USD million unless otherwise specified) | ||||||
Apart from loan growth, slight margin expansion will also help the net interest income. Due to the portfolio’s focus on real-estate loans, most loans are based on fixed rates. According to the details given in the 10-Q filing, fixed-rate loans made up a whopping 72% of total loans at the end of September 2022. The results of the management’s interest-rate sensitivity analysis given in the 10-Q filing showed that a 200-basis points hike in interest rates could boost the net interest income by just 3.38% over twelve months. Considering these factors, I’m expecting the margin to increase by two basis points in the last quarter of 2022 and a further four basis points in 2023.
Recent Asset Quality Improvement to Ease the Pressure on Provisioning
Farmers and Merchants Bancorp reported above-average provisioning for the last two quarters. The credit quality of the loan portfolio has substantially improved this year as the economy has recovered. Nonperforming loans were down to 0.26% of total loans by the end of September 2022 from 0.43% at the end of December 2021. As a result of this improvement, allowances rose to 365.4% of nonperforming loans by September 2022 from 201.1% at the end of December 2021. As the allowances now appear somewhat excessive, I think future additions to the allowances (or provisioning expenses) will remain subdued.
On the other hand, the high-inflation environment and threats of a recession will require vigilance and buffering of reserves for loan losses. Overall, I’m expecting Farmers and Merchants Bancorp to report a net provision expense of 0.22% of total loans in 2023, down from 0.31% (annualized) in the last two quarters but still above the last five-year average of 0.18%.
Earnings Likely to Grow Slightly
The anticipated loan growth will be the chief earnings driver through the end of 2023. Further, slight margin expansion will help lift the bottom line. Overall, I’m expecting Farmers and Merchants Bancorp to report earnings of $2.61 per share for 2022, up 30% year-over-year. For 2023, I’m expecting earnings to grow by 3% to $2.69 per share. The following table shows my income statement estimates.
| Income Statement | FY18 | FY19 | FY20 | FY21 | FY22E | FY23E |
| Net interest income | 40 | 54 | 60 | 69 | 88 | 97 |
| Provision for loan losses | 0 | 1 | 7 | 3 | 5 | 5 |
| Non-interest income | 11 | 12 | 17 | 18 | 15 | 15 |
| Non-interest expense | 32 | 41 | 44 | 54 | 55 | 62 |
| Net income – Common Sh. | 15 | 18 | 20 | 23 | 34 | 35 |
| EPS – Diluted ($) | 1.61 | 1.66 | 1.80 | 2.01 | 2.61 | 2.69 |
| Source: SEC Filings, Earnings Releases, Author’s Estimates (In USD million unless otherwise specified) | ||||||
My estimates are based on certain macroeconomic assumptions that may not come to pass. Therefore, actual earnings can differ materially from my estimates.
The Current Market Price is Close to Next Year’s Target Price
Farmers and Merchants Bancorp has been hiking up its dividend at least once a year since 2018. Given the earnings outlook, it’s likely that the company will maintain the dividend trend next year. Therefore, I’m expecting the company to pay around $0.88 per share for the full year of 2023. The earnings and dividend estimates suggest a payout ratio of 33% for 2023, which is close to the five-year average of 36%. Based on my dividend estimate, FMAO is offering a forward dividend yield of 3.1%.
I’m using the historical price-to-tangible book (“P/TB”) and price-to-earnings (“P/E”) multiples to value Farmers and Merchants Bancorp. The stock has traded at an average P/TB ratio of 1.43 in the past, as shown below.
| FY19 | FY20 | FY21 | Average | |||
| T. Book Value per Share ($) | 16.6 | 18.2 | 18.7 | |||
| Average Market Price ($) | 28.5 | 23.2 | 24.2 | |||
| Historical P/TB | 1.72x | 1.27x | 1.29x | 1.43x | ||
| Source: Company Financials, Yahoo Finance, Author’s Estimates | ||||||
Multiplying the average P/TB multiple with the forecast tangible book value per share of $16.1 gives a target price of $23.0 for the end of 2023. This price target implies a 19.8% downside from the December 9 closing price. The following table shows the sensitivity of the target price to the P/TB ratio.
| P/TB Multiple | 1.23x | 1.33x | 1.43x | 1.53x | 1.63x |
| TBVPS – Dec 2023 ($) | 16.1 | 16.1 | 16.1 | 16.1 | 16.1 |
| Target Price ($) | 19.8 | 21.4 | 23.0 | 24.7 | 26.3 |
| Market Price ($) | 28.8 | 28.8 | 28.8 | 28.8 | 28.8 |
| Upside/(Downside) | (31.1)% | (25.5)% | (19.8)% | (14.2)% | (8.6)% |
| Source: Author’s Estimates |
The stock has traded at an average P/E ratio of around 14.0x in the past, as shown below.
| FY19 | FY20 | FY21 | Average | |||
| Earnings per Share ($) | 1.66 | 1.80 | 2.01 | |||
| Average Market Price ($) | 28.5 | 23.2 | 24.2 | |||
| Historical P/E | 17.2x | 12.8x | 12.0x | 14.0x | ||
| Source: Company Financials, Yahoo Finance, Author’s Estimates | ||||||
Multiplying the average P/E multiple with the forecast earnings per share of $2.69 gives a target price of $37.7 for the end of 2023. This price target implies a 31.2% upside from the December 9 closing price. The following table shows the sensitivity of the target price to the P/E ratio.
| P/E Multiple | 12.0x | 13.0x | 14.0x | 15.0x | 16.0x |
| EPS 2023 ($) | 2.69 | 2.69 | 2.69 | 2.69 | 2.69 |
| Target Price ($) | 32.4 | 35.0 | 37.7 | 40.4 | 43.1 |
| Market Price ($) | 28.8 | 28.8 | 28.8 | 28.8 | 28.8 |
| Upside/(Downside) | 12.5% | 21.9% | 31.2% | 40.6% | 49.9% |
| Source: Author’s Estimates |
Equally weighting the target prices from the two valuation methods gives a combined target price of $30.4, which implies a 5.7% upside from the current market price. Adding the forward dividend yield gives a total expected return of 8.8%. Hence, I’m adopting a hold rating on Farmers and Merchants Bancorp.
Be the first to comment