

Win McNamee
Exxon appears to be one of the rare US-based stocks with a long-term return and long-term dividend growth.
Solid fundamental growth short term with expected rising dividend performance
Forward guidance for Exxon’s peak oil production could decline as a move toward green energy takes hold after a year from now. One can see the declining revenue and net profit, but no one can deny that Exxon could be a valuable dividend play beyond late 2024. The dividend yield is expected to climb at that time.
|
YEARLY ESTIMATES |
2022 |
2023 |
2024 |
2025 |
2026 |
|
Revenue |
450,277 |
424,578 |
344,982 |
311,357 |
285,776 |
|
Dividend |
3.58 |
3.71 |
3.82 |
4.11 |
– |
|
Dividend Yield (in %) |
3.59 % |
3.72 % |
3.82 % |
4.12 % |
– |
|
EPS |
12.95 |
11.05 |
9.07 |
7.61 |
6.55 |
|
P/E Ratio |
7.71 |
9.03 |
11.01 |
13.12 |
15.24 |
|
EBIT |
79,552 |
66,315 |
47,025 |
37,126 |
36,496 |
|
EBITDA |
103,315 |
89,147 |
71,015 |
60,852 |
61,133 |
|
Net Profit |
54,077 |
44,000 |
34,758 |
28,501 |
24,725 |
|
Net Profit Adjusted |
54,512 |
44,196 |
34,711 |
30,216 |
24,725 |
|
Pre-Tax Profit |
77,858 |
66,267 |
46,247 |
37,248 |
36,107 |
|
Net Profit (Adjusted) |
73,825 |
60,393 |
45,972 |
– |
– |
|
Gross Income |
197,319 |
165,035 |
145,204 |
– |
– |
|
Shareholder’s Equity |
194,838 |
207,507 |
219,619 |
217,284 |
207,115 |
|
Total Assets |
375,388 |
387,984 |
400,621 |
390,455 |
375,445 |
Source: Business Insider
The latest catalyst to drive American independent energy production
With the recent news of OPEC raising their prices with Saudi Arabia cutting production, this is a predictable price move for oil over the long run. Also, some American politicians question why their country does not explore domestic energy. This will also enhance the country’s security while being less dependent on foreign oil.
From the stock price of XOM, you can see various standard simple moving average periods of 20, 50, and 200; it is strong compared to the overall standard benchmarks of large USA significant major indices.
RSI of 57 is still reasonably valued with some room to still grow.
Profit is not solid but positive, considering the current price of oil. If oil goes up, you can imagine the impact rising oil prices will have on this stock as people look for short-term solid returns on any stock with potential growth.
|
Values |
|
|
SMA20 |
5.42% |
|
SMA50 |
4.51% |
|
SMA200 |
13.72% |
|
RSI (14) |
57.06 |
|
Profit Margin |
11.10% |
Source: FINVIZ
Technical Analysis Shows Immense Short-Term Strength
Fibonacci
As this technical indicator shows, the price of XOM is getting overvalued at the top end. Based on the current momentum and need for a return, many investors may continue to pile into this stock over the next few months. Few companies can generate this excitement with the fear of missing out.
Fibonacci for XOM (Customer platform)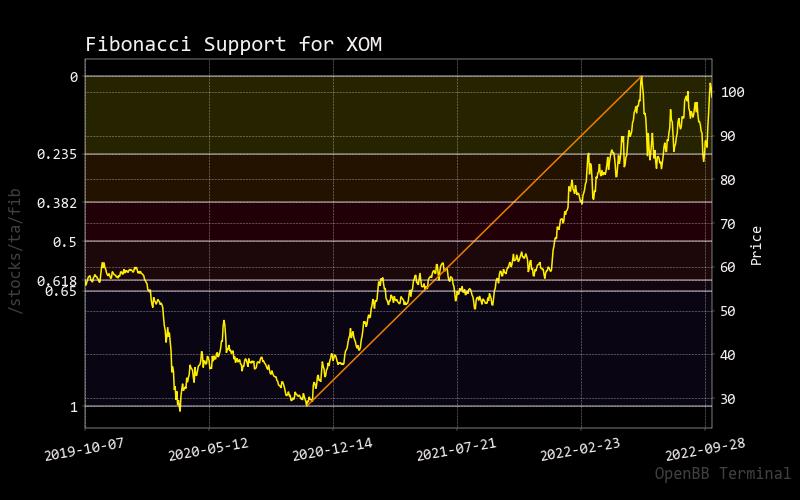
Bollinger Bands
As the price does hit the upper bound of this indicator, I would expect the XOM stock price to drop temporarily to enable the Bollinger Band to reflect the strong momentum of this stock.
Bollinger bands for XOM (Custom platform)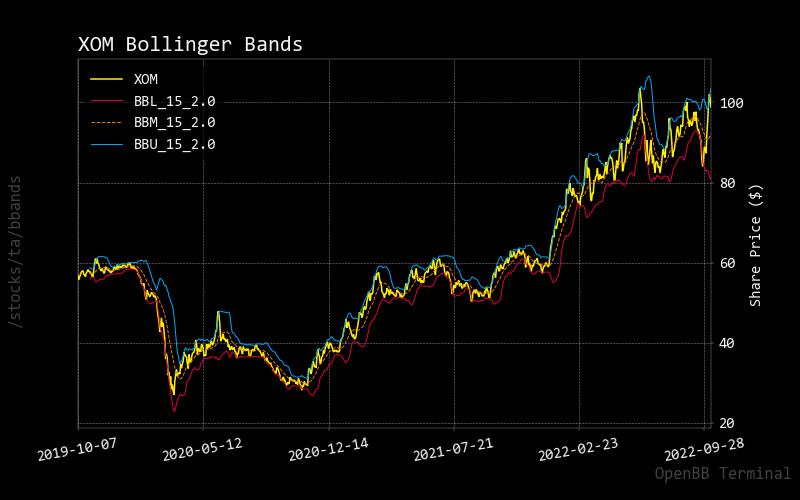
What do Monte Carlo Simulations suggest?
Data prediction shows a strong probability of higher prices moving into early next year. Also, the probability distribution of data prediction shows increased price into the range of well past $100 as pricing momentum continues.
Monte Carlo for XOM (custom platform)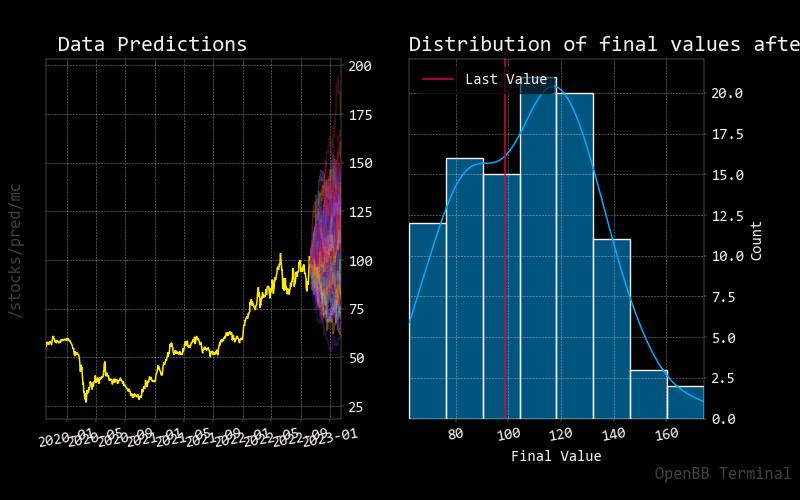
Based on the regression forecasting, it is suspected that XOM’s share price could be stable over the next 14 days but will continue to rise over the next month.
Regression prediction for XOM (custom platform)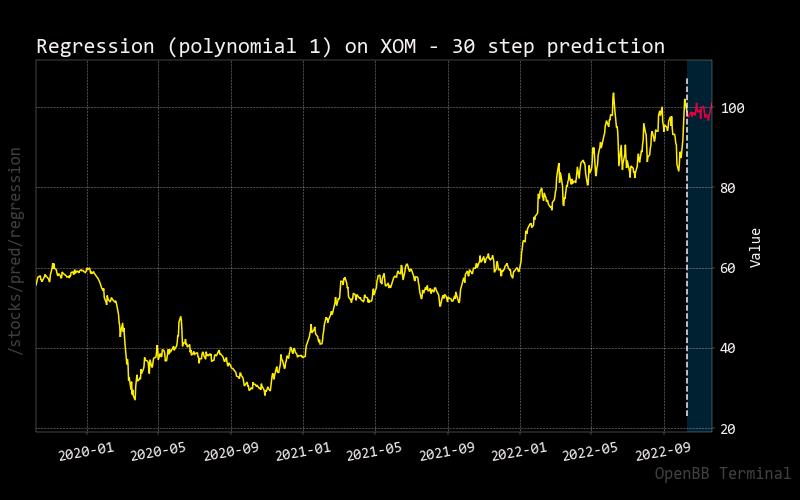
Risk is low for long-term returns.
Price vs. Short Volume
The remainder of the year shows relatively low shorting volume compared to all trading volume. Considering the downward pressure in global markets, it seems XOM is an outstanding stock to hold as it retains value in price.
shorts vs total volume XOM (custom platform)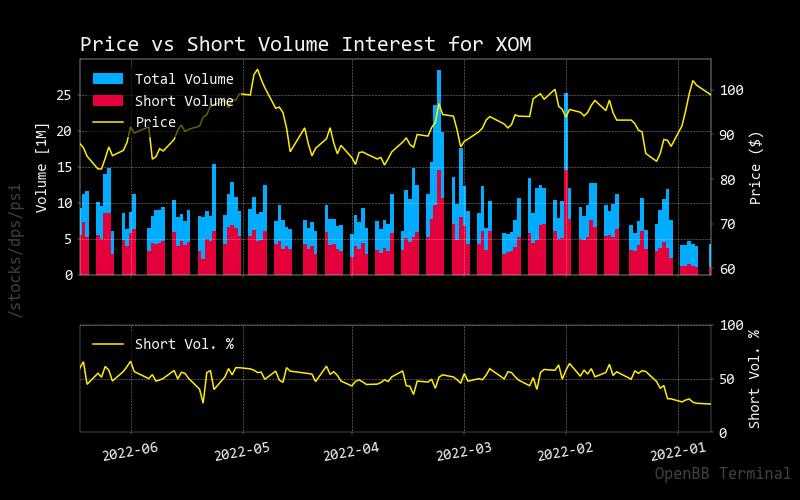
Source: StockGrid
Insider Activity
Judging from specific insider activity stats, one can see prominent positions are being taken, which shows confidence in the stock at that time.
|
Date |
Shares Traded |
Shares Held |
Price |
Type |
Option |
Insider |
Trade |
|
2022-08-03 |
108,467.00 |
285,467.00 |
87.08 |
Buy |
No |
Goff Gregory James |
108467.0 |
|
2022-08-03 |
169,214.00 |
454,681.00 |
88.36 |
Buy |
No |
Braly Angela F |
169214.0 |
|
2022-08-03 |
682,319.00 |
1,137,000.00 |
88.77 |
Buy |
No |
INCLUSIVE CAPITAL PARTNERS, L.P. |
682319.0 |
|
2022-08-04 |
35,439.00 |
1,172,439.00 |
86.86 |
Buy |
No |
Avery Susan K |
35439.0 |
|
2022-08-04 |
4,561.00 |
1,177,000.00 |
87.82 |
Buy |
No |
Fox Leonard M. |
4561.0 |
Source: Business Insider
Price Target vs. Actual Stock Price
As you can see, the price has been nearly reached with the share price of XOM. The gap between other weaker stocks has been much broader, reflecting how XOM outperforms most companies, including competition.
target vs actual price XON (custom platform)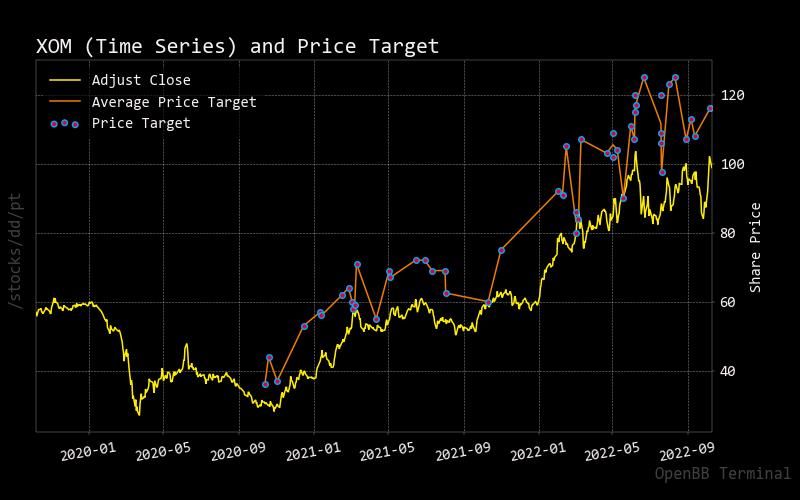
Source: Business Insider
Conclusion
Compared to other energy stocks, Exxon has some growth ahead as political calls for domestic oil production increase. Also, we approach a crucial midterm election in a few weeks. If Republicans take control of Congress, it might strengthen XOM’s share as this party typically supports domestic energy independence. This will help Exxon’s stock price over the next few months into early 2023. All forecasting charts appear to confirm this, resulting in the high conviction of a continued buy call early next year. Based on the fundamentals, it also carries a positive story with a long-term dividend growth story in the coming years.
Be the first to comment