

jwblinn/iStock via Getty Images
Investment Thesis
Exxon Mobil Corporation (NYSE:XOM) had rallied by over 250% in the past two years, from $34.32 on 16 March 2020 to $86.12 on 17 June 2022. It is also evident that the company had more than recovered from the slump in FY2020, since it reported impressive YoY revenue growth of over 55% in FY2021. In addition, XOM reported excellent growth in its operating margins, net income, and Free Cash Flows (FCF) in the past year, thereby justifying the sustained gain in its stock price.
Yet, with the potential recession triggering a 17.6% plunge in XOM’s stock prices, from a high of $104.59 on 8 June 2022, the market appears apprehensive about slowing demand moving forward. Based on the fact that the S&P 500 Index has declined by -13.02% in the past year while the United States Oil ETF, LP (USO) and Energy Select Sector SPDR ETF (XLE) have rallied by 73.48% and 36.12%, respectively, it seems like Mr. Market could be finally coming for these gas and oil commodities stocks. Despite an attractive buy rating from the consensus estimates with a price target of $103.18, we are slightly apprehensive, since the time of massive correction could be upon us soon. Only time will tell.
XOM Is Most Likely To Report Another Monster Quarter In FQ2’22
XOM Revenue and Gross Income
S&P Capital IQ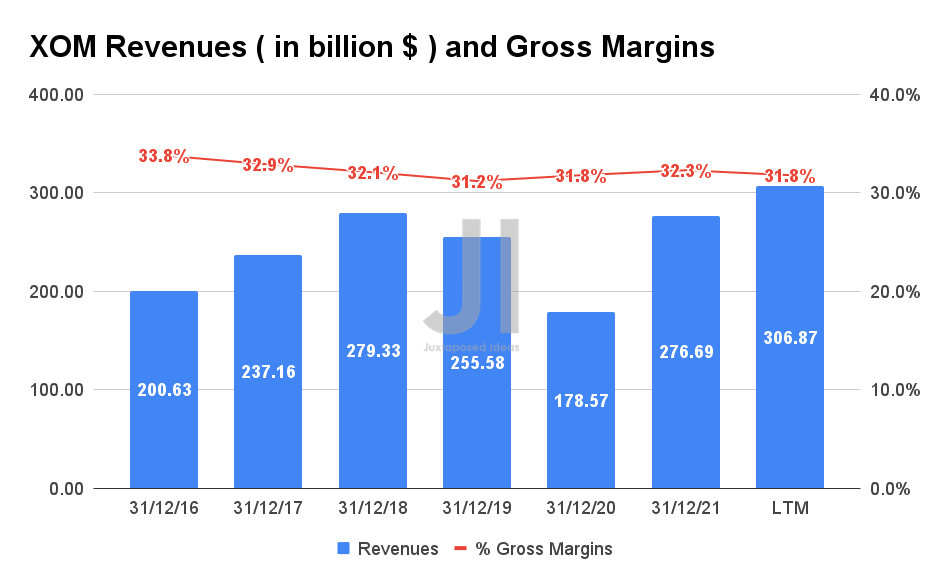
XOM reported revenues of $306.87B in the last twelve months (LTM), with relatively decent gross margins of 31.8%. Analysts will be comparing its upcoming performance with FQ1’22, when the company reported revenues of $87.73B and FQ2’21 revenues of $65.9B.
XOM Revenue By Segment
S&P Capital IQ
In addition, XOM would need to sustain its stellar YoY growth of over 80% for the upstream segment, 50% for the downstream segment, and 20% for the chemical segment from its FQ1’22 earnings call. Assuming a similar repeat performance, we may expect to see the company report up to $9.9B for the upstream segment, $76.41B for the downstream segment, and $11.3B for the chemical segment. Though speculative, that would bring XOM’s FQ2’22 revenue to an estimated total of $97.61B, representing an increase of 11.2% QoQ and 48% YoY. We shall see.
XOM Net Income and Net Income Margin
S&P Capital IQ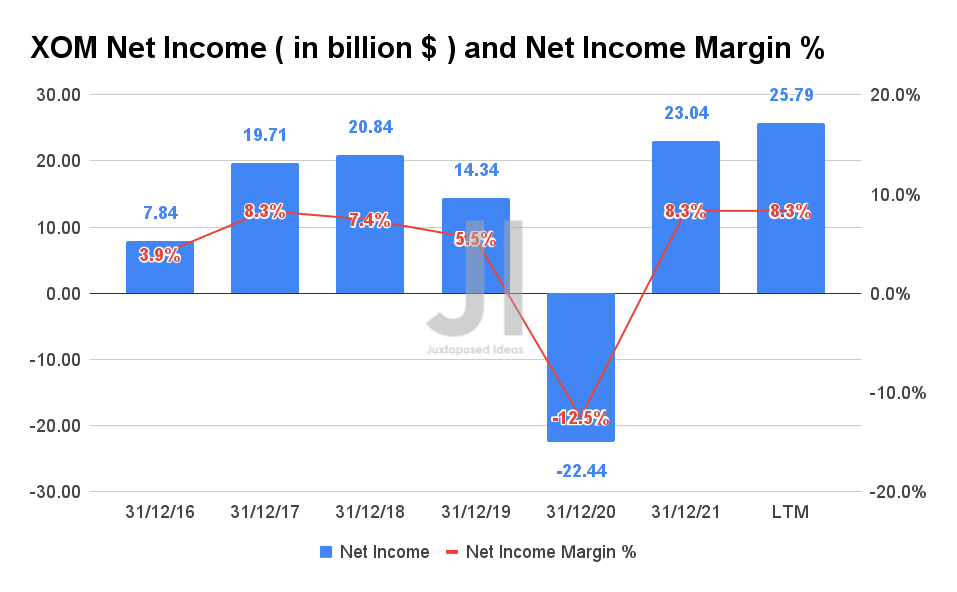
In the LTM, XOM reported $25.79B of net income with net income margins of 8.3%, representing a massive increase of 79.8% from FY2019. In addition, the company also raked in a record-breaking $40.07B of FCF and FCF margin of 13% in the LTM, representing a gargantuan 761.7% growth from FY2019 levels. As a result, XOM reported robust cash and equivalents of $11.07B on its balance sheet. Furthermore, the company also increased its share buyback program from $10B to $30B through 2023, thereby indicating its massive liquidity for the next few quarters.
XOM Cash/ Equivalents, FCF, and FCF Margins
S&P Capital IQ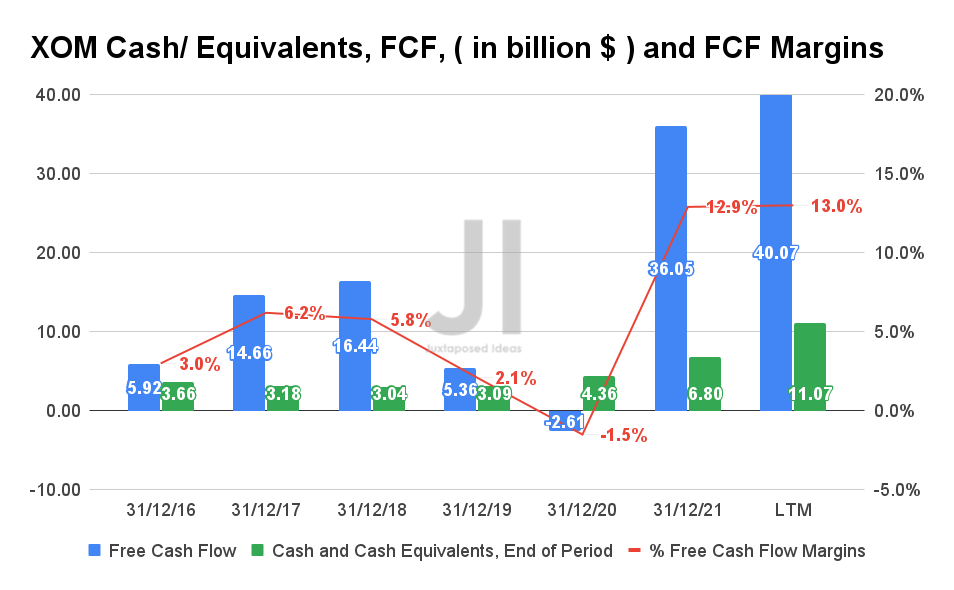
XOM Operating Expenses
S&P Capital IQ
XOM has also been holding its costs rather prudently in the past few years, with a total of $64.78B of operating expenses, on top of other expenses of $33.8B in the LTM. However, given that the company guided higher capital expenditures to increase its production and expand its refining capacity in the US, we may expect slightly reduced FCF profitability in FY2022, given the guidance of up to $24B in capex, nearly double YoY. Nonetheless, we are not concerned, since these will directly translate to its top and bottom-line growth moving forward, given the current limited supply.
XOM Net PPE, Capex, and Long-Term Debt
S&P Capital IQ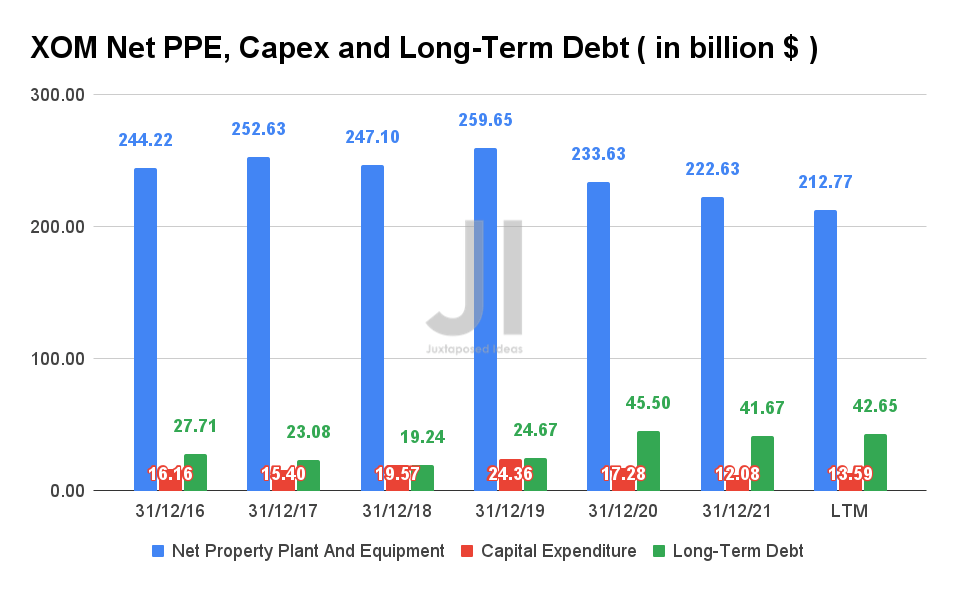
XOM Projected Revenue and Net Income
S&P Capital IQ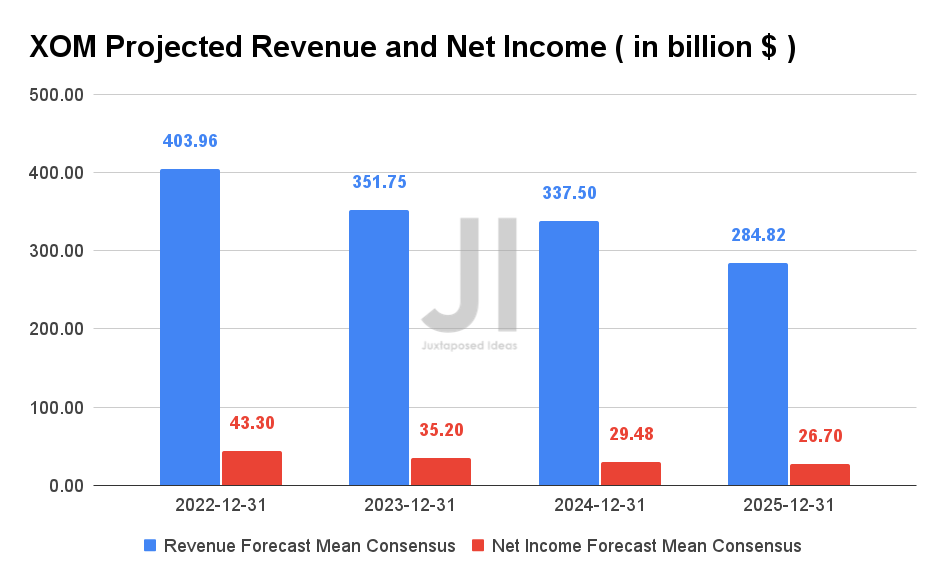
For the next four years, XOM is expected to report decelerating revenue growth at a CAGR of -11% and net income at -14.88%. Nonetheless, consensus estimates that the company will report massive revenues of $403.96B and a net income of $43.3B, representing immense YoY growth of 45.99% and 87.9%, respectively.
We will also be anticipating its FQ2’22 earnings in the next week, though it is almost certain that XOM will be reporting another monster quarter with stellar QoQ and YoY growth in revenue and net income profitability. Nonetheless, given the recent pessimism, it is uncertain if Mr. Market will reward the stock with recovery or sideways price action.
So, Is XOM Stock A Buy, Sell, or Hold?
XOM 5Y EV/Revenue and P/E Valuations
S&P Capital IQ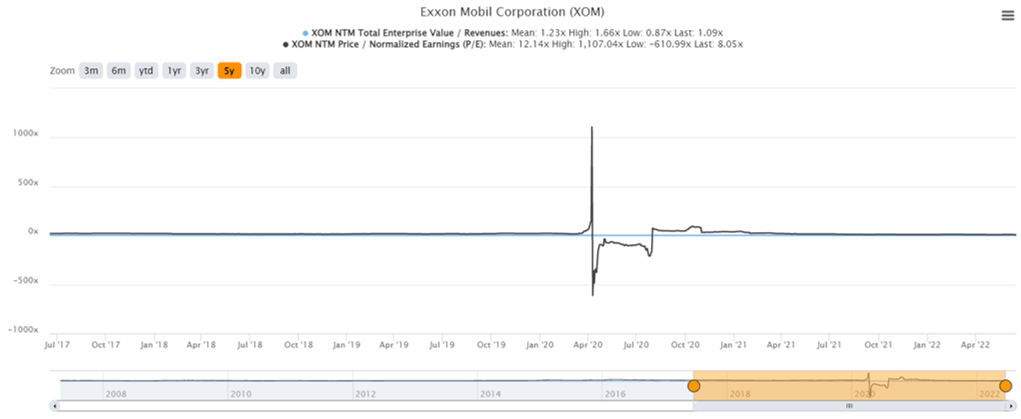
XOM is currently trading at an EV/NTM Revenue of 8.05x and NTM P/E of 1.09x, lower than its 5Y mean of 15.29x and 1.17x, respectively. The stock is also trading at $86.12, down 18.4% from its 52 weeks high of $105.57, though at a premium of 65.2% from its 52 weeks low of $52.10. It is evident that the XOM stock had been on a tear in the past two years, hitting stock highs similar to those in July 2014. Though the stock had barely appreciated by 4.63% in the past five years, long-term XOM investors would have also been decently rewarded by its dividends with a total of 36.2% stock price return in the same time frame.
XOM 5Y Stock Price
Seeking Alpha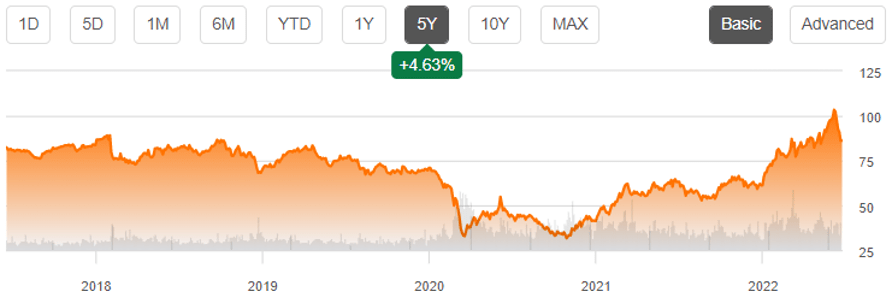
Nonetheless, it is also apparent that XOM has had a notable plunge in recent days, further worsened by the recent Fed’s hike in interest rates. Given the market-wide pessimism, there is also a strong likelihood of a moderate retracement in the next few days. Therefore, despite the low supplies, we encourage energy investors to be patient as the market stabilizes for some time, especially with the current baked-in premium. In addition, with XOM reporting FQ2’22 earnings soon, we expect to see some volatility in the short term.
Therefore, we rate XOM stock as a Hold for now.
Be the first to comment