

da-kuk
iShares MSCI Canada ETF (NYSEARCA:EWC) is an exchange-traded fund that provides investors with exposure to mid- and large-cap Canadian equities. The expense ratio is 0.50%, and the year-to-date performance has been -9.15% as compared to the S&P 500 U.S. equity index’s decline of -16.75%. That is on a “price-only” basis. The out-performance has been helped by higher commodity prices, which have buffered the decline of EWC’s portfolio, given Canada’s higher economic exposure to oil and gas. Crude and refined petroleum are two of the country’s top three exports.
EWC’s net assets under management have risen over the past year (see below) by circa $223 million, totaling $4.04 billion as of November 11, 2022.
ETFDB.com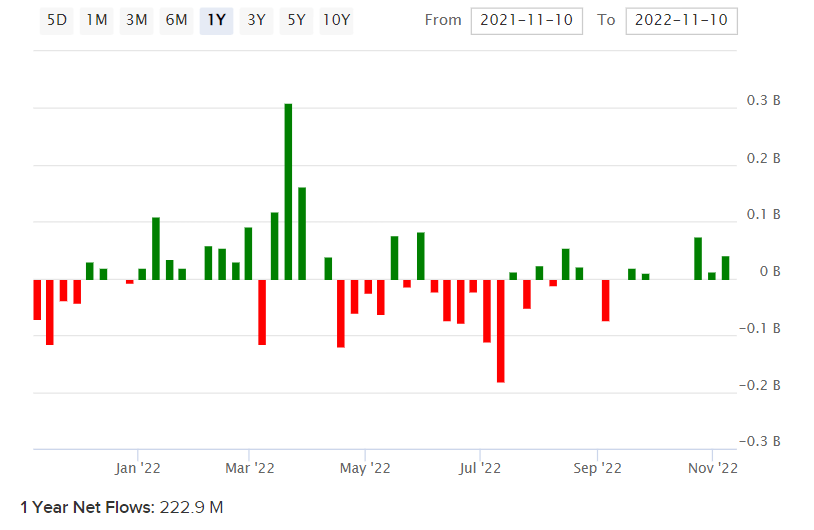
Equity markets have broadly fallen in recent times, so the recent turmoil in markets which have been driven in this case largely by inflationary pressures (including in energy markets) have allowed EWC to modestly out-perform in spite of the fund also falling on an absolute basis.
I last covered EWC in May 2021, in which I thought the fund was undervalued relative to U.S. equities. Since then, performance has been much more similar to the S&P 500 (-2.15% and -4.76%, respectively, again on a price-only basis). So, over a longer time frame EWC seems to be tracking U.S. equities quite closely, and therefore we could say “risk-taking” more broadly. However, since inception, the relationship looks different. Below is a chart illustrating the ratio between EWC and the S&P 500.
TradingView.com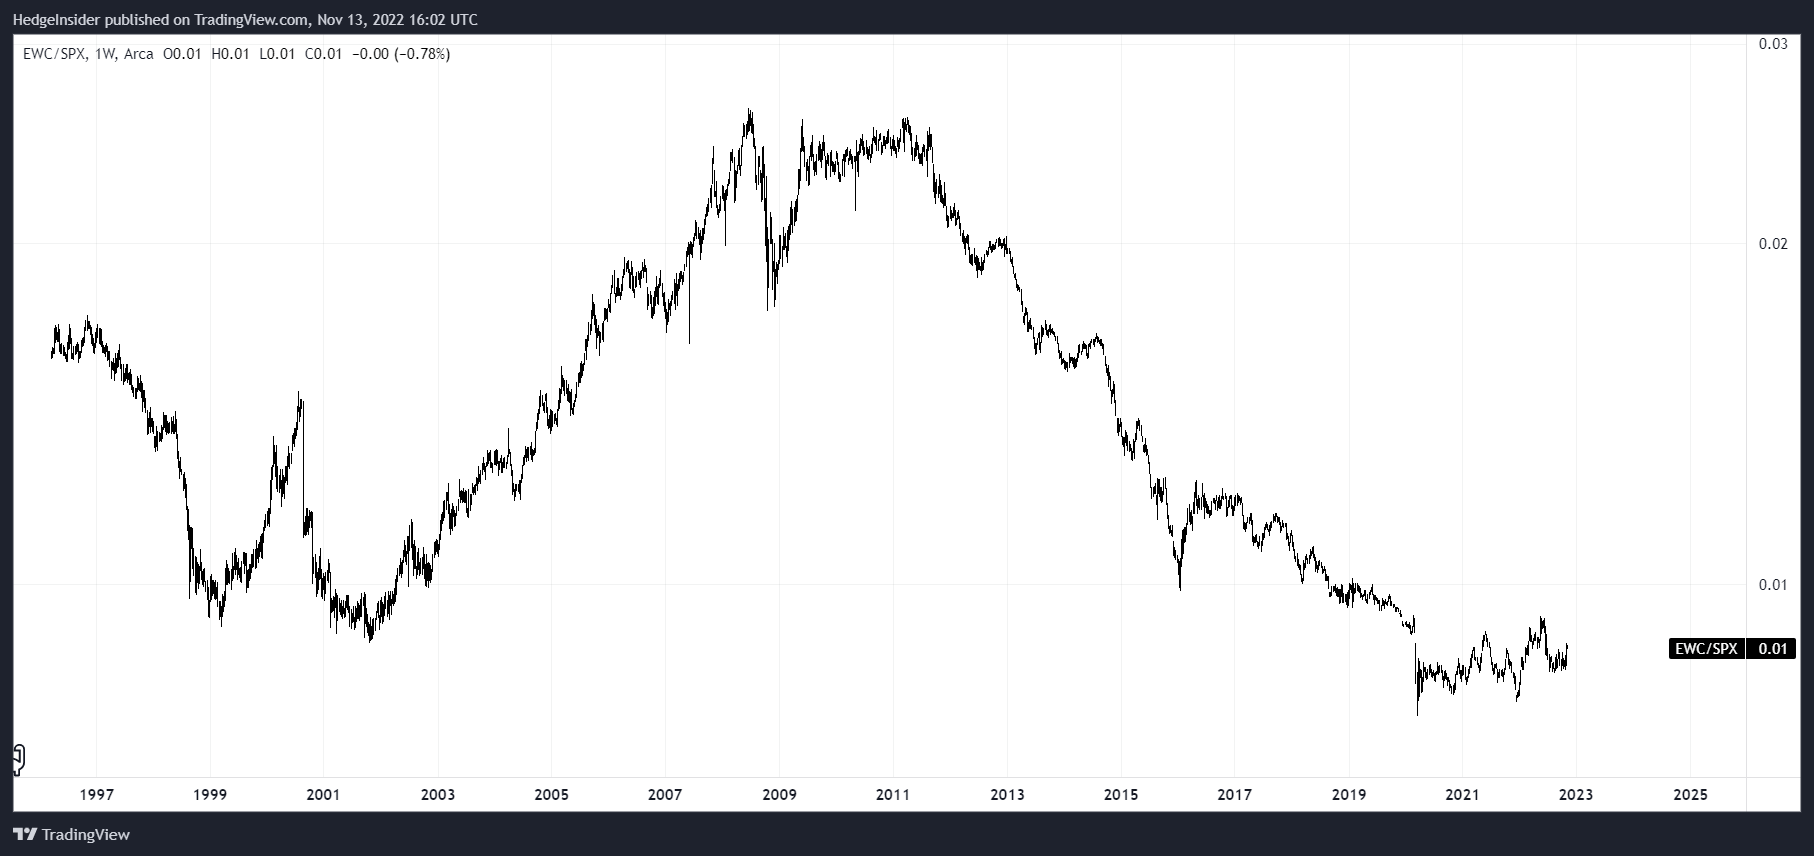
The long-term relationship is negative, since at least 2011, and you could argue since 2008. It was since 2008/11 that the big-tech stocks of the United States emerged as behemoths; this explains the majority of the out-performance of U.S. equities. However, the narrative surrounding “big tech” is perhaps waning, which opens up the possibility for out-performance of Canadian equities once again (at the very least on a short- to medium-term basis, if not beyond five years). Therefore, it is still worth evaluating the current value of EWC’s portfolio.
EWC seeks to replicate the performance of the MSCI Canada Custom Capped Index, its chosen benchmark index. The benchmark’s most recent factsheet, as of October 31, 2022, provides us with trailing and forward price/earnings ratios of 13.39x and 11.32x, respectively. The price/book ratio was 1.89x. That implies a forward return on equity of 16.7%, and a forward earnings yield of 8.83%. The reported dividend yield was 3.20%, implying a dividend distribution rate of 42.85%.
Keeping most of these factors constant, but assuming that the return on equity settles to a lesser 12.5% or so by year six, I project the potential IRR of EWC over the next five years as being around 9.7%.
Author’s Calculations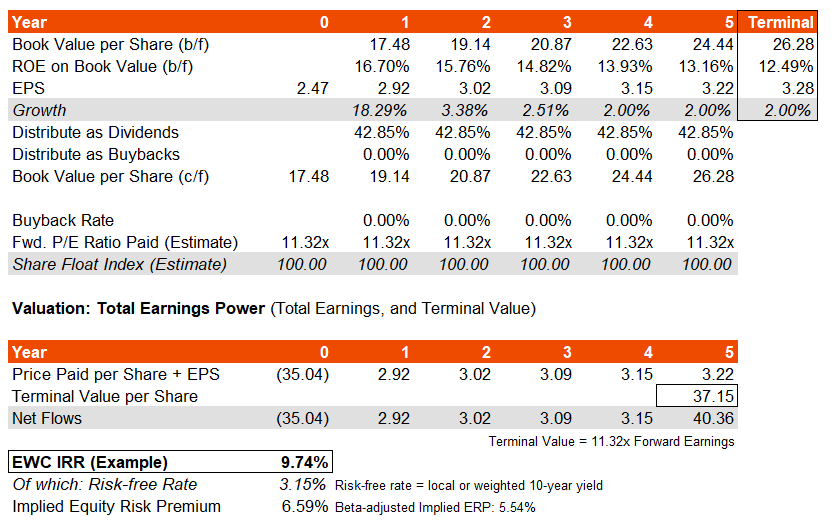
That also assumes no share buybacks, although if you factored in share buybacks, you could probably argue a higher return on equity. In any case, my three- to five-year average earnings growth rate as above works out to be 5.45-7.82%, against Morningstar‘s consensus average of 7.51% as of recent. The earnings growth appears to be mostly front-loaded given the lower forward price/earnings ratio as estimated by MSCI themselves.
The most recent 10-year yield for Canada is 3.15%; using this as a risk-free rate reference point, the underlying equity risk premium on the above assumptions comes to 6.59%. On a beta-adjusted basis (EWC’s longer-term beta is about 1.19x), that comes to about 5.54%. Usually I would estimate an ERP of 4.2-5.5% for mature markets excluding any country risk premium. So, this beta-adjusted figure of 5.54% suggests the potential for modest under-valuation. That, as well as the fund’s favorable cyclical sector exposures (see below), would suggest that EWC has the potential to continue to do relatively well over the next 12 months or so.
Morningstar.com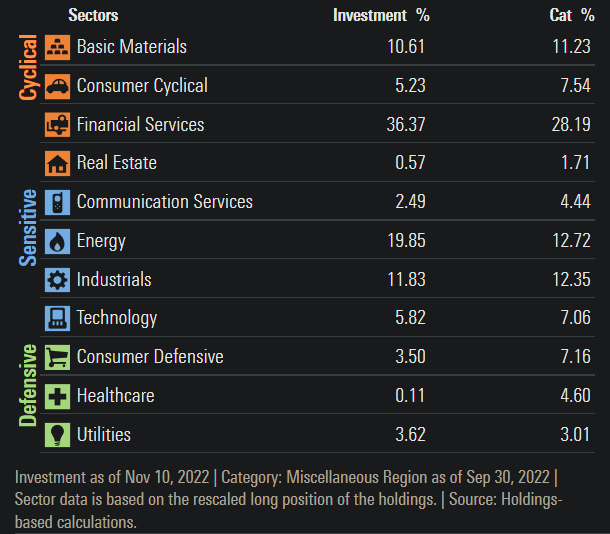
However, risks remain. The energy sector (about 20% of the fund as of November 10, 2022) is inherently volatile, albeit generally less volatile on an equity basis (as opposed to investing directly in commodities). Having said that, The Economist’s Big Mac Index suggests the Canadian dollar could be modestly overvalued (PPP model, on a GDP-per-capita adjusted basis). If the Canadian dollar is 0-10% undervalued, and this value-gap were to close, you could argue that any fundamental “misvaluation” in EWC’s share price is unlikely to be enough to beat the potential FX variance. Also, U.S. bond yields are higher than Canadian comparables, making the U.S. dollar modestly more attractive on a carrying basis.
Having said the above, the Canadian dollar is probably fairly valued given the country’s recent modest current account surplus (which tends to indicate under-valuation). The current account to GDP just rose to +0.10% in 2021. Therefore, USD/CAD stands to potentially fall, in spite of the exchange rate’s unfavorable interest rate spread from a “short” perspective, and in spite of PPP models suggesting fair value at best.
TradingEconomics.com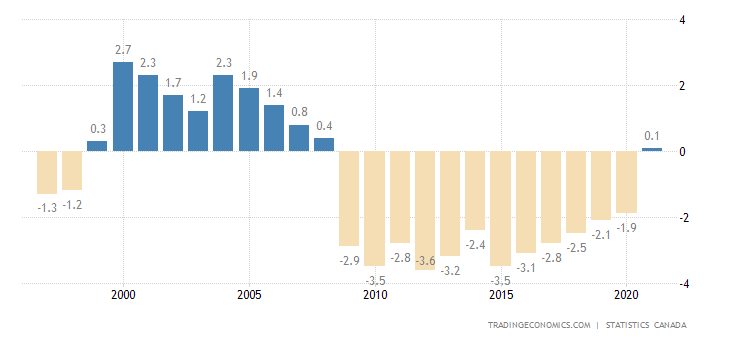
On balance, as the world economy slowly heads into a new business cycle (albeit with nearer-term recessionary risks), I expect markets to lead the real economy by up to 12 months, and thus EWC is likely to appreciate and perform well over the next few years. The IRR potential may well be up to 10%. However, given minor potential FX risks, as well as the more prominent risk of EWC’s high energy sector exposures (both direct and indirect; the Canadian dollar itself is subject to energy market volatility), I would suggest there are better investment opportunities that are likely to be lower risk at a similar or even better return profile. Therefore, I think it is sensible to take a neutral stance.
Be the first to comment