

Genuine Parts Company Stock: Current Valuation Leaves No Margin For Error slobo/iStock Unreleased via Getty Images
Genuine Parts Company (NYSE:GPC) is a global distributor of automotive and industrial replacement parts. Genuine Parts started back in 1928 and has since grown into the global giant that it is today which operates in 17 different countries. Genuine Parts has a truly global distribution network with operations covering North America, Europe, and Australasia.
GPC Revenue by Region (Q3 FY 2022 Earnings Presentation)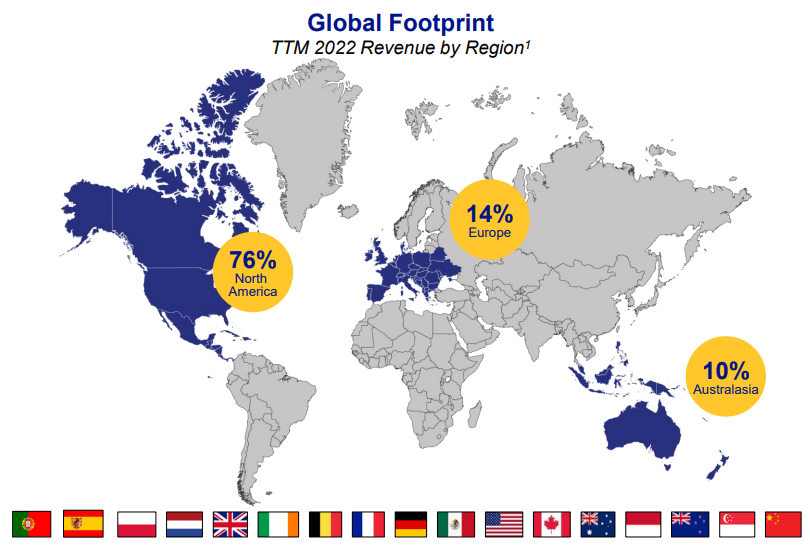
North America is by far the largest region in terms of revenue with 76% of the TTM revenue coming from those markets. Europe accounted for 14% of sales over that period with Australasia making up the remaining 10%.
Genuine Parts’ growth over time has led them to 800 warehouses, with 200 distribution facilities, and nearly 9,600 retail locations.
The automotive segment still makes up nearly 2/3 of Genuine Parts’ revenue; however, through continued acquisition and expansion Genuine Parts’ industrial segment has grown to just over 1/3 of sales.
Genuine Parts employs an acquisition heavy business model to expand their footprint. The most recent being Kaman Distribution Group completed earlier this year which further expanded their offerings primarily in the United States. The KDG acquisition improved their footprint with power transmission, automation, and fluid power parts distribution.
In addition to selling replacement parts to the everyday DIY consumer, Genuine Parts also serves what they call the DIFM, do it for me, market which consists of local, regional and national repair centers. With the DIFM segment Genuine Parts also offers inventory management and cataloging to ensure that the parts that are needed are available. The automotive parts segment has grown into the large automotive parts network globally.
The industrial parts group operates in both North America and Australasia in much the same way as the automotive segment as a distributor of consumable/replacement parts and tools. Providing parts sourced from over 170,000 OEM and MRO, maintenance, repair and operation customers.
Their customers are extremely diversified through end markets with exposure to food and beverage, mining, oil and gas, pharmaceuticals and many more where they have access to over over 12 million products. Genuine Parts also offer inventory management systems as well as asset repair and tracking services.
Genuine Parts is kind of like the consumer staples for anything that moves in that they source and provide replacement parts for automotive and industrial uses.
Both the automotive and industrial segments are very much the same at their core with the primary difference being the industrial segment does not have the everyday consumer facing retail. However, the bulk of the business between the two are the same and allows for Genuine Parts to implement ideas borne out of one segment easily into the other.
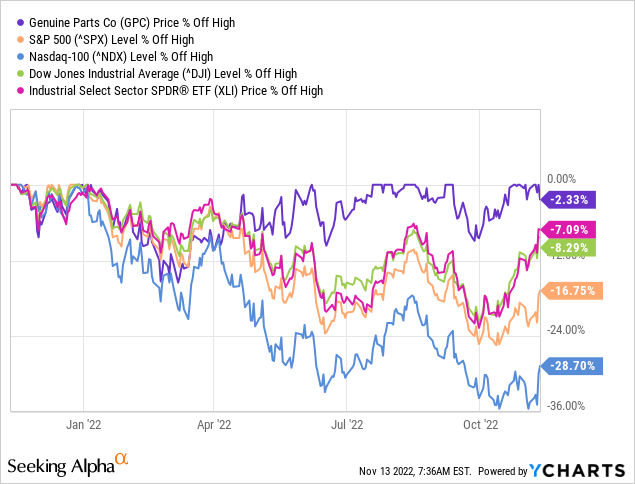
What’s quite interesting is that Genuine Parts’ stock has held up very well compared to the S&P 500 and other indices. While the S&P 500 is currently around 17% off its high for the year, Genuine Parts hit an all-time high just last week and has since pulled back 2%.
Dividend History
While not foolproof, a rising dividend is a pretty good sign of a strong business. A lengthy history of increasing dividends can only be achieved through a business model that can thwart competitors attempts to encroach on their turf.
Genuine Parts Dividend History (GPC Investor Relations)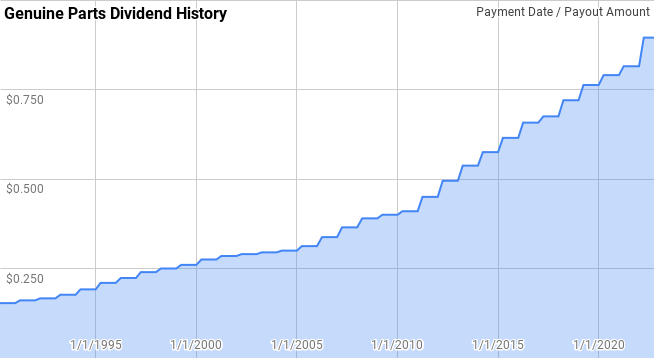
Genuine Parts’ dividend growth streak is one of the longest active streaks at 66 years long. That easily gives them the title of Dividend King and is only bested by 2 other companies that are tracked on the CCC list. That streak dates back to the mid-1950’s and covers just about every economic and geopolitical environment imaginable.
Since 1990, Genuine Parts’ year over year dividend growth has spanned from 1.7% to 10.0% with an average of 5.6% and a median of 5.9%.
There’s been 27 rolling 5-year periods over that time with annualized dividend growth coming in between 2.6% to 8.4% with an average of 5.7% and a median of 5.9%.
Over that same period there’s been 22 rolling 10-year periods with Genuine Parts’ annualized dividend growth ranging from 4.1% to 7.0% with an average of 5.6% and a median of 5.8%.
While Genuine Parts hasn’t been a barn burner in terms of dividend growth, they have shown a remarkable consistency with their dividend growth. In 1990 their total dividend payment was $0.6132 and FY 2022’s should come in at $3.58 which gives total growth of 483.8%. Meanwhile, inflation has run at a 128.0% rate over the same period.
The rolling 1-, 3-, 5-, and 10-year annualized dividend growth rates from Genuine Parts since 1990 can be found in the following table.
| Year | Annual Dividend | 1 Year | 3 Year | 5 Year | 10 Year |
| 1990 | $0.6132 | ||||
| 1991 | $0.6444 | 5.09% | |||
| 1992 | $0.6668 | 3.48% | |||
| 1993 | $0.7068 | 6.00% | 4.85% | ||
| 1994 | $0.7668 | 8.49% | 5.97% | ||
| 1995 | $0.8400 | 9.55% | 8.00% | 6.50% | |
| 1996 | $0.8932 | 6.33% | 8.11% | 6.75% | |
| 1997 | $0.9600 | 7.48% | 7.78% | 7.56% | |
| 1998 | $1.0000 | 4.17% | 5.98% | 7.19% | |
| 1999 | $1.0400 | 4.00% | 5.20% | 6.28% | |
| 2000 | $1.1000 | 5.77% | 4.64% | 5.54% | 6.02% |
| 2001 | $1.1400 | 3.64% | 4.46% | 5.00% | 5.87% |
| 2002 | $1.1600 | 1.75% | 3.71% | 3.86% | 5.69% |
| 2003 | $1.1800 | 1.72% | 2.37% | 3.37% | 5.26% |
| 2004 | $1.2000 | 1.69% | 1.72% | 2.90% | 4.58% |
| 2005 | $1.2500 | 4.17% | 2.52% | 2.59% | 4.06% |
| 2006 | $1.3500 | 8.00% | 4.59% | 3.44% | 4.22% |
| 2007 | $1.4600 | 8.15% | 6.76% | 4.71% | 4.28% |
| 2008 | $1.5600 | 6.85% | 7.66% | 5.74% | 4.55% |
| 2009 | $1.6000 | 2.56% | 5.83% | 5.92% | 4.40% |
| 2010 | $1.6400 | 2.50% | 3.95% | 5.58% | 4.07% |
| 2011 | $1.8000 | 9.76% | 4.89% | 5.92% | 4.67% |
| 2012 | $1.9800 | 10.00% | 7.36% | 6.28% | 5.49% |
| 2013 | $2.1500 | 8.59% | 9.45% | 6.63% | 6.18% |
| 2014 | $2.3000 | 6.98% | 8.51% | 7.53% | 6.72% |
| 2015 | $2.4600 | 6.96% | 7.50% | 8.45% | 7.00% |
| 2016 | $2.6300 | 6.91% | 6.95% | 7.88% | 6.90% |
| 2017 | $2.7000 | 2.66% | 5.49% | 6.40% | 6.34% |
| 2018 | $2.8800 | 6.67% | 5.39% | 6.02% | 6.32% |
| 2019 | $3.0500 | 5.90% | 5.06% | 5.81% | 6.66% |
| 2020 | $3.1600 | 3.61% | 5.38% | 5.14% | 6.78% |
| 2021 | $3.2600 | 3.16% | 4.22% | 4.39% | 6.12% |
Source: Author; Data Source: Genuine Parts Investor Relations
Naturally dividend growth investors should place a high importance on the safety of the dividend. If a dividend is going to grow a meager amount or be exposed to a cut during a downturn that’s a risk that isn’t worth taking. As such we can use the payout ratio to see how much buffer there is between the net income or free cash flows versus the dividend.
GPC Payout Ratios (GPC SEC filings)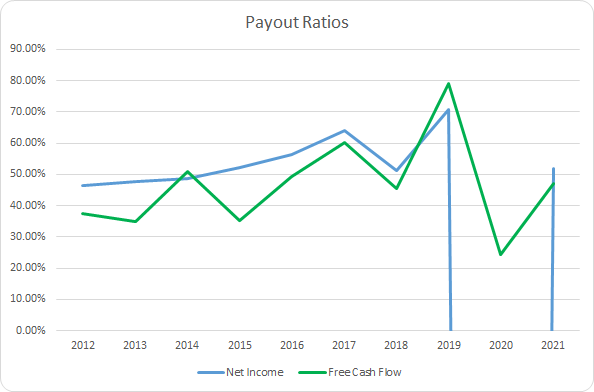
Genuine Parts’ payout ratio, both on net income and free cash flow, have been relatively stable outside of FY 2020 which saw a large goodwill impairment. The 10-year average net income payout ratio, excluding FY 2020, is 54.4% with the 5-year average coming to 59.5%. Similarly, the average free cash flow payout ratios are 48.8% and 57.9%, respectively.
Quantitative Quality
When scouting for potential investments there’s much more to the decision than just the dividend history. I seek out companies that can consistently grow while becoming more efficient in their operations. There’s a variety of financial metrics that I track in order to get a feel for the financial side of the business.
GPC Revenue Profits and Cash Flow (GPC SEC filings)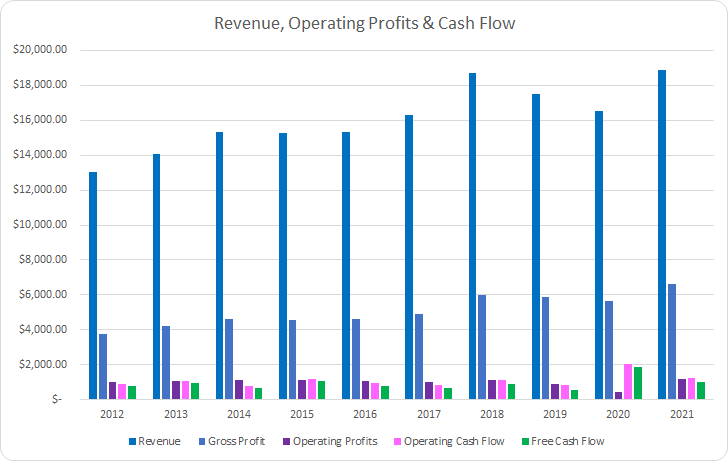
Genuine Parts has some cyclicality in their sales; although, the general trend is higher over time throughout the cycles. Between FY 2012 and FY 2021 revenues rose by 45.0% in total or 4.2% annualized. Gross profits fared better increasing by 75.6% or 6.5% annualized.
Operating profits improved by just 13.7% or 1.4% annualized; however, operating cash flow rose by 38.8% or 3.7% annualized. Free cash flow didn’t keep up with revenues increasing just 23.3% in total or 2.4% annualized.
Similar to your personal finances it’s not what you make it’s what you keep. I want to see margins that are generally stable and preferably rising over time.
GPC Margins (GPC SEC filings)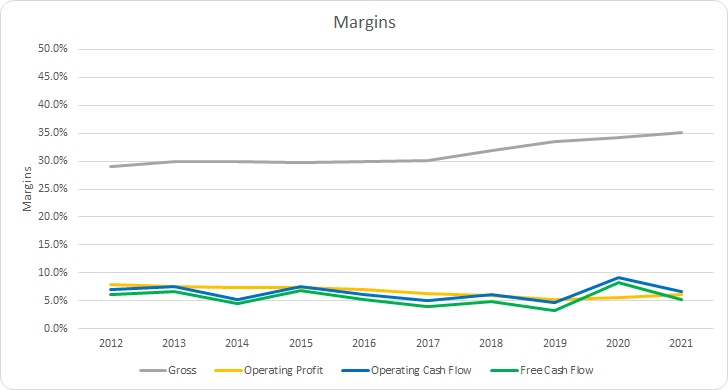
Genuine Parts’ gross margins have been rising although that hasn’t come with a subsequent rise in margins further down the financial statements. The 10-year average gross margin is 31.4% with the 5-year average at 33.0%. Free cash flow margins for the large part have been flat. The 10-year average free cash flow margin is 5.5% with the 5-year average coming to 5.1%.
Additionally, I want to see how efficient Genuine Parts is at generating free cash flow compare to their asset or capital base. I aim to invest in businesses that maintain strong or improving FCF ROIC’s and want to see at least a 10% level.
GPC Free Cash Flow Returns (GPC SEC filings)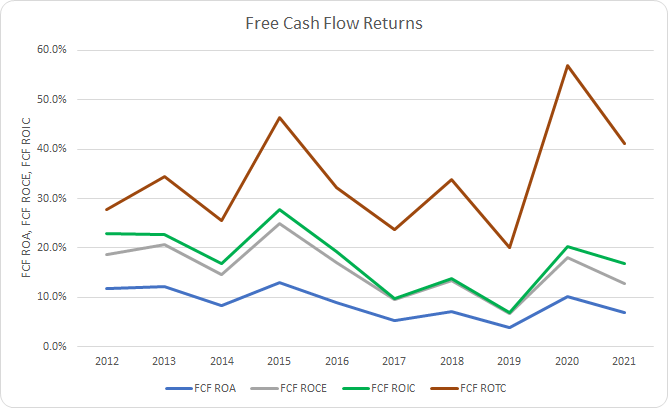
Genuine Parts has maintained pretty strong FCF ROA over that time. The 10-year average FCF ROA is 8.7% although the 5-year average is just 6.7%. Similarly, the FCF ROIC has been falling, but is still generally strong. The 10-year average FCF ROIC for Genuine Parts is 17.7% with the 5-year average at 13.5%.
To understand how Genuine Parts uses its free cash flow I calculate three variations of the metric defined below:
- Free Cash Flow, FCF: Operating cash flow less capital expenditures
- Free Cash Flow after Dividend, FCFaD: FCF less total cash dividend payments
- Free Cash Flow after Dividend and Buybacks, FCFaDB: FCFaD less net cash used on share repurchases
GPC Free Cash Flows (GPC SEC filings)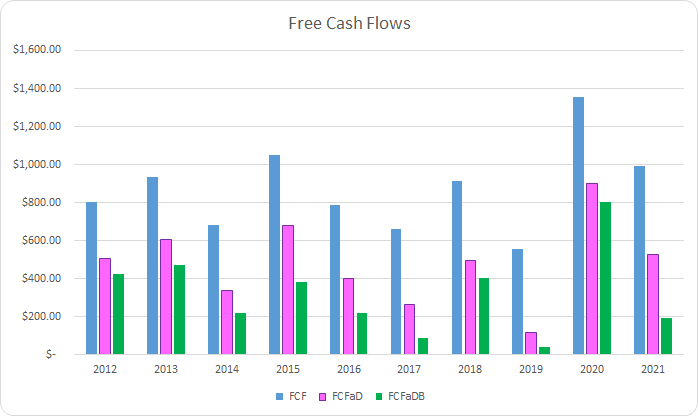
Between FY 2012 and FY 2021 Genuine Parts generated a cumulative total of $8.73 B in FCF. With that FCF they sent out $3.90 B to shareholders in dividend payments which brings the cumulative FCFaD for that period to $4.83 B. Additionally, Genuine Parts has used a net total of $1.59 B repurchasing shares which puts the total FCFaDB for that time at $3.24 B.
Genuine Parts has favored dividends versus share repurchases as a means to return cash to shareholders. With the $3.90 B in dividends and $1.59 B in net share repurchases they have spent roughly $2.45 on dividends for every net $1.00 repurchasing shares.
Buybacks can be a great way for managements to return cash to shareholders under three conditions. One, the cash for the repurchases is truly excess cash that the business is generating through normal operations. Two, repurchased shares are trading at intrinsic value or cheaper such that remaining shareholders are reaping the benefits. And three, that the cash used on buybacks is not going towards solely offsetting stock based compensation.
GPC Shares Outstanding (GPC SEC filings)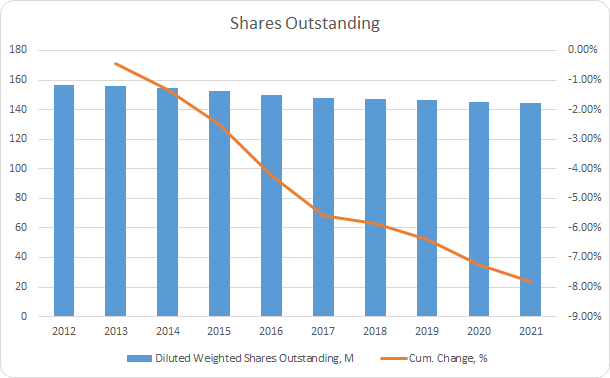
The $1.59 B in net cash used on share repurchases reduced Genuine Parts’ shares outstanding by 7.8% in total. That works out to around a 0.9% annualized decline.
With a buy and hold position, the balance sheet becomes something watching more closely. Overleveraged businesses could potentially see their cash flows and profits shrink should the rising interest rates we’ve seen thus far in 2022 continue moving forward. Excessive leverage also introduces risk to my equity stake.
GPC Debt to Capitalization (GPC SEC filings)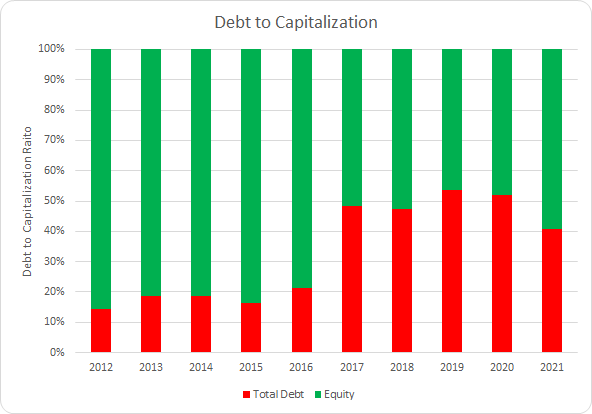
Due to Genuine Parts’ acquisition heavy growth strategy they have incurred a sizable increase in debt especially in FY 2017 with the Alliance Automotive Group. Their debt-to-capitalization ratio has averaged 33% for the last 10 years; however, for the last 5 years the average has risen to 48%.
GPC Debt Ratios (GPC SEC filings)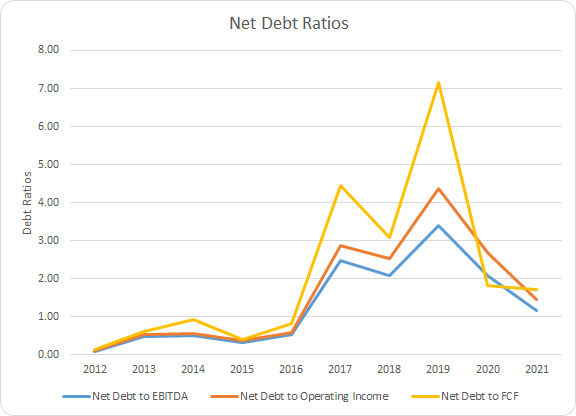
With the increase in debt Genuine Parts has seen a rise in their net debt ratios. The 10-year average net debt-to-EBITDA, net debt-to-operating income, and net debt-to-FCF ratios are 1.3x, 1.6x, and 2.1x, respectively. Accordingly, the 5-year averages are 2.2x, 2.8x, and 3.4x. Genuine Parts’ debt levels appear manageable at current levels.
How Did We Get Here?
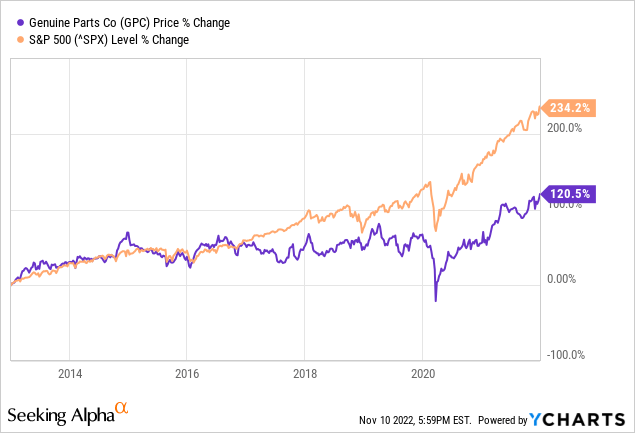
Between December 31, 2012 and December 31, 2021, Genuine Parts’ share price increased from $63.58 to $140.20 which is good for a 120.5% increase. That works out to an 8.2% annualized growth rate which combined with the 3.1% initial dividend yield works out to an impressive 11.3% CAGR during that time. However, that’s underperformed the S&P 500 which rose by 234.2% or 14.3%, exclusive of dividends.
All returns are not created equally. Over the short term valuation changes can play a big role in determining the returns you earn as an investor. However, as your timeframe expands the business results should lead the pack. Below I’ll break down Genuine Parts’ returns into 3 components which should roughly approximate the return attribution.
- Business Returns: measured as annualized growth rate in revenues plus annualized change in net profit margin
- Capital Allocation Returns: measured as initial dividend yield plus annualized change in shares outstanding
- Sentiment Change: measured as annualized change between beginning and ending P/E multiple
Genuine Parts’ revenue growth accounted for a 4.1% contribution to the CAGR. However, their net profit margin declined from 5.0% to 4.8% which represents a -0.5% contribution. That brings the total business return contribution to +3.6%.
Genuine Parts’ share count fell by 7.8% due to share repurchases which acted as a +0.9% boost to returns. Added to the 3.1% initial dividend yield and the capital allocation return attribution comes to +4.0%.
Genuine Parts’ multiple rose from 15.3x to 22.5x. That works out to a 46.6% total increase or a +3.8% contribution due to sentiment change.
| Annualized Returns | % of Returns | |
| Business Returns | 3.6% | 32% |
| Capital Allocation Returns | 4.0% | 35% |
| Sentiment Change | 3.8% | 33% |
| Total Annualized Returns | 11.3% |
Source: Author
Despite lagging behind the S&P 500, Genuine Parts still delivered pretty solid returns for investors. Combined the business returns and capital allocation returns accounted for a 7.6% CAGR and around 67% of the returns investors generated over that time. However, the remaining 3.8% or 33% of the CAGR was earned due to sentiment change.
GPC Return Breakdown (Author)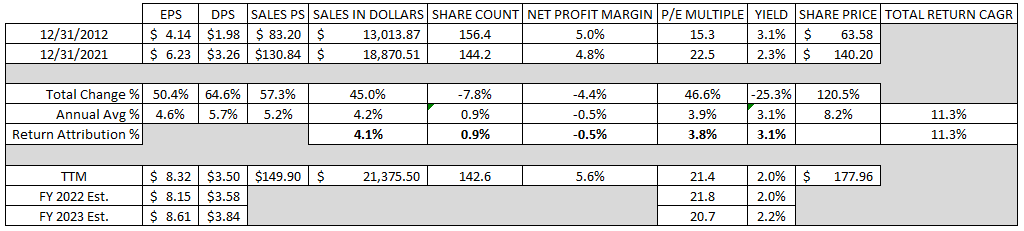
Moving forward I wouldn’t want to bank on an additional 3.8% annualized increase from a rising multiple and would expect the around the current level to be the upper end of the range. As such returns will likely track closer to underlying business performance and potentially lag behind should investors’ appetite wane.
A return to around a 15x multiple would be a 3.5% annual drag. To make up for that you need to be fairly confident that Genuine Parts will be able to grow revenues, increase margins, reduce shares much faster in order to make up for multiple compression.
Valuation
Identifying a good business is only part of the puzzle with investing. The other part is identifying an attractive level to purchase a stake in the business. I utilize three valuation methods to home in on a fair value range.
Dividend yield theory is a simple valuation methodology that centers around reversion to the mean. It’s best suited for businesses that have a lengthy history of paying and growing their dividends over time and that are relatively stable. I’ll use the 5-year average forward dividend yield as a proxy for fair value.
Genuine Parts Dividend Yield Theory (GPC Investor Relations and Google Finance)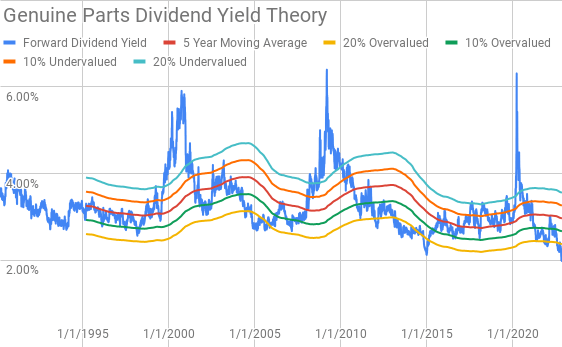
Since around 1990 Genuine Parts has largely traded such that it offered a forward dividend yield between 2.8% and 3.2%. Currently, Genuine Parts offers a 2.01% forward yield compared to the 5-year average of 2.96%.
A reverse discounted cash flow analysis can help you decipher what the business needs to generate in terms of cash flow in order to justify the current valuation. In other words you can determine what kind of growth and margins you have to believe the business can sustain depending on the returns that you target.
I use a simplified DCF model based on revenue growth, an initial free cash flow margin of 5.3% that improves to 6.5% during the forecast period. The terminal growth rate is estimated at 2.5%. For the discount rate I’ve used an estimated after-tax cost of debt of 2.0% with a cost of equity of 10% and 8%. That gives a discount rate of 9.3% for the 10% cost of equity and a 7.4% rate for the 8% cost of equity.
For the 10% return target, Genuine Parts needs to grow revenues 8.1% annually through the forecast period in order to generate the cash flows that would support the current market valuation. With the 8% equity return target the required revenue growth drops to 3.1% annually during the forecast period.
The MARR analysis requires you to estimate the future earnings and dividends that a business is capable of achieving. You then apply a reasonable expected terminal multiple to those future earnings to determine an expected range for the share price in the future. If the expected return is greater than your hurdle rate for investment then you can proceed with investing in the business.
Analysts expect Genuine Parts to have $8.15 in EPS for FY 2022 and $8.61 for FY 2023. They also expect Genuine Parts to grow EPS 4.6% annually over the following 5 years. I then assumed that EPS growth would slow to 3.5% annually for the following 5 years. Dividends are assumed to target a 45% payout ratio.
Across the last decade, Genuine Parts has typically been valued by investors between around 15x and 25x TTM EPS. For the MARR analysis I’ll examine terminal multiples spanning across that range.
The following table shows the internal rates of return that an investment in Genuine Parts could produce if the assumptions laid out above prove out. Returns assume dividends are paid and increased along the timeline that Genuine Parts has usually followed and that dividends are taken in cash. Shares are assumed to be purchased at $177.96, Friday’s closing price.
| IRR | ||
| P/E Level | 5 Year | 10 Year |
| 25 | 9.6% | 7.6% |
| 22.5 | 7.5% | 6.6% |
| 20 | 5.2% | 5.5% |
| 17.5 | 2.7% | 4.3% |
| 15 | -0.2% | 2.9% |
Source: Author
Additionally, I use the MARR analysis to work backwards to determine the maximum price I could pay for shares today in order to generate the returns that I desire from my investments. My base hurdle rate is a 10% IRR and for Genuine Parts I’ll also look at 12% and 8% return targets.
| Purchase Price Targets | ||||||
| 10% Return Target | 12% Return Target | 8% Return Target | ||||
| P/E Level | 5 Year | 10 Year | 5 Year | 10 Year | 5 Year | 10 Year |
| 25 | $176 | $147 | $161 | $125 | $192 | $173 |
| 22.5 | $160 | $135 | $147 | $115 | $175 | $159 |
| 20 | $144 | $123 | $132 | $105 | $157 | $145 |
| 17.5 | $128 | $111 | $118 | $96 | $140 | $131 |
| 15 | $112 | $100 | $103 | $86 | $123 | $117 |
Source: Author
Conclusion
Genuine Parts is an impressive business with a rich history of serving both the automotive and industrial parts distribution. Despite an acquisition heavy approach, Genuine Parts’ growth has been rather modest at just 4.2% annual sales growth between FY 2012 and FY 2021. Although FY 2022 has seen robust growth recently with 6 consecutive quarters of double digit sales growth.
Acting as a distributor, Genuine Parts’ margins are relatively thin; however; they are very efficient with using their assets and high inventory turn. That allows them to carry strong FCF ROIC’s despite the low margins.
Dividend yield theory suggests a fair value range between $110 and $134. At a current share price of $177.96 shares are significantly overvalued.
Additionally, the reverse DCF model appears to require rather optimistic assumptions in order for Genuine Parts to deliver 10% returns. For that kind of required return Genuine Parts needs to average 8.1% annual sales growth through 2031 to generate the cash flows that would support the current market valuation.
Genuine Parts has been on a run lately with 3Q FY 2022 representing 6 consecutive quarters of double digit sales growth. While that’s not completely unreasonable, it’s not an assumption I’d be willing to bank on as a base case for the next decade.
Share repurchases could be a potential lever that Genuine Parts could pull. Buybacks only amounted to around and 8% reduction over the prior decade, but with their strong cash generation they can easily commit additional capital to buybacks. Using the 3-year average FCFaD Genuine Parts and current market capitalization Genuine Parts could repurchase around 2.0% of shares annually despite what appears to be a valuation on the higher side.
Meanwhile the MARR analysis implies that returns are more likely to be disappointing if shares are purchased around current levels. Based on a 10% IRR 5 years out and a fair P/E between 17.5x and 22.5x, Genuine Parts’ fair value range is between $128 and $160. With a 12% IRR target the fair value range drops to $118 to $147; although, with an 8% IRR target it rises to $140 to $175.
Genuine Parts benefitted greatly from the auto manufacturers inability to source chips for new vehicles. That’s been a boon for Genuine parts as there’s been more demand for service and maintenance of older vehicles as new vehicles were not available.
The debt that Genuine Parts carries is extremely affordable. As of Q3 it carried an average interest rate of just 2.34%. Additionally, given their investment grade rating and cash generation, Genuine Parts has some flexibility with the maturities that will be due over the next few years. That’s a great position to be in as they can either pay off their debt as it matures thanks to strong cash generation or they can roll-over their debt depending on where interest rates settle when the bill comes due.
GPC Debt Maturity Schedule (GPC Debt Maturity Schedule Q3 FY 2022 Earnings Presentation)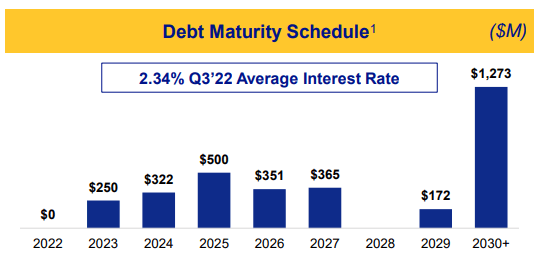
Scroll back up and take another look at the dividend yield chart. There’s three obvious times where it was probably ugly and you would have hated to buy, but in hindsight those were excellent entry points for investors. Those opportunities all coincide with large economic turmoil and uncertainty.
Historically, the yield history has been a good predictor of under- or over-valuation. Genuine Parts has only offered a handful of times where the yield is outside of the 20% overvalued band where it currently sits.
With Genuine Parts focus on the North American market they would be a beneficiary of the on-/re-shoring plans as the last few years threw many companies into a whirlwind with trying to management and move parts, products, and finished goods to their end markets.
Recent business results support the rise in share price and investor enthusiasm especially for a typically staid business such as Genuine Parts. While the business is strong and should continue to thrive over time, I see little to get excited about regarding the stock at this time given the current macro picture of rising interest rates, inflation, potential recession, and slowing manufacturing activity.
While a very complicated picture, how you believe the next few years plays out plays a big role in Genuine Parts’ attractiveness as an investment.
Admittedly, I have no idea what the future will hold for the broader economy although I am very interested in Genuine Parts the business. In my opinion Genuine Parts appears expensive and the risk/reward is skewed toward risk. At some point in the future I would expect Genuine Parts to find its way into my portfolio.
Be the first to comment