

chonticha wat
After the latest September consumer price index data release on Oct. 13, nearby COMEX gold futures fell by around $30 per ounce only to recover and erase the losses on the same day. However, on Friday, Oct. 14, the realization of rising interest rates and a strong US dollar sent the precious yellow metal lower to the $1,650 level. Gold settled at $1,648.90 per ounce, down $28.10 at the end of last week.
On Sept. 28, the day bonds reached new lows, and the dollar index rose to its highest level since 2002 at 114.475; December gold futures fell to $1,622.20 per ounce, a new low for 2022 and the lowest price since April 2020. The trend in gold is lower as of Oct. 17, but each selloff has been a buying opportunity for over two decades.
When gold decides it has reached bottom, gold mining shares are likely to outperform the precious metal on a percentage basis. For those looking to time the market, the MicroSectors Gold Miners 3X Leveraged ETN product (NYSEARCA:GDXU) offers a short-term alternative that could turbocharge results. However, a long position in the GDXU is a contrarian approach given the current path of least resistance of the leading precious metal.
Gold price corrections have been buying opportunities since 1999
Gold’s bull market began in August 1999 when the price reached a bottom at $252.50 per ounce. Gold fell to its low as the UK auctioned off half of its gold reserves.
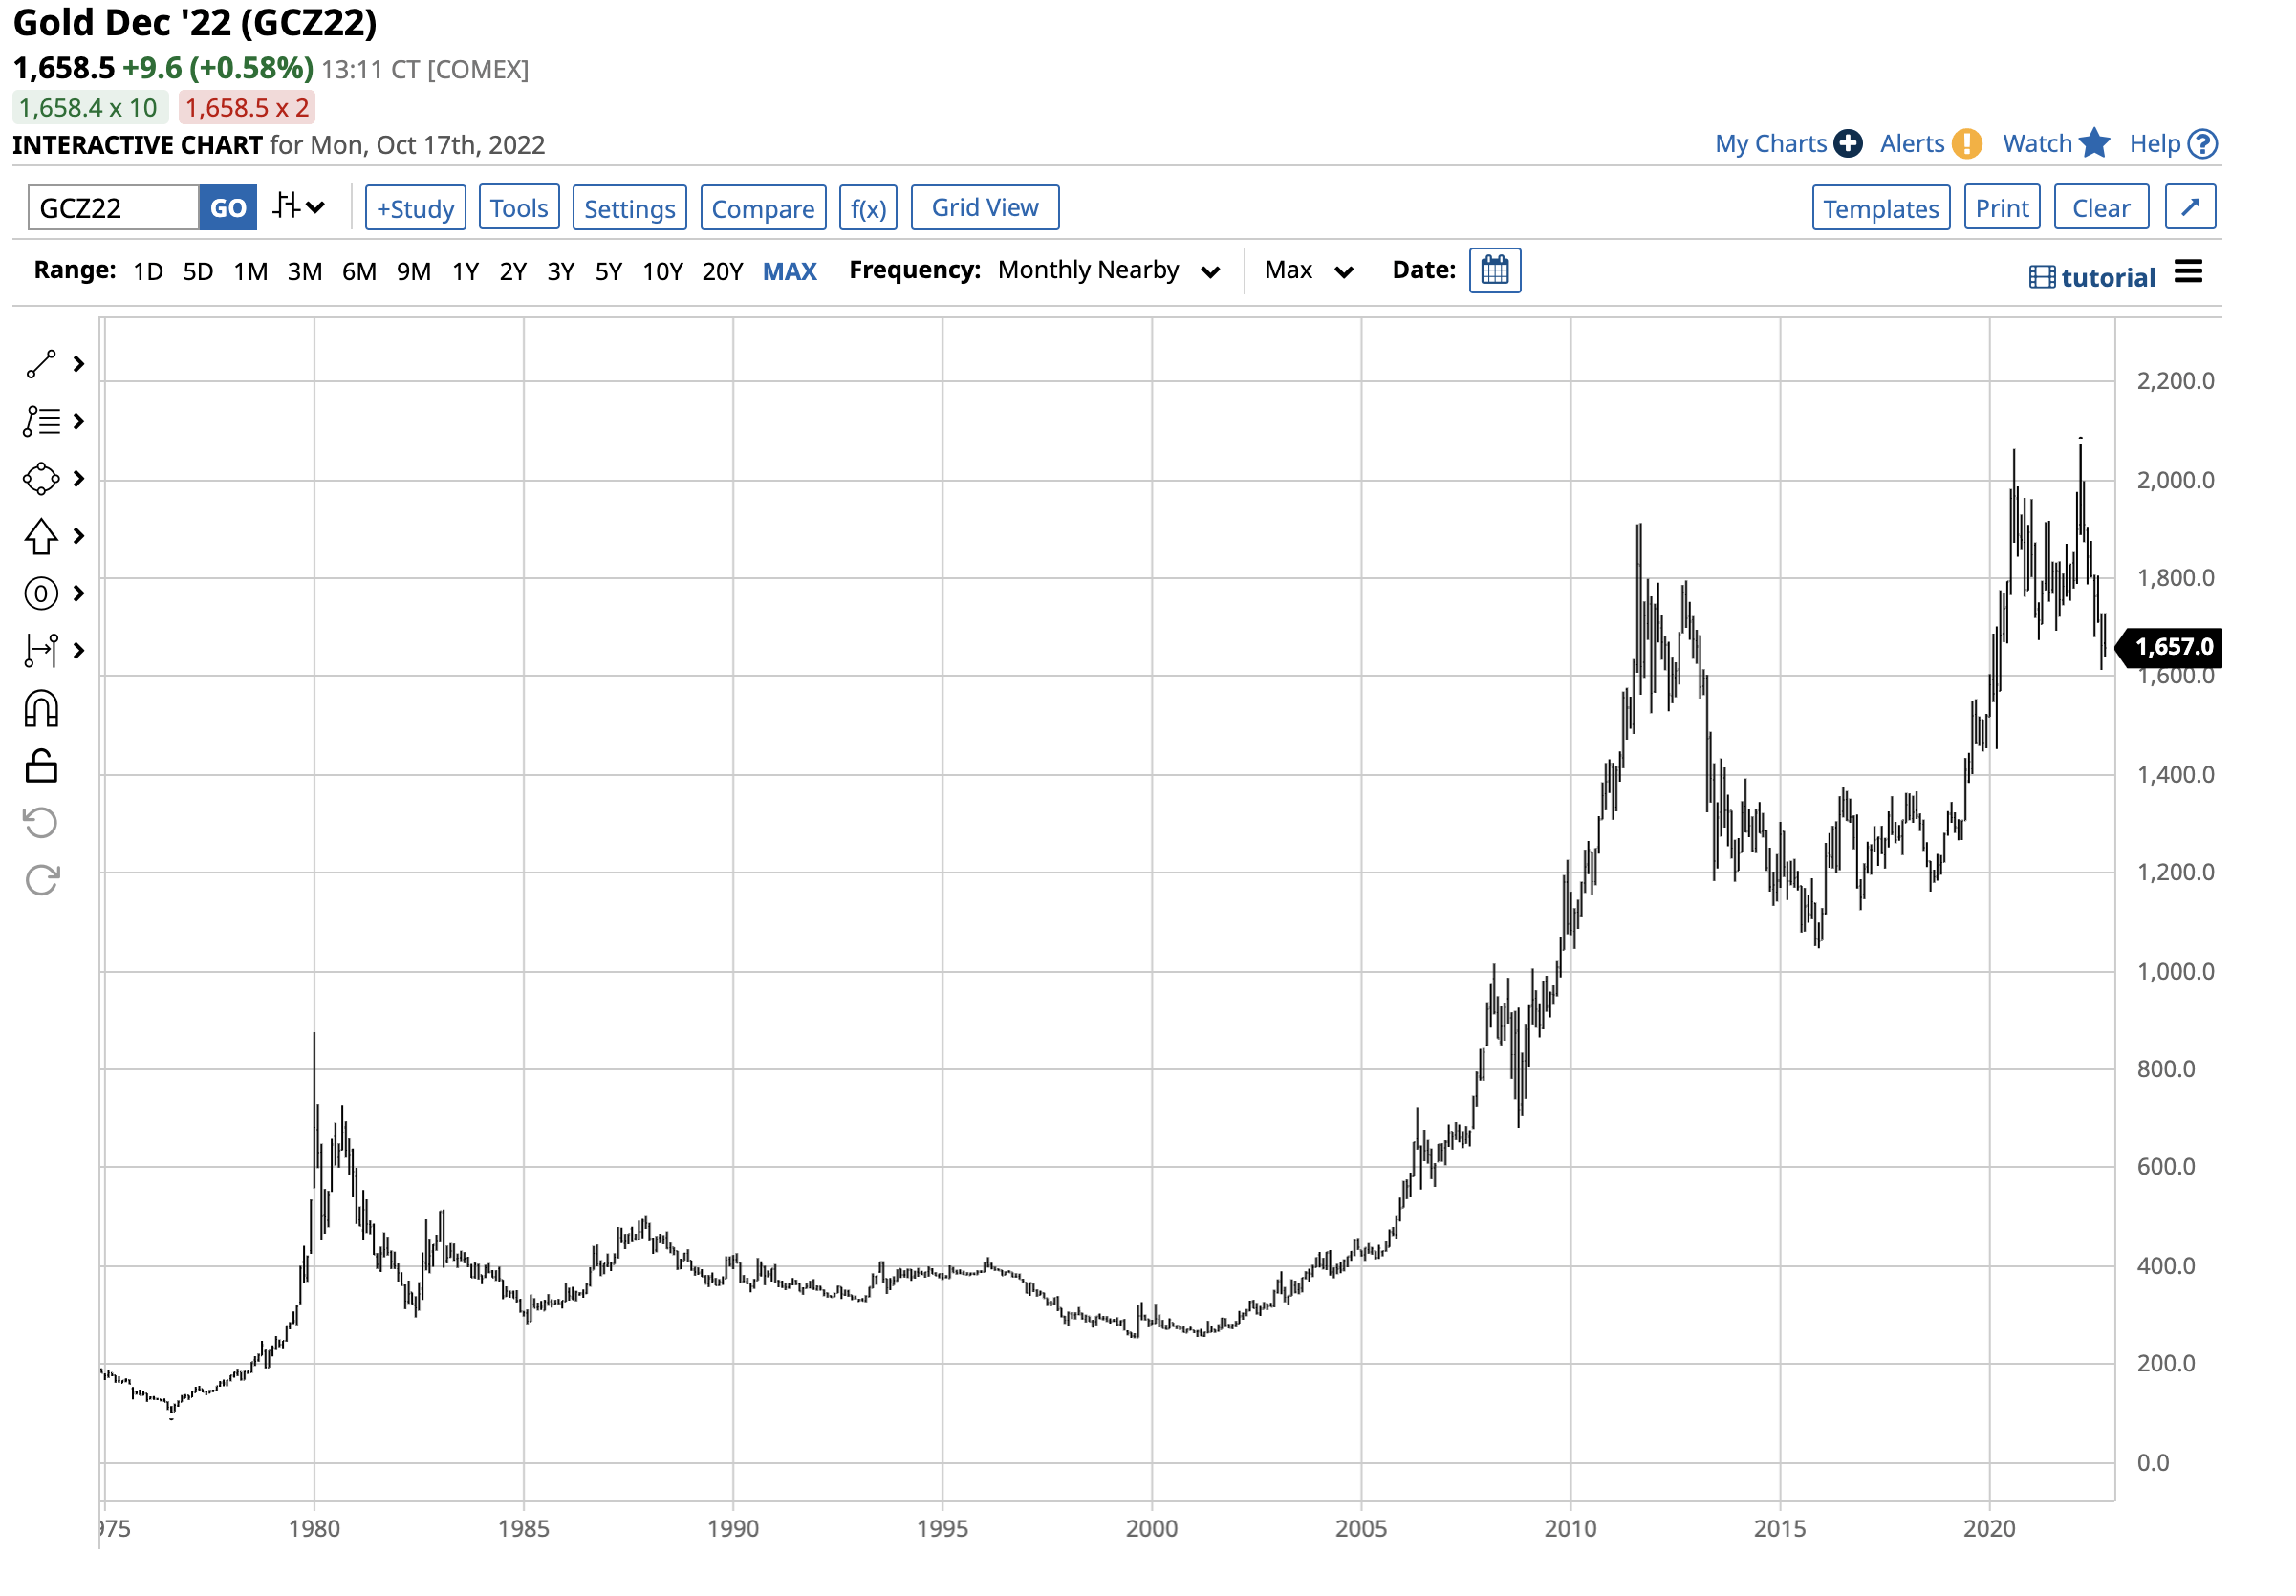
Long-term COMEX Gold Futures Chart (Barchart)
The chart highlights that gold has made higher lows and higher highs over the past 23 years, reaching a record high of $2,072 in March 2022. While gold corrected and was at the $1658.50 level on Oct. 17, the bullish trend that has lasted over two decades remained intact. Every significant decline this century has been a buying opportunity in gold, which was over six and one-half times the price at the 1999 low.
Gold has not done badly, considering…
While gold declined 20% from the March 2022 high, the price action remains impressive because of increasing interest rates and the rally in the US dollar.
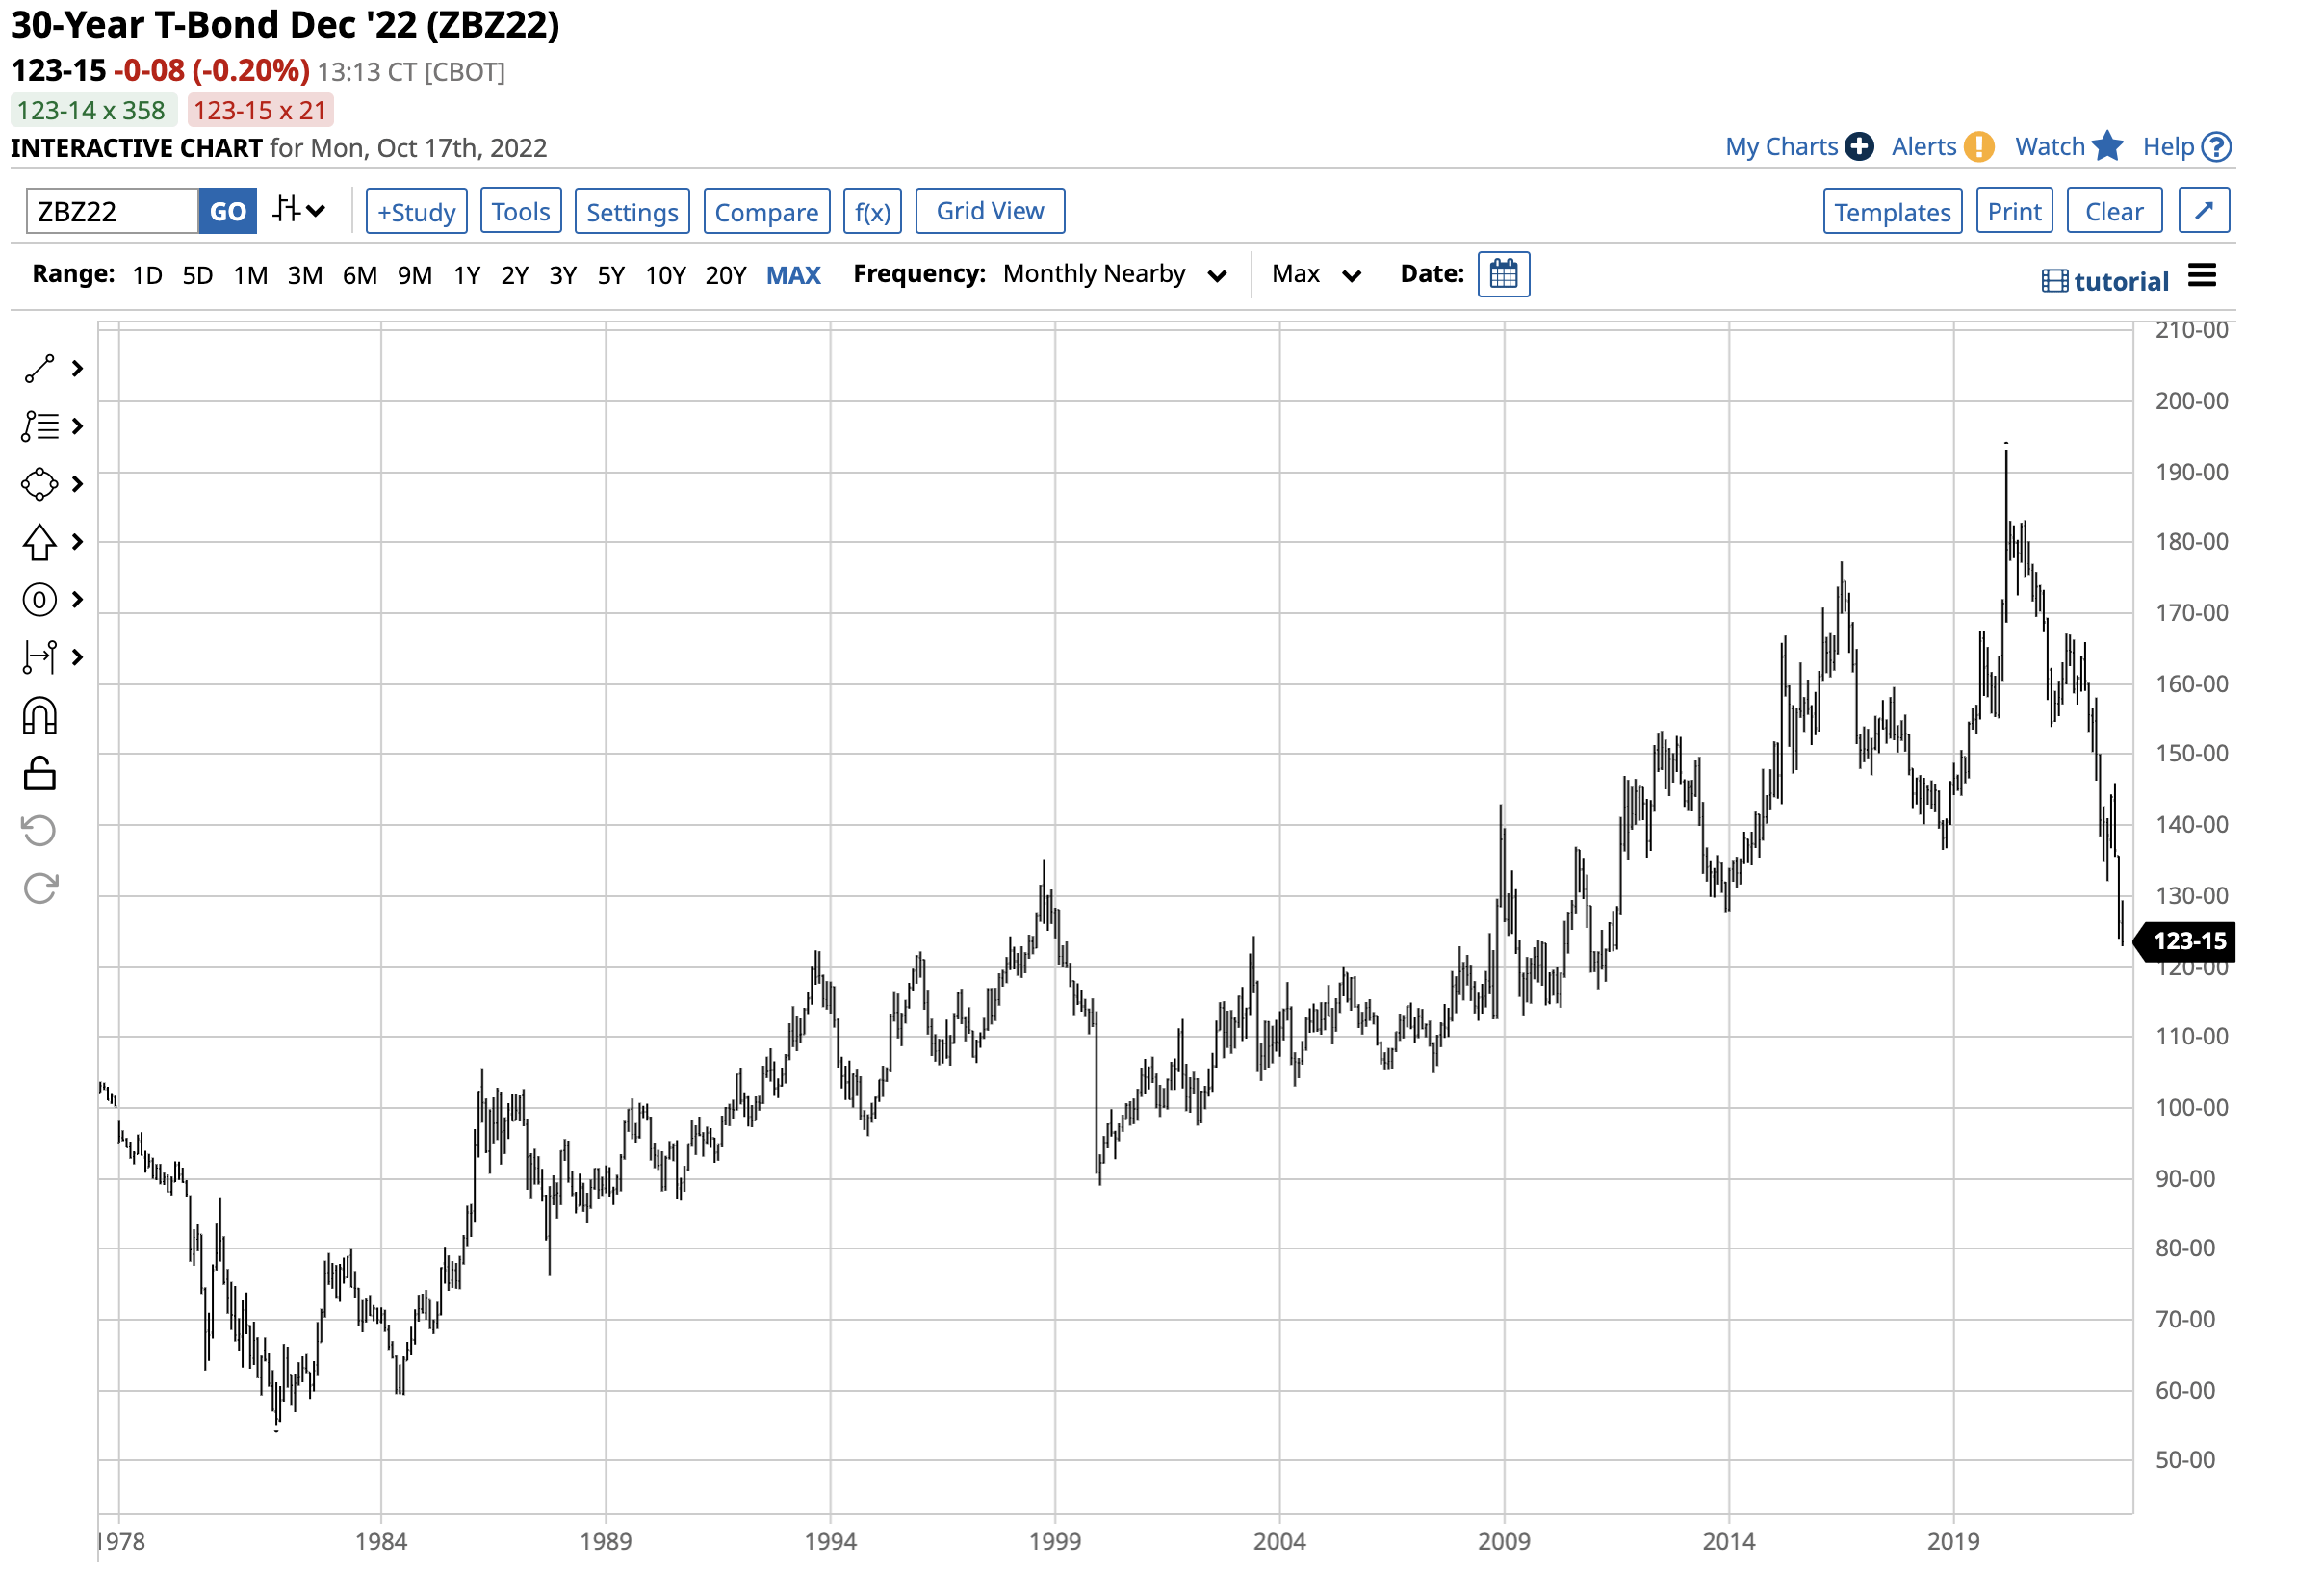
US Thirty-Year Government Bond Futures Chart (Barchart)
The chart shows the bearish price action in the US 30-Year Treasury bond futures that dropped to a recent low of 122-28, the lowest level since July 2011. Rising interest rates increase the cost of carrying commodity long positions and inventories. Moreover, higher rates make fixed-income investments more attractive at the expense of gold. The last time the long bond futures were this low, COMEX gold futures were at a high of $1,634.90 per ounce in July 2011.
The US dollar is the pricing mechanism for many commodities, including gold, as the dollar is the world’s reserve currency.
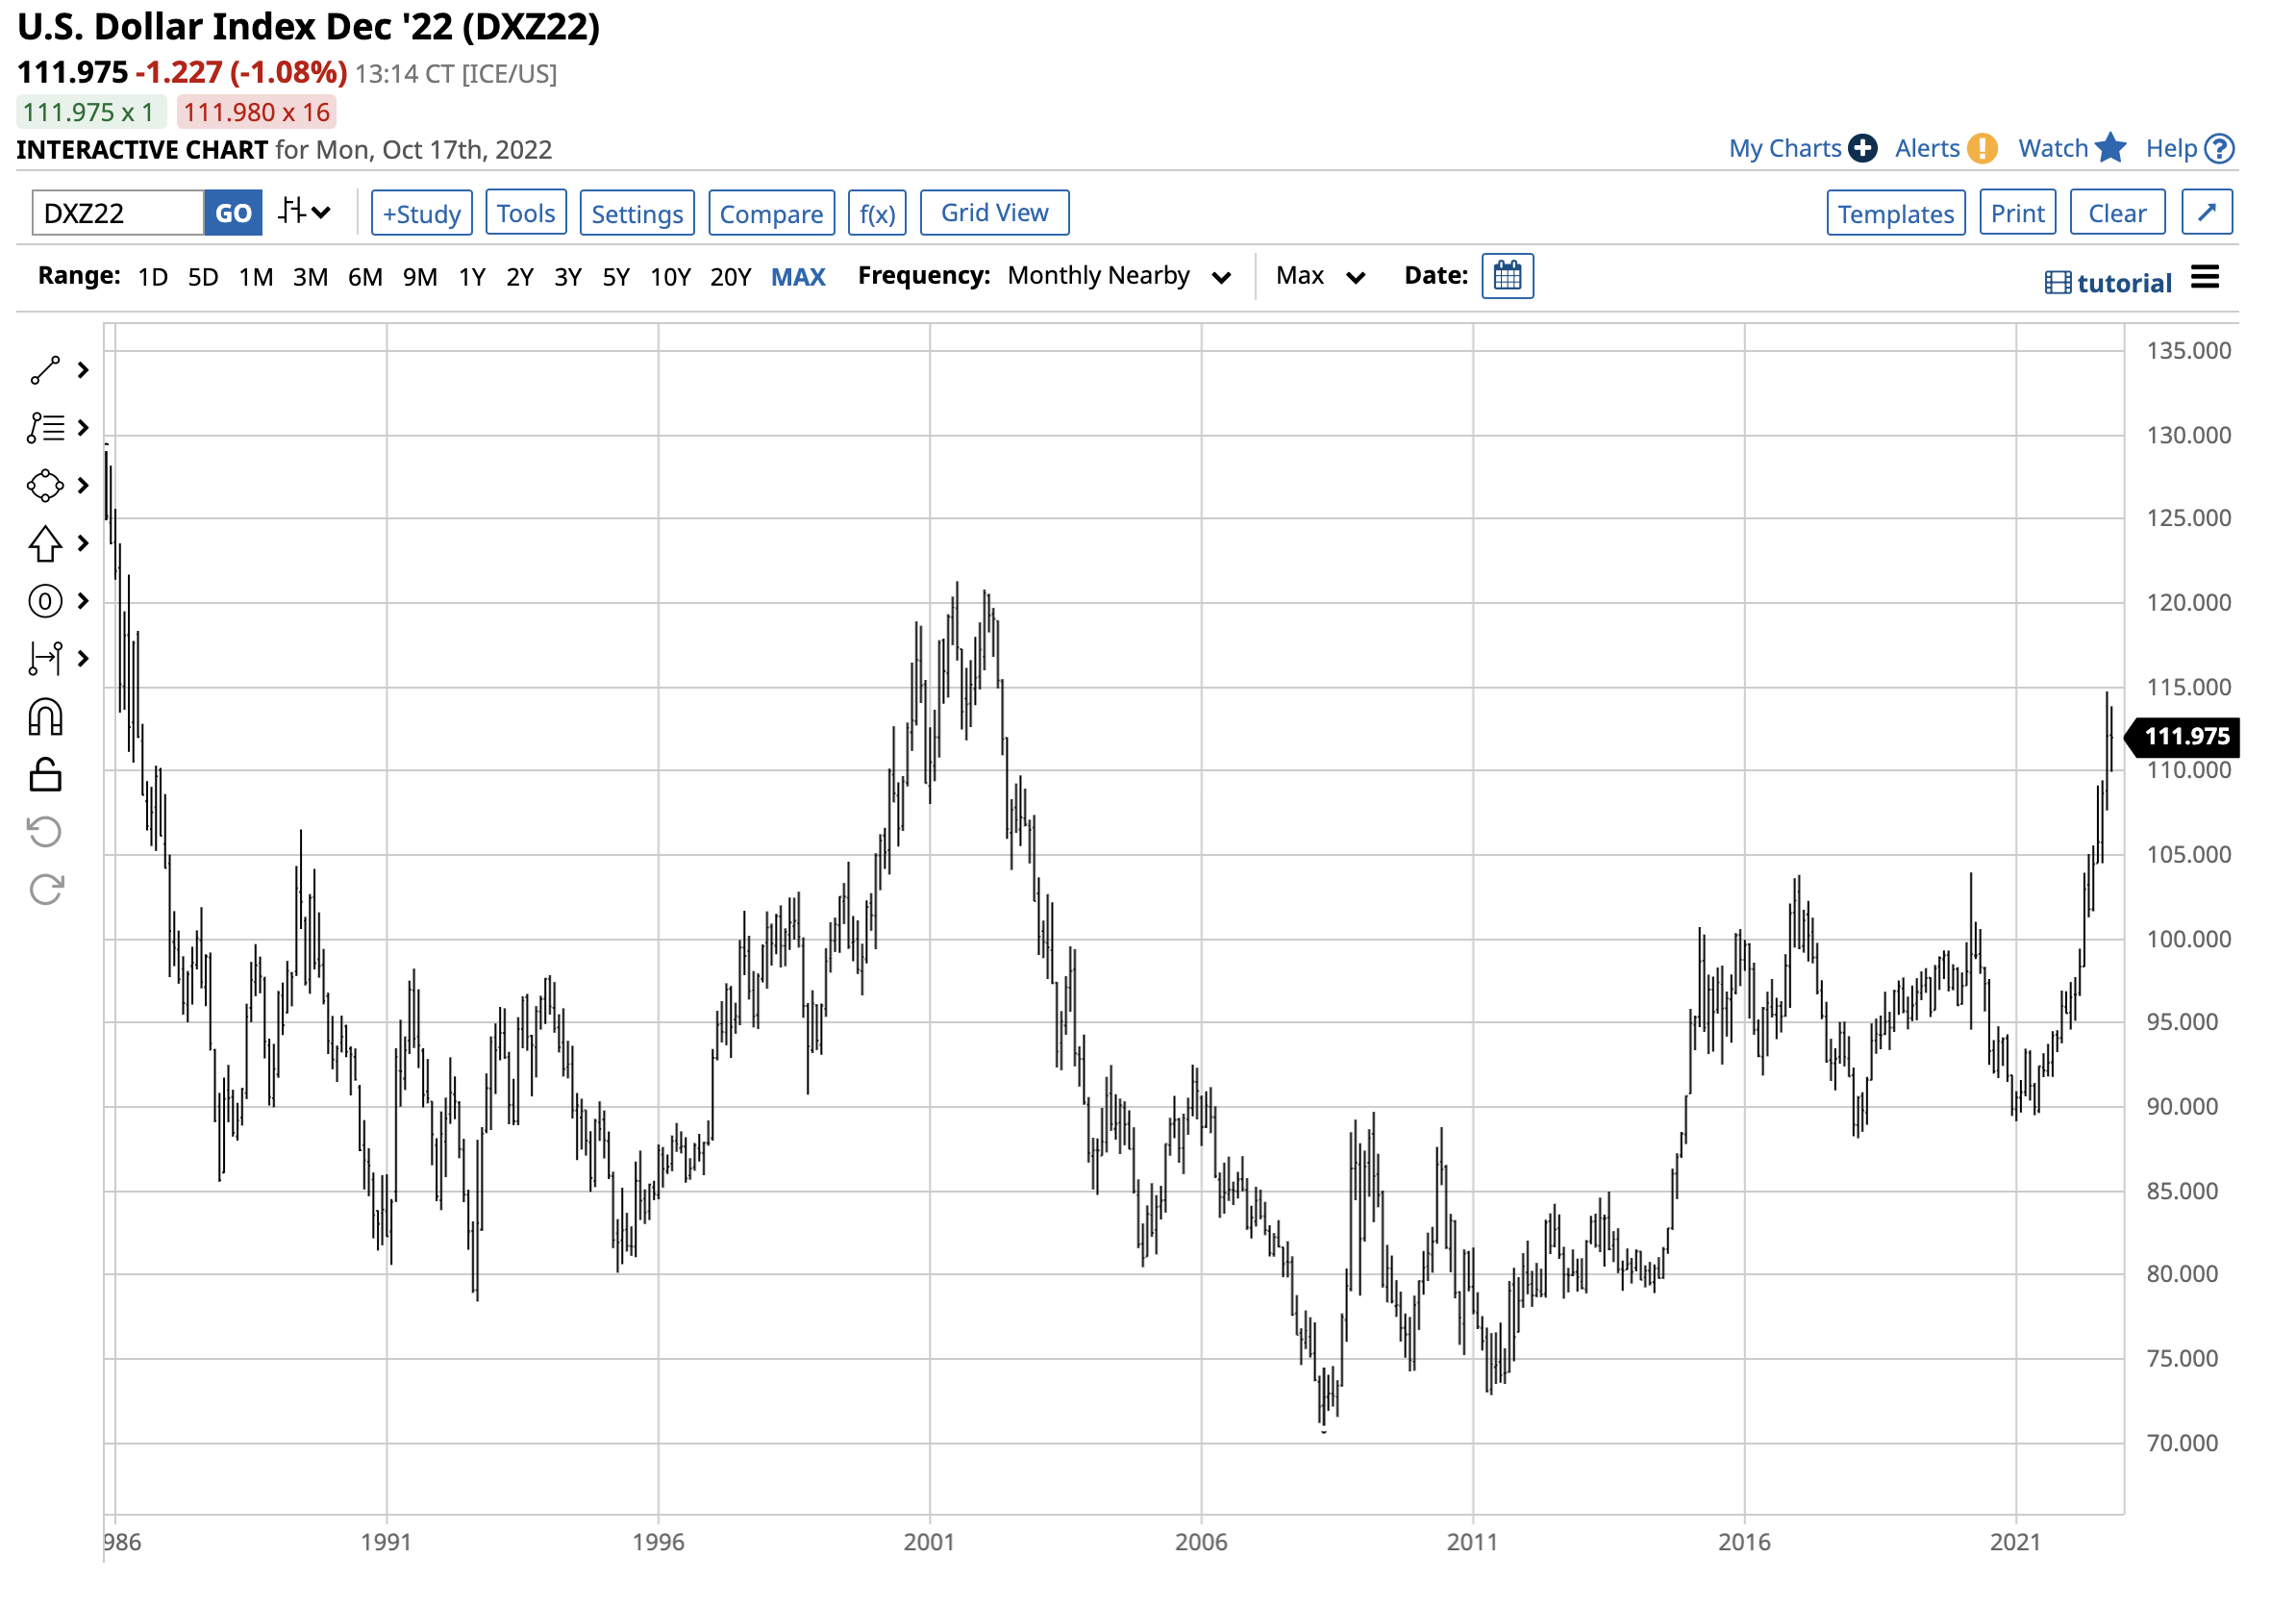
US Dollar Index Futures Chart (Barchart)
The chart shows the rise in the dollar index futures to 114.475 in September 2022, the highest level in two decades. In 2002, gold’s peak was just over $350 per ounce. A rising dollar tends to weigh on gold as it causes the precious metal to rise in other currencies. The bottom line is that rising interest rates and a strong US dollar may have weighed on gold’s price over the past months, but the yellow metal remains in an overall long-term bullish trend, and at the $1,658.50 level, its performance is impressive.
The global bifurcation of nuclear powers favors gold
For decades, the US dollar has been the world’s reserve currency and the means of exchange held by central banks and used for cross-border payments. The first sign that could be changing came in early February 2022 when Chinese President Xi and Russian President Putin shook hands on a “no-limits” alliance. Later that month, Russian troops moved into Ukraine, starting the first major war in Europe since WW II.
The Russian invasion could accelerate Chinese plans to force a reunification with Taiwan. Meanwhile, the geopolitical landscape has bifurcated with China, Russia, Iran, North Korea, and their allies on one side and the US, Europe, Japan, Canada, Australia, and their allies on the other. The separation between the world’s powers could threaten the US dollar’s dominance in the global financial system.
Gold has been a means of exchange for thousands of years, long before the British pound, US dollar, euro, or any other fiat currency took over as a reserve currency. Moreover, central banks, monetary authorities, and governments continue to hold gold as an integral part of their reserves. Over the past years, Russia and China have increased their gold holdings, and central banks have been net buyers of the precious metal.
The Russian invasion of Ukraine led to sanctions, and Russia retaliated. Following its attack, Russia declared that 5,000 roubles were exchangeable for one gram of gold.
The US dollar index has rallied to its highest level since 2002 at 114.475 in September 2022. Even though the US dollar moved higher against other reserve currencies, the Russian currency has rallied against the US dollar since the March 2022 low.
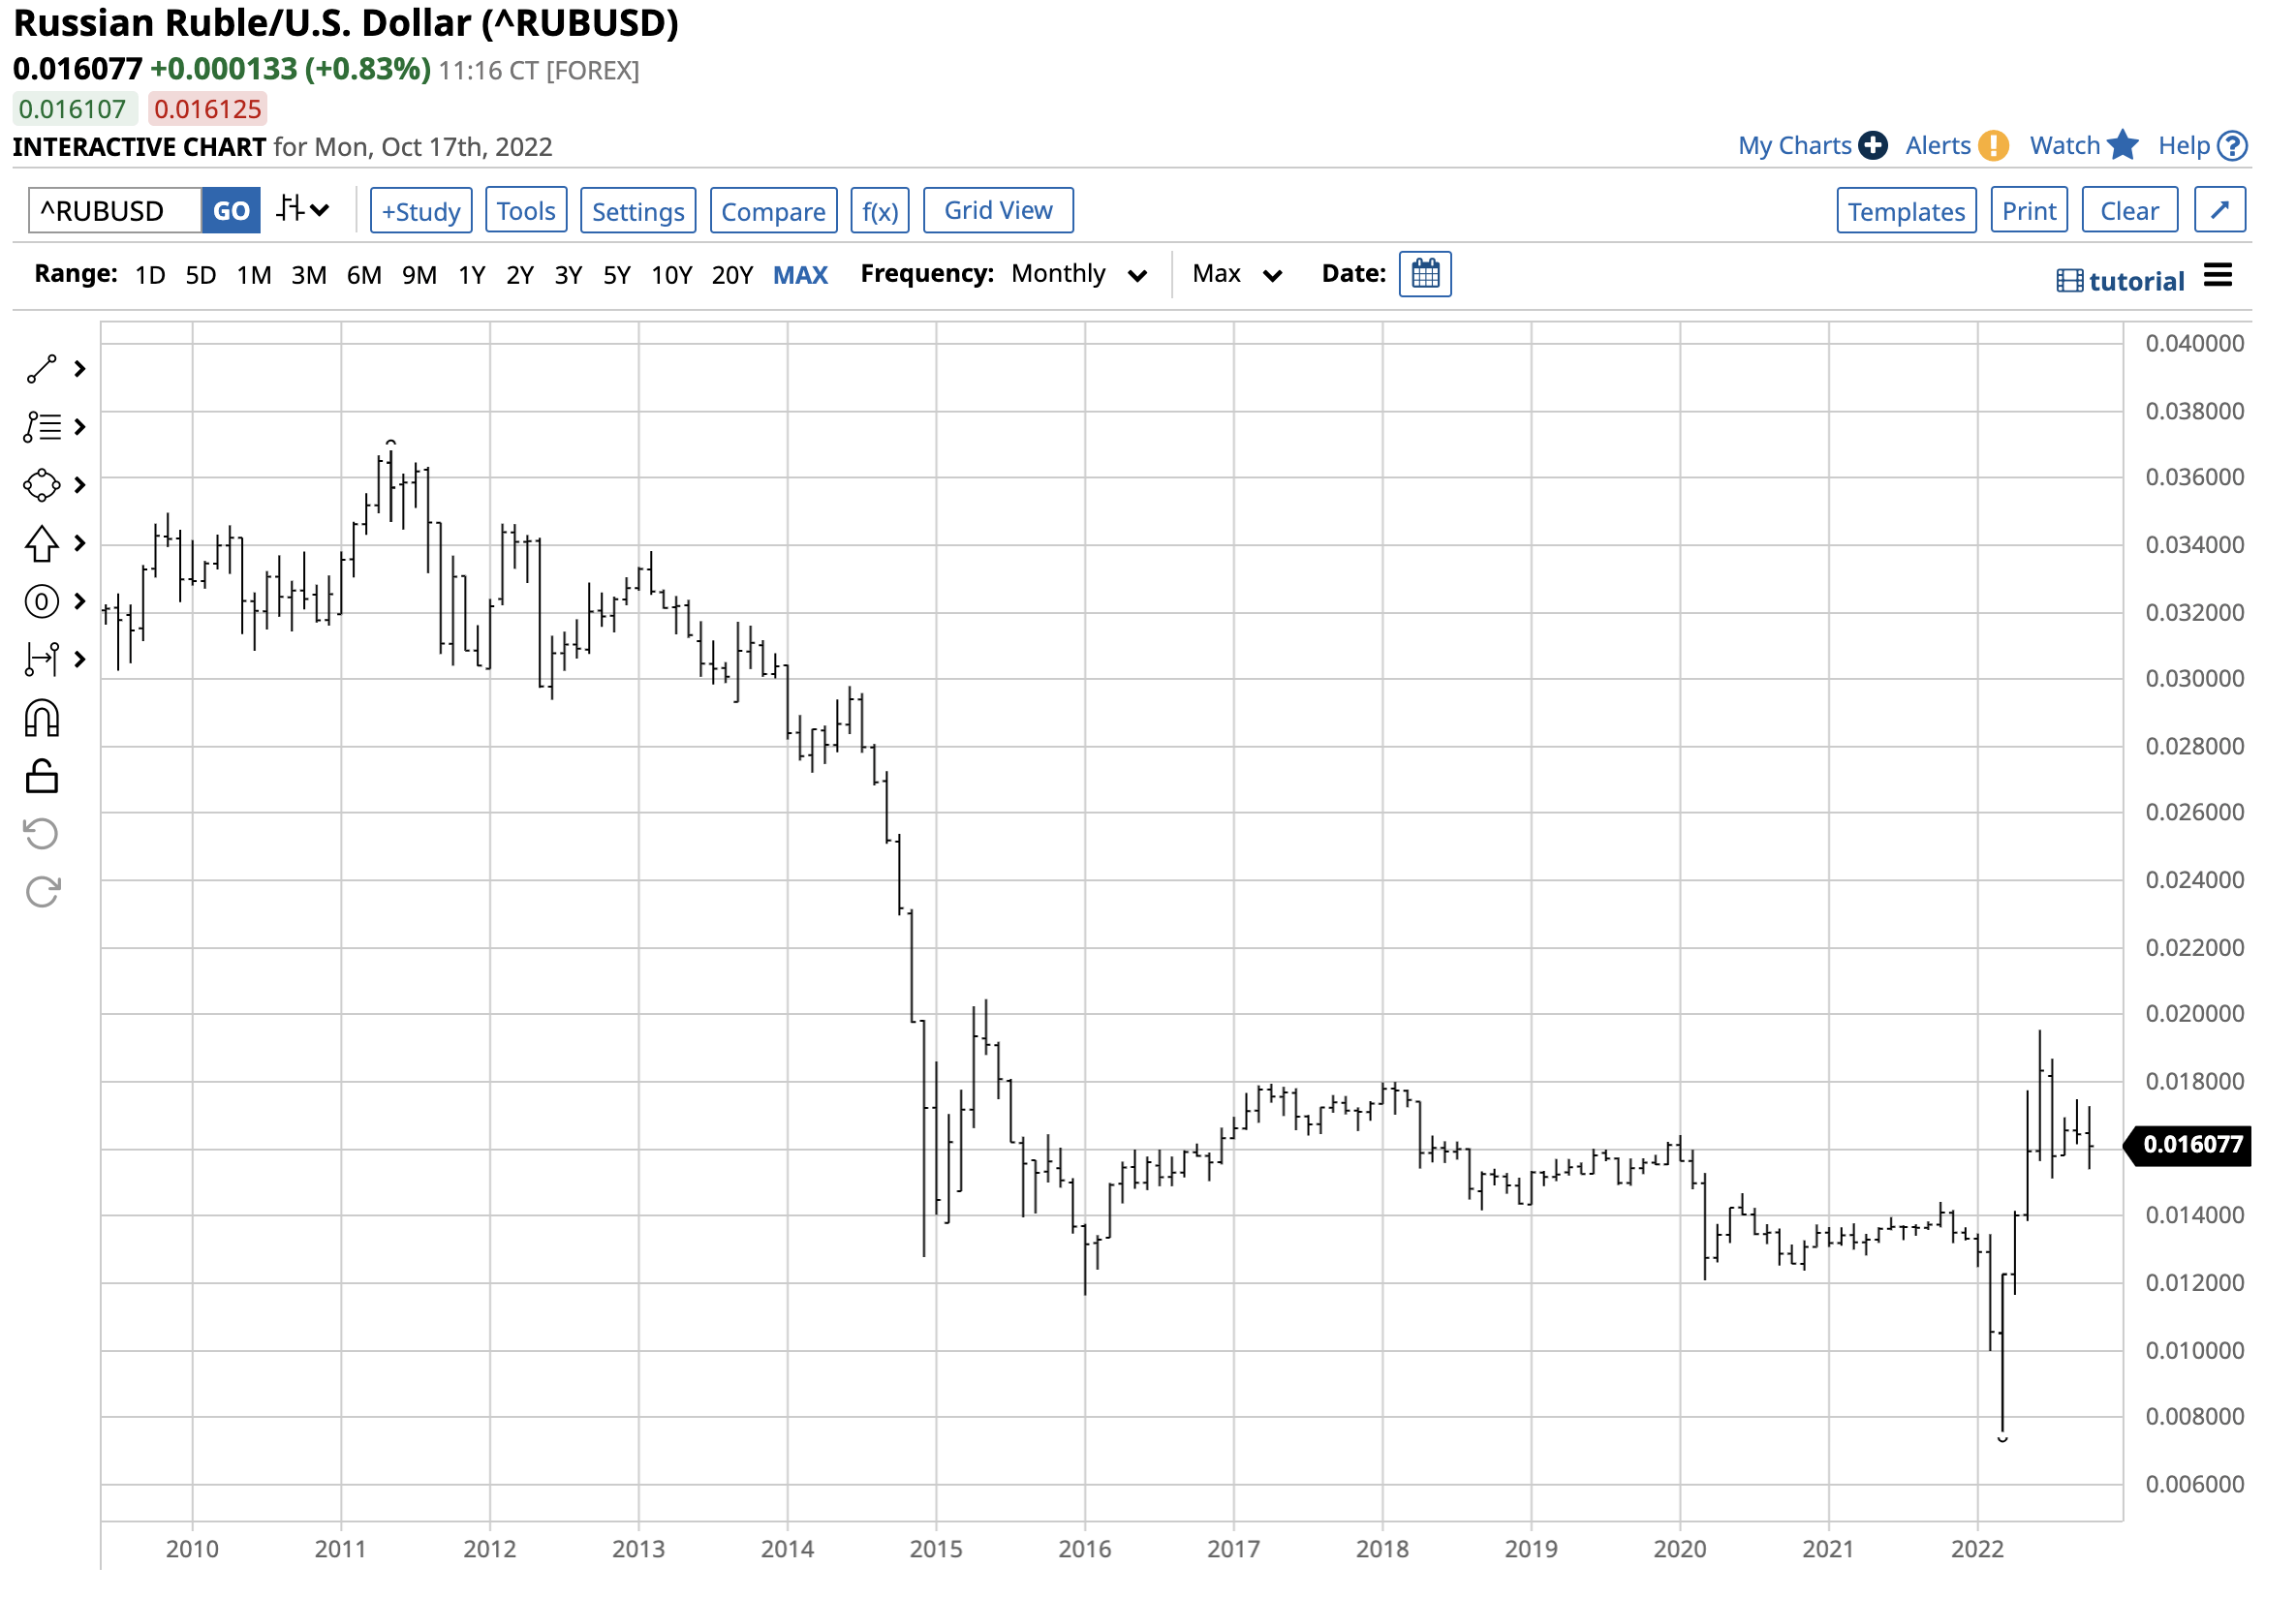
Chart of the Russian Ruble versus the US Dollar Currency Relationship (Barchart)
The chart highlights the ruble’s appreciation to the highest level since May 2015 in June 2022. At over the $0.16 level against the US dollar on Oct. 17, the ruble was closer to the high than the March 2022 low. Russia’s declaration backing its currency with gold likely pushed the currency higher. If China follows and backs the yuan with the precious yellow metal, it could ignite a significant rally that will take gold to a new record high over the coming months and years.
While the long-term trend in the gold futures market remains bullish, the geopolitical landscape supports the precious metal in the current environment.
Gold mining stocks tend to outperform on the upside
Gold miners invest substantial capital in mines and offer leverage to the gold price. When gold rallies, gold mining shares tend to beat the metal’s price on a percentage basis, and during corrections, they often underperform. The VanEck Gold Miners ETF product holds shares of the leading publicly traded gold mining companies, including:
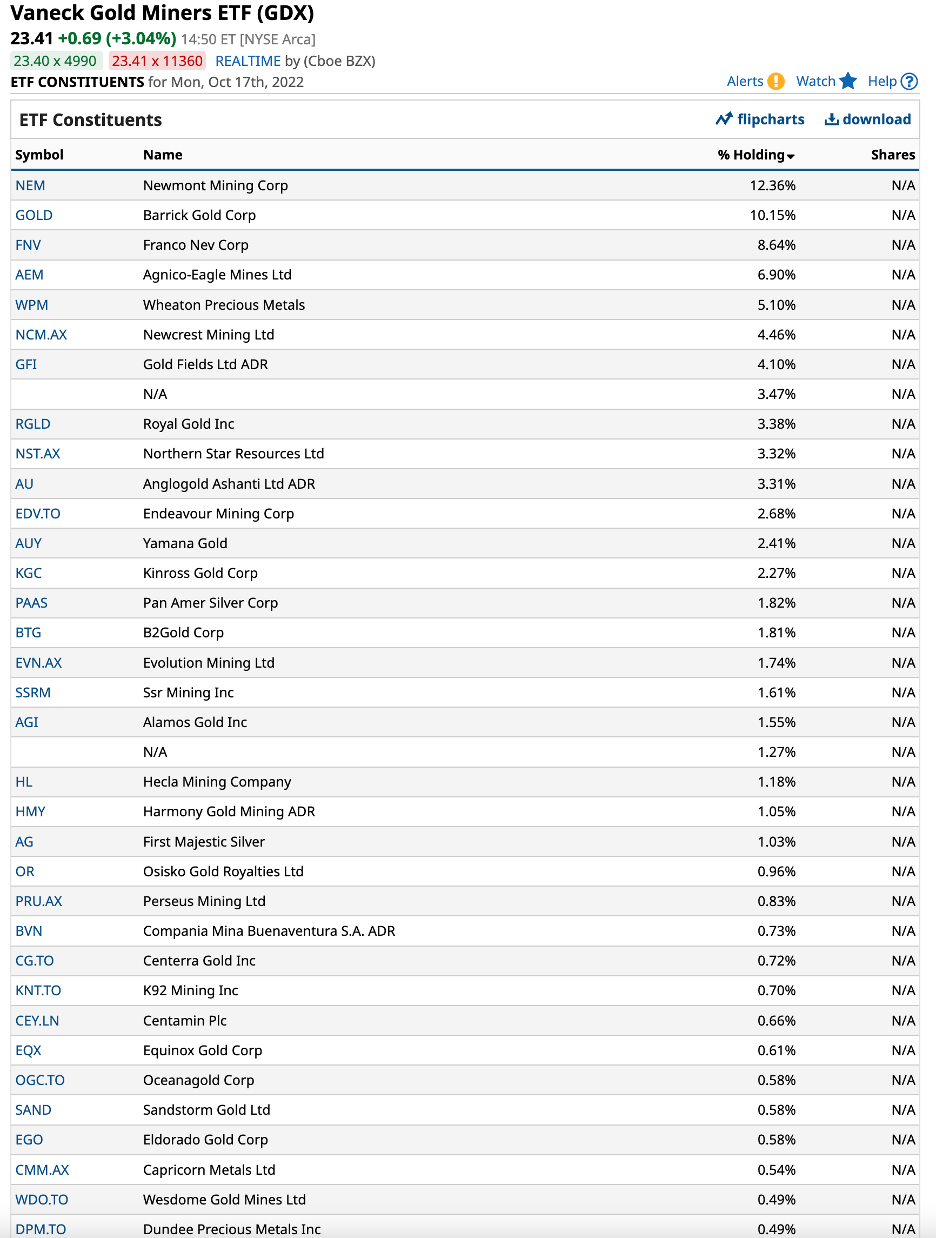
Top Holdings of the GDX ETF Product (Barchart)
GDX is a highly liquid ETF. At $23.41 per share on Oct. 17, GDX had more than $9 billion in assets under management and trades an average of over 28 million shares daily. GDX charges a 0.51% management fee.
The last significant rally in gold took the price of the nearby futures contract from $1,673.70 in March 2021 to $2,072 in March 2022, a 23.8% rise. Over around the same period, the GDX ETF outperformed gold and rose from $30.64 to $41.60 per share or 38.8%.
Gold futures recently fell to $1,613 in September 2022, a 22.2% decline from the record high. The GDX ETF fell 48.3% to the $21.52 per share level from the April 2022 $41.60 peak. GDX is an unleveraged ETF product that offers leveraged performance to the precious metal’s price.
The MicroSectors Gold Miners 3X Leveraged ETN product provides even more leverage, but it’s not for the faint of heart as leverage comes with a steep price tag for GDXU.
GDXU – Timing is critical
GDXU is a short-term trading tool. At $2.60 per share on Oct. 17, it had $15 million in assets under management. While the assets are small, the leveraged ETN trades an average of nearly 5.7 million shares daily. GDXU charges a 0.95% management fee.
From a short-term perspective, December gold futures moved from $1622.20 on Sept. 28 to a high of $1,738.70 on Oct. 4, a 7.2% rise.
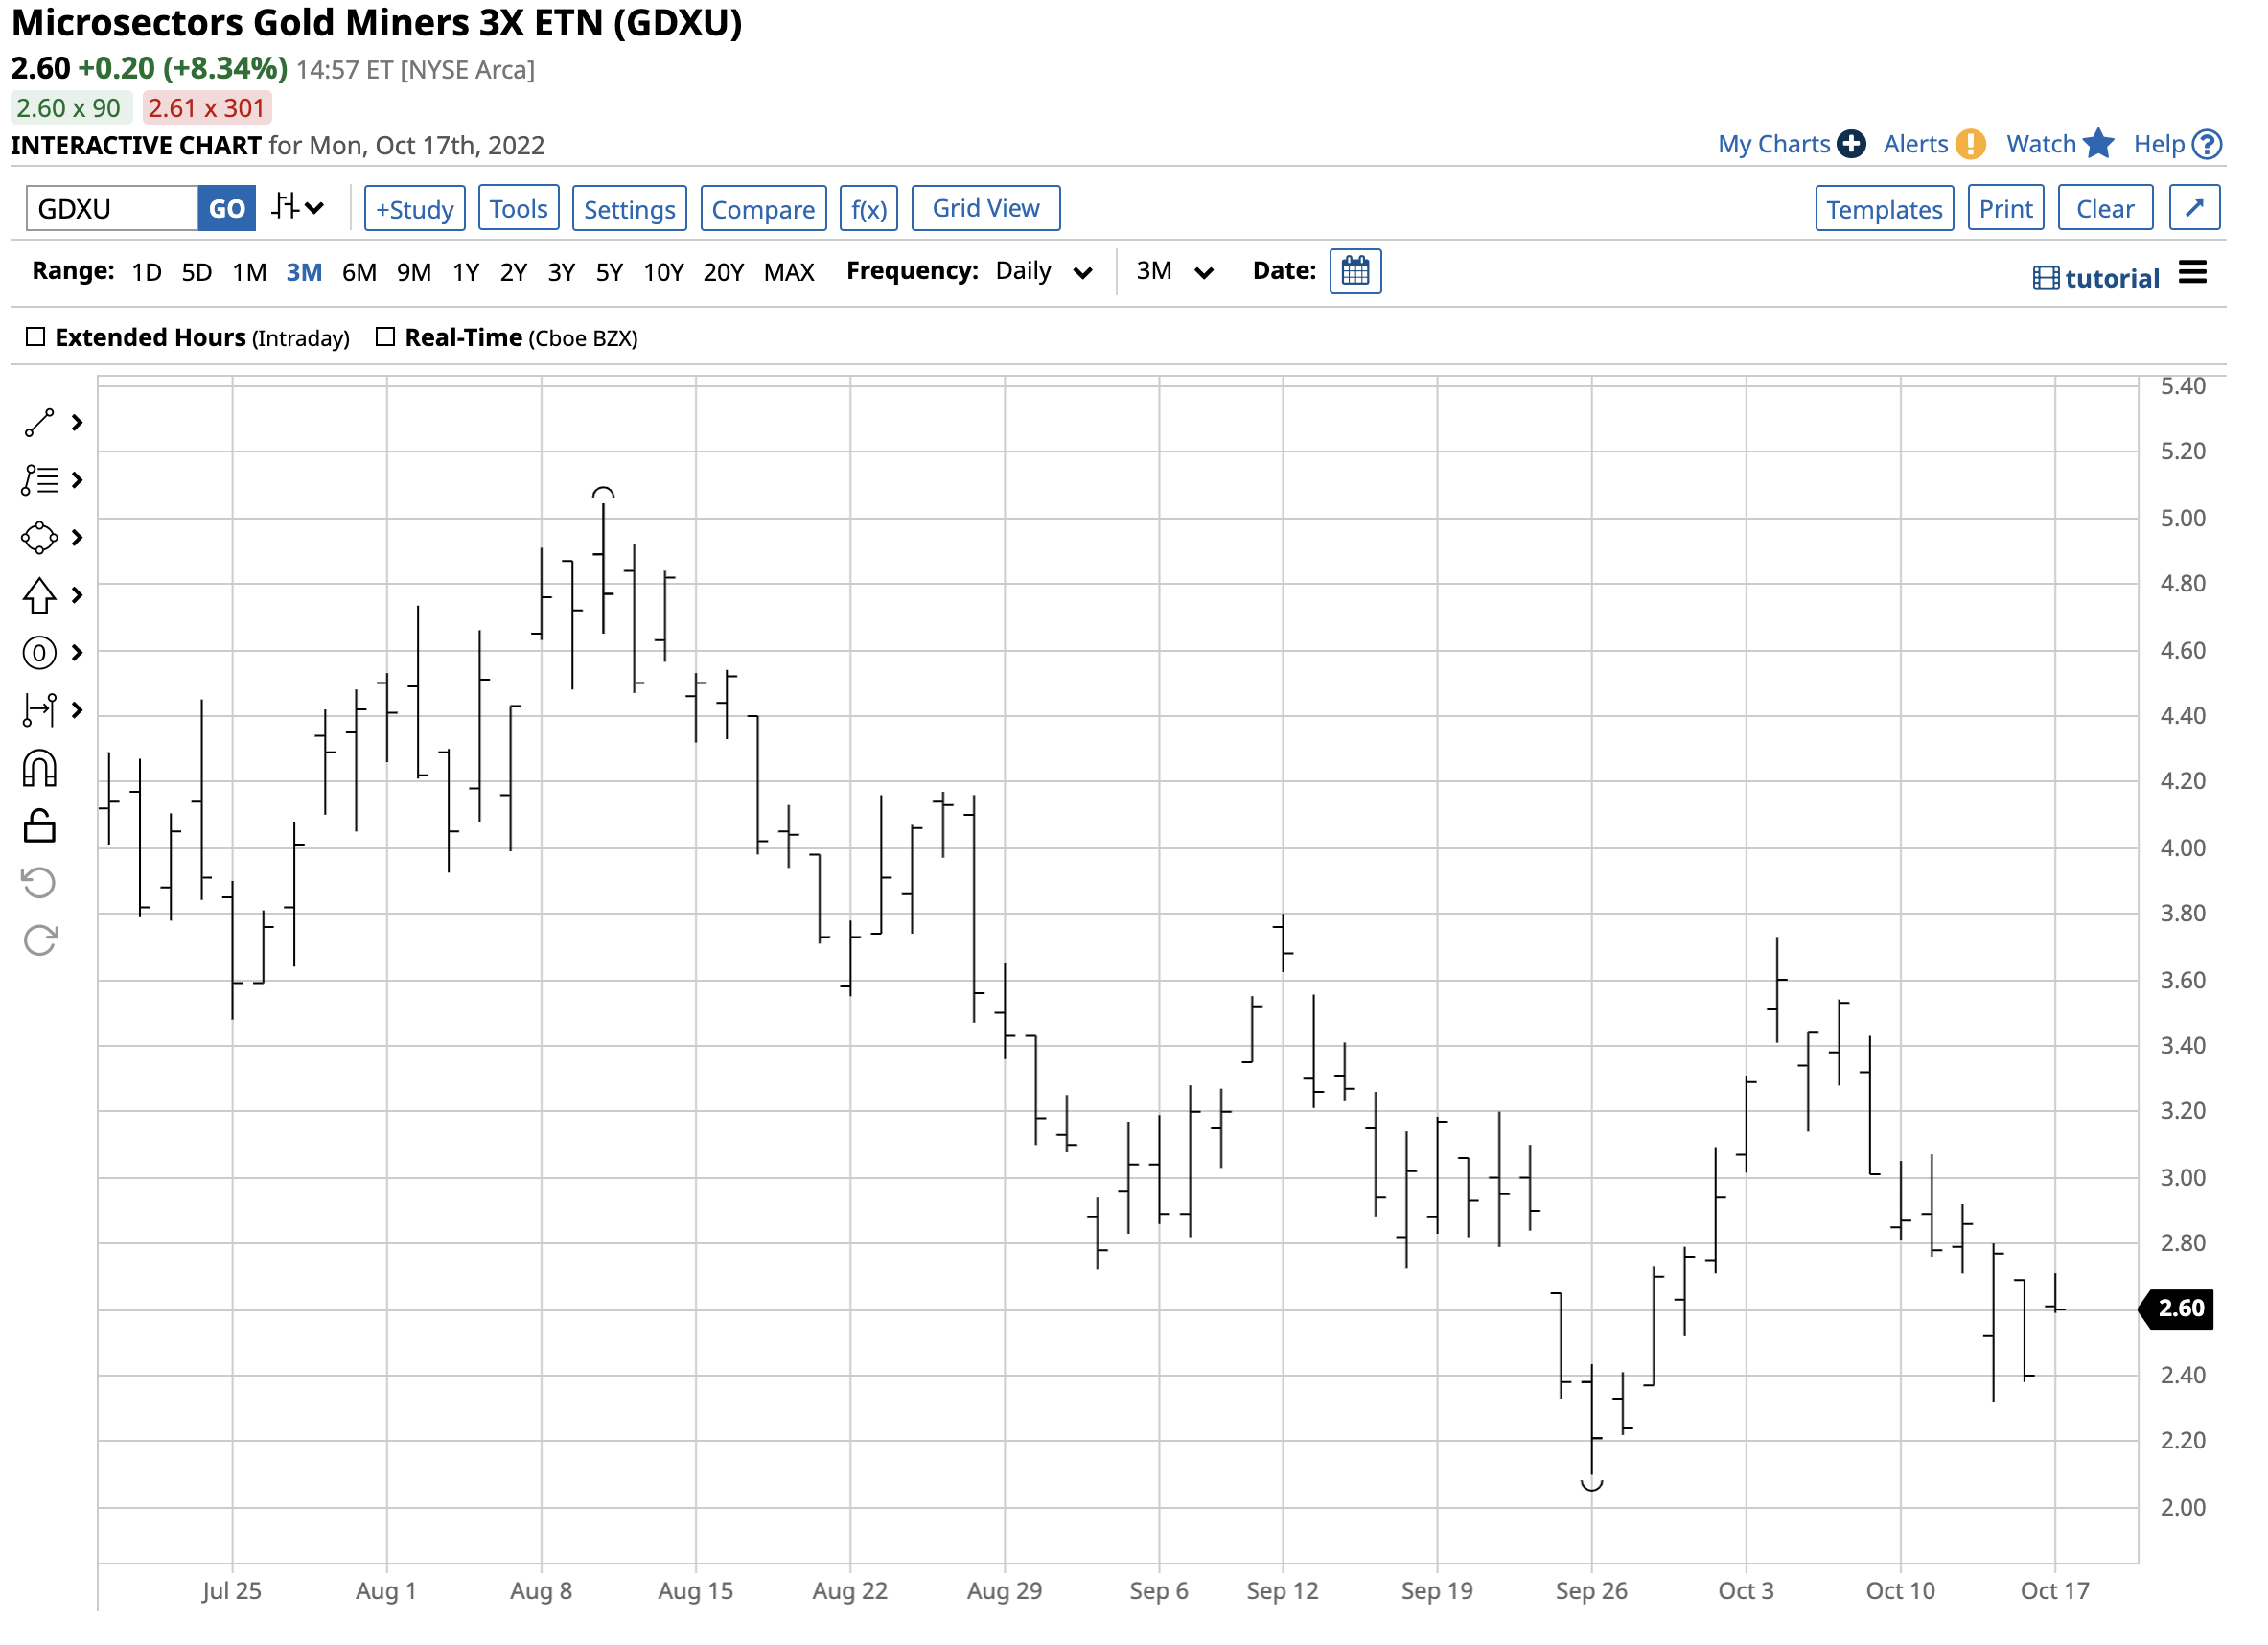
Chart of the GDXU Leveraged ETN Product (Barchart)
GDXU exploded higher from $2.10 on September 26 to $3.73 on Oct. 4, a 77.6% increase. Over the same period, the unleveraged GDX ETF rose from $21.86 to $26.11 per share, or 19.4%. GDX provided over double leverage to the gold futures, while the GDXU ETN moved more than three times higher than the unleveraged GDX ETF.
GDXU is only appropriate for short-term traders looking to time the gold futures and gold mining shares. If gold mining shares decline or remain static, GDXU will decay as the product uses options to create leverage.
I believe the long-term bullish trend in gold will continue. GDXU could be a valuable trading tool that turbocharges performance when looking to increase exposure when gold prices turn higher. Trading GDXU requires price and time stops as time decay will cause long-term holders to wind up with a product that is a dust collector in portfolios. However, those looking for action via a dynamic and flexible approach could use GDXU to enhance their returns.
Be the first to comment