

Ruth Peterkin
Carnival Cruise Lines (NYSE:CCL) has had a very difficult year-to-date. The shares are down more than 62% for the YTD, with annualized 1-, 3-, and 5-year returns of -60.7%, -39.1%, and -26.6% per year (respectively). Many consumers have resumed leisure travel in 2022, with a substantial recovery in cruise bookings. Even so, global cruise revenues are not expected to return to pre-pandemic levels until 2027. CCL closed at a 12-month low of $6.38 on October 10th, but has subsequently risen 36.5% to reach the current level, $8.71. This bounce is attributable to the shares having sold off dramatically following Q3 results, as well as because the broader market has risen since mid-October.
Seeking Alpha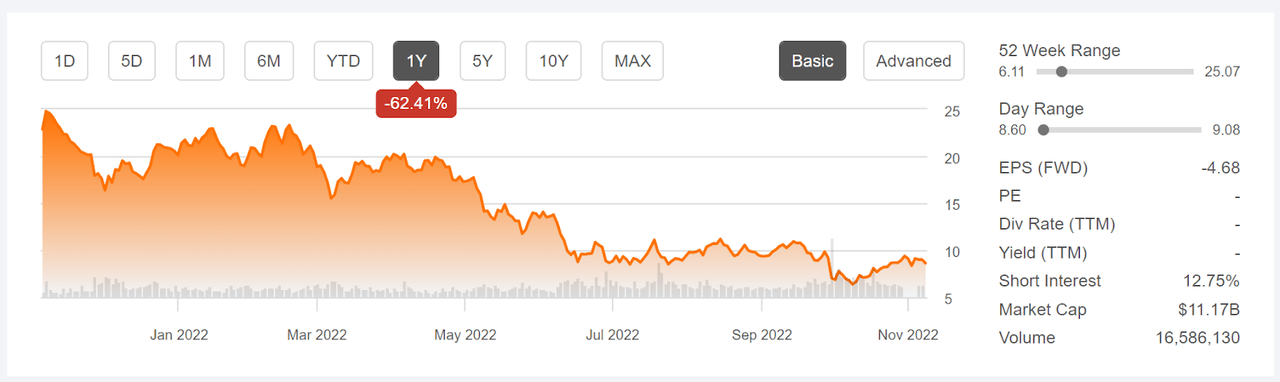
12-Month price history and basic statistics for CCL (Source: Seeking Alpha)
CCL reported Q3 results on September 30th, missing expectations on earnings and revenue and the shares dropped 15% for the day. While the analysts expected negative EPS to continue as the industry recovers from the impacts of COVID, CCL has consistently missed expectations. Earnings have been below the consensus in all of the past 11 quarters.
ETrade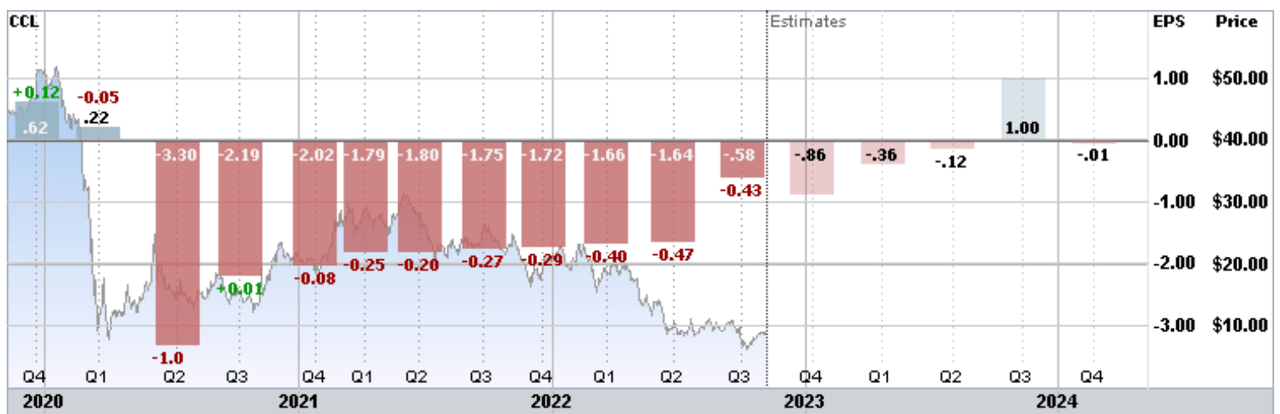
Historical (3 years) and estimated future quarterly EPS for CCL. Red (green) values are amounts by which EPS missed (beat) the consensus expected value (Source: ETrade)
The challenging recovery for cruise lines has been exacerbated by a number of factors. In China, the strict COVID policies have resulted in CCL dramatically cutting back on activity in Asia. An even larger challenge is the increases in debt resulting from extended periods of having ships docked during COVID. Morgan Stanley cited high debt levels as one of the main considerations in downgrading CCL in June and warned that “Carnival shares could lose all of their value if the economy falls into a recession.”
I last wrote about CCL on December 2, 2021, about 11 months ago, at which time I maintained a bearish / sell rating on the shares. At that time, the Wall Street analyst consensus was mixed. ETrade calculated a consensus rating of hold, while Investing.com calculated a consensus rating of buy. Both had consensus price targets far above the share price at that time. ETrade’s consensus price target was 73% above the December 2nd share price, while Investing.com calculated a consensus price target that was 60% above the share price at that time. One red flag in interpreting the analyst consensus was the large spread among the individual price targets. The consensus price target is a meaningful predictor only when this spread is low to moderate. When the dispersion in individual price targets on a stock is high, one study has found a negative correlation between the returns implied by the consensus and subsequent performance. As a rule of thumb, I strongly discount the consensus price target when the ratio of the highest and lowest individual price targets exceeds a value of 2. For CCL in early December, this ratio was 2.05 in ETrade’s results and 2.28 in Investing.com’s. I did not consider the high implied return from the consensus price target to be meaningful. I also considered the market-implied outlook, a probabilistic price forecast that represents the consensus view among options traders. The market-implied outlook was strongly bearish. Since the close of December 2, 2021, CCL has returned -51%, as compared to -16.3% for the S&P 500 (SPY).
For readers who are unfamiliar with the market-implied outlook, a brief explanation is needed. The price of an option on a stock is largely determined by the market’s consensus estimate of the probability that the stock price will rise above (call option) or fall below (put option) a specific level (the option strike price) between now and when the option expires. By analyzing the prices of call and put options at a range of strike prices, all with the same expiration date, it is possible to calculate a probabilistic price forecast that reconciles the options prices. This is the market-implied outlook. For a deeper explanation and background, I recommend this monograph published by the CFA Institute.
I have calculated updated market-implied outlooks for CCL and I have compared these with the current Wall Street consensus outlook in revisiting my rating.
Wall Street Consensus Outlook for CCL
ETrade calculates the Wall Street consensus outlook for CCL using price targets and ratings from 12 ranked analysts who have published their views over the past 3 months. The consensus rating on CCL is a hold, as it has been for almost all of the past year. The consensus 12-month price target is 21.6% above the current share price. Similar to my previous analysis, there is a high level of dispersion among the individual price targets. The ratio of the highest and lowest price targets 3.67, which is very high. Because of this large spread in opinion, I put very little weight on the consensus outlook.
ETrade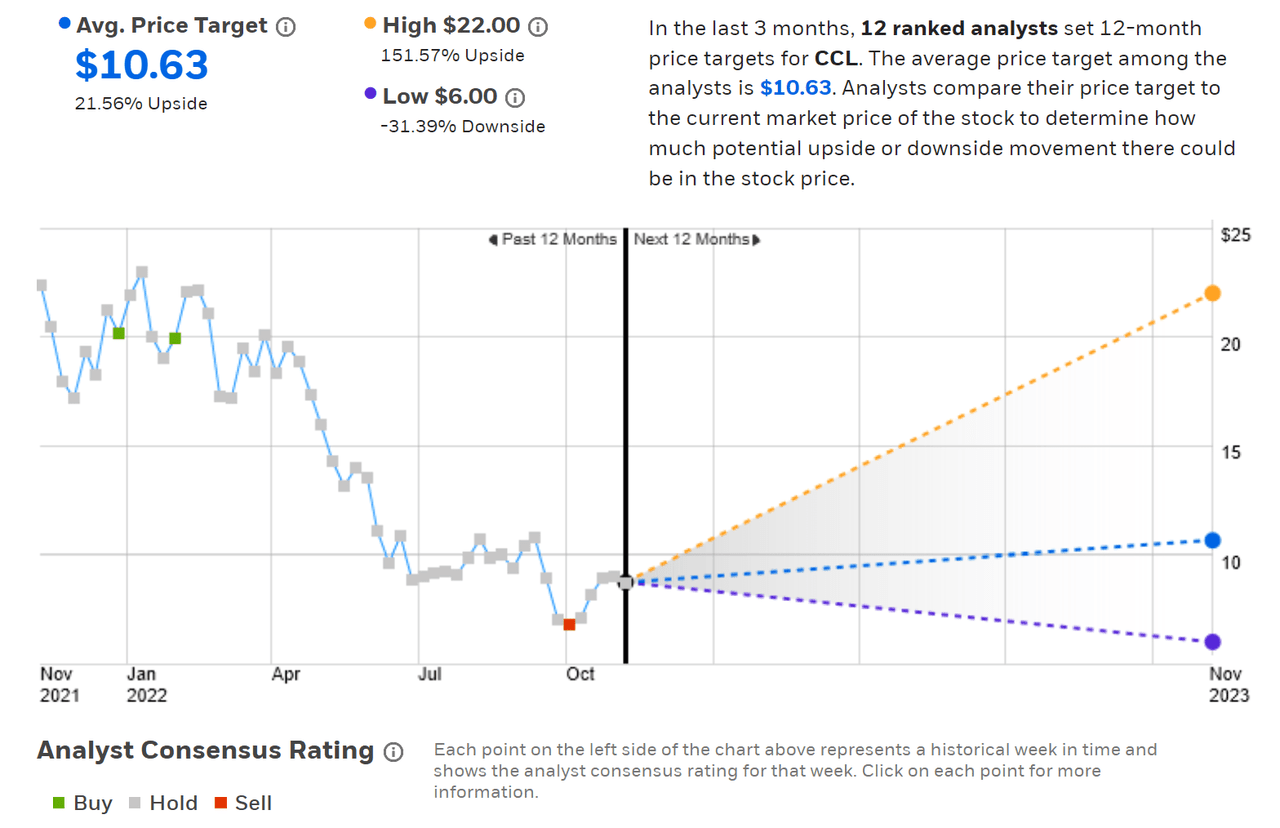
Wall Street analyst consensus rating and 12-month price target for CCL (Source: ETrade)
Seeking Alpha’s version of the consensus outlook is based on the views of 22 analysts who have published opinions over the last 90 days. The consensus rating is a hold and the consensus 12-month price target is 38.4% above the current share price. Consistent with ETrade’s results, the spread in analyst price targets is high, with the ratio of the highest and lowest price targets equal to 6.
Seeking Alpha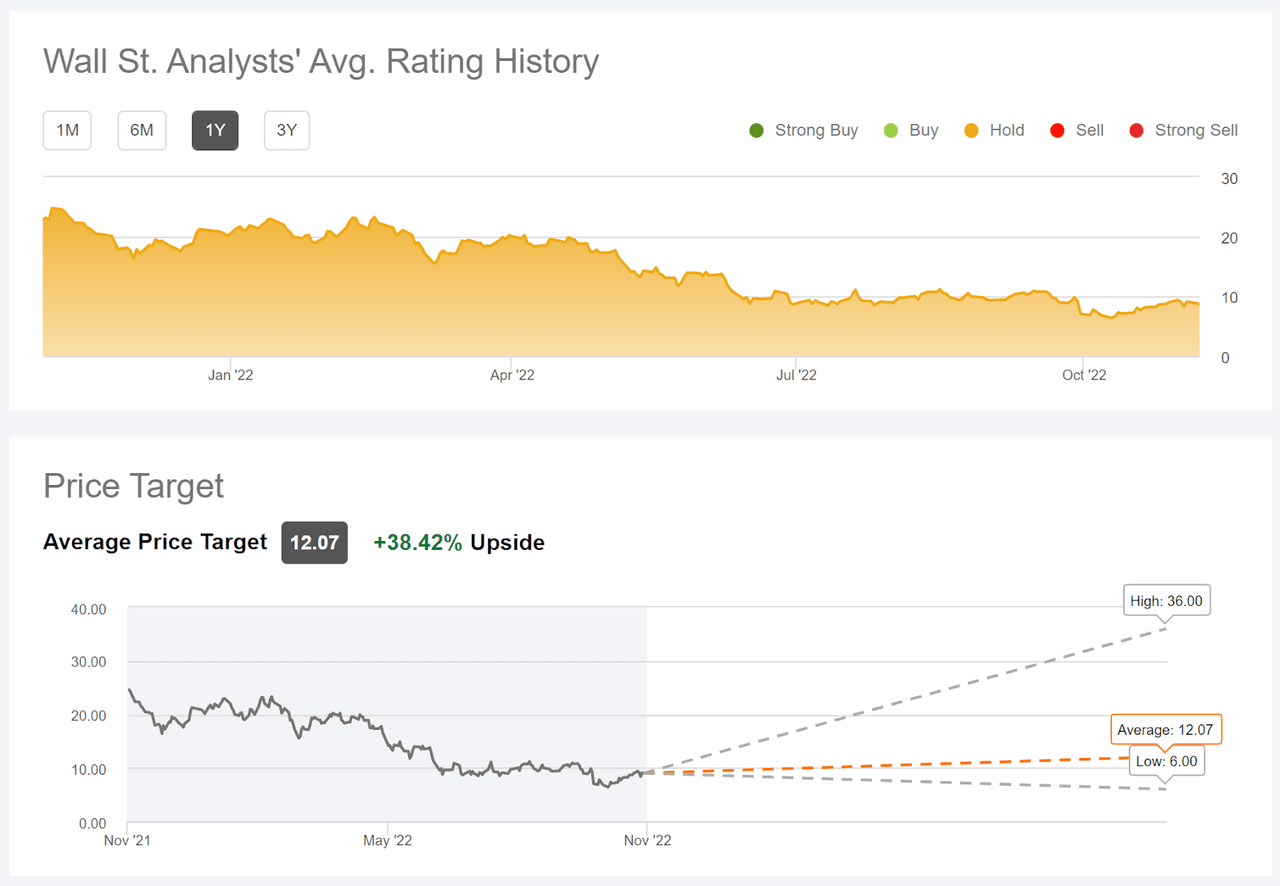
Wall Street analyst consensus rating and 12-month price target for CCL (Source: Seeking Alpha)
While these two versions of the consensus outlook are consistent, with a hold rating and expected price appreciation of 21.6% to 38.4%, the large spread in opinions leads me to view these results are somewhat meaningless, based on research into the predictive value of the consensus. If anything, these results indicate a somewhat bearish view for CCL because the large spread in opinion tends to correspond to a negative correlation between the returns implied by the consensus price target and the subsequent performance.
Market-Implied Outlook for CCL
I have calculated the market-implied outlooks for CCL for the 2.4-month period from now until January 20, 2023 and for the 7.3-month period from now until June 16, 2023, using the prices of call and put options that expire on these dates. I selected these two expiration dates to provide a view through the end of 2022 and to the middle of 2023. One notable feature of the options on CCL is the very high open interest for a stock with such a low market capitalization (about $11 Billion). The option trading volume would look high even if the market cap was more than twice the current value.
The standard presentation of the market-implied outlook is a probability distribution of price return, with probability on the vertical axis and return on the horizontal.
Geoff Considine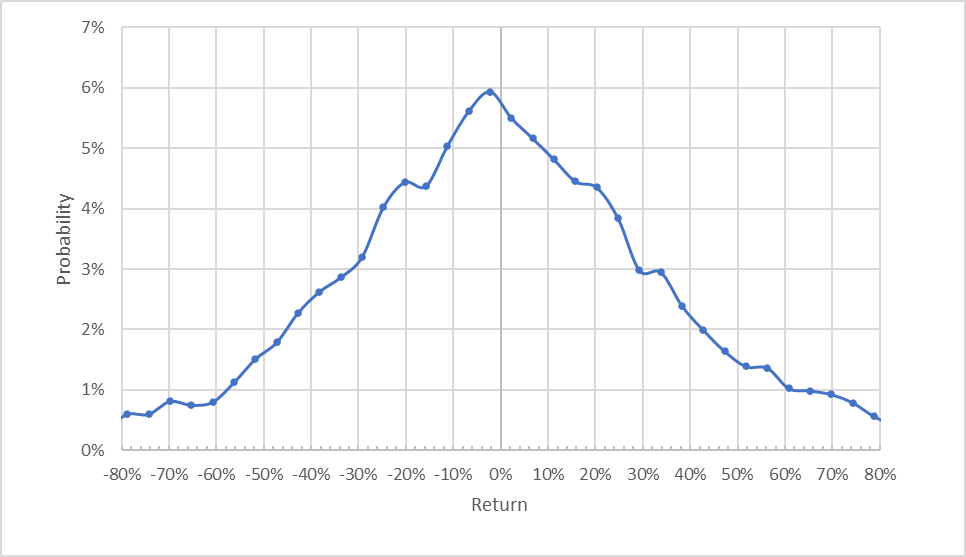
Market-implied price return probabilities for CCL for the 2.4-month period from now until January 20, 2023 (Source: Author’s calculations using options quotes from ETrade)
The market-implied outlook to the middle of January of 2023 looks quite symmetric, with comparable probabilities of positive and negative returns of the same magnitude and the maximum-probability outcome very close to zero return. The actual peak corresponds to a return of -2%, but this is not meaningfully different from zero given CCL’s extremely high volatility. The expected volatility calculated from this distribution is 84% (annualized). For comparison, ETrade calculates 78% implied volatility for the options expiring on January 20, 2023.
To make it easier to compare the relative probabilities of positive and negative returns, I rotate the negative return side of the distribution about the vertical axis (see chart below).
Geoff Considine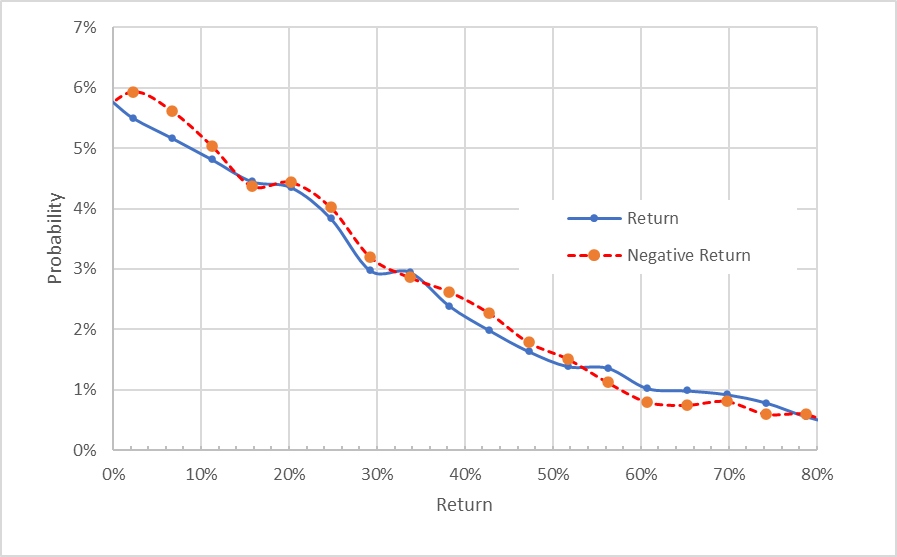
Market-implied price return probabilities for CCL for the 2.4-month period from now until January 20, 2023. The negative return side of the distribution has been rotated about the vertical axis (Source: Author’s calculations using options quotes from ETrade)
This view highlights how closely the probabilities of positive returns match those of negative returns (the dashed red line is very close to the solid blue line over a wide range of possible outcomes). The probabilities of negative returns tend to be slightly elevated over the most-probable outcomes (the dashed red line is at or above the solid blue line over the left ⅔ of the chart above), which would suggest a slight bearish tilt.
Theory indicates that the market-implied outlook is expected to have a negative bias because investors, in aggregate, are risk averse and thus tend to pay more than fair value for downside protection. There is no way to measure the magnitude of this bias, or whether it is even present, however. The expectation of a negative bias shifts what would otherwise look like a slightly bearish outlook to a neutral or even a slightly bullish view.
The market-implied outlook for the 7.3 months from now until June 16, 2023 is more obviously bearish, with elevated probabilities of negative returns (see chart below). The peak in probability corresponding to a price return of -100% reflects the possibility that the shares go to zero. The probability of a complete loss of value is not meaningfully estimated using options prices (as discussed in the CFA overview linked previously), although there is a demonstrable relationship between the prices of credit default swaps on a stock and the option implied volatility. The expected volatility calculated from this outlook, which is a form of implied volatility, is 79%. Simply put, this is a bearish outlook for CCL to the middle of 2023. For a matter of quantitative interest, the market-implied outlook estimates a 5% probability that CCL goes to zero.
Geoff Considine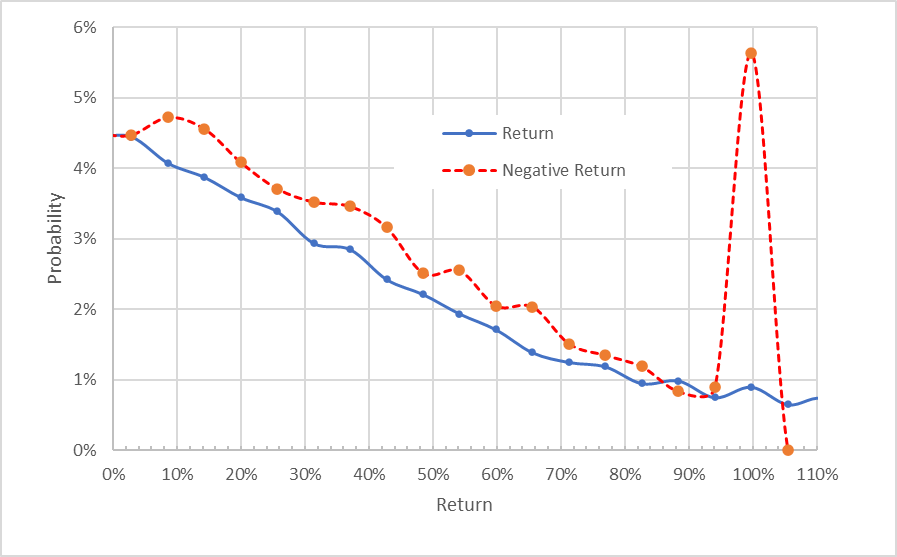
Market-implied price return probabilities for CCL for the 7.3-month period from now until June 16, 2023. The negative return side of the distribution has been rotated about the vertical axis (Source: Author’s calculations using options quotes from ETrade)
While the market-implied outlook for CCL to mid-January of 2023 looks quite benign directionally, albeit with very high volatility, the outlook to the middle of 2023 is bearish, also with extremely high volatility. While I have little confidence in the options-based estimate of the probability of default (probability that the shares lose 100% of their value), the market-implied outlook shows that investors are paying a very high premium for put options with strike prices that are far below the current share price.
Summary
The COVID-19 pandemic was a huge and unforeseeable shock for cruise lines, and CCL currently trades at a value that is just 17% of the pre-COVID 2020 high close of $51.90 on January 17, 2020. At the end of June of 2022, Morgan Stanley wrote that the shares could go to zero in the event of a global economic decline. While the consensus is that global cruise revenues will not return to pre-pandemic levels until 2017, cruise bookings have rebounded smartly in 2022. The Wall Street consensus rating for CCL is a hold and the consensus 12-month price target implies a gain of 21.6% to 38.4% over the next year, the very large spread in analyst price targets means that the consensus may not be a useful guide and tends to suggest a bearish view. The market-implied outlook for CCL is neutral (and perhaps even slightly bullish) to mid-January of 2023, albeit with extremely high expected volatility (84% annualized). The market-implied outlook to the middle of June of 2023 is bearish, however, with expected volatility of 79% (annualized) and a notably high estimated probability of a 100% loss (although the specific estimated probability of default is not considered to be very meaningful). The big picture question is why one would take on a stock with such a high level of expected risk and without a compelling belief that the shares are dramatically undervalued. As a rule of thumb for an attractive risk-return balance, I want to see an expected 12-month return that is at least ½ the expected volatility (about 80%). Given the current economic outlook, it is very hard for me to see a strong growth case for CCL over the next year, such that the potential returns would be 40% or more. I am maintaining a sell rating on CCL.
Be the first to comment