

EUR/USD, USD Talking Points:
- EUR/USD put in a large move at the end of last week, jumping up to a fresh four-month-high, finding resistance at a familiar area of 1.0350.
- The EUR/USD downtrend pressed aggressively from February through September but the build of higher-lows in October started to give the look of pullback potential, which is now taking place. The big question at this point is for how long the move might run, or whether we’re seeing a full-scale reversal of the bearish theme.
- The analysis contained in article relies on price action and chart formations. To learn more about price action or chart patterns, check out our DailyFX Education section.
Recommended by James Stanley
Get Your Free EUR Forecast
The longer that a trend runs, the more aggressively it can pull back. We’ve seen this in stocks a few times already this year and it’s now starting to show in EUR/USD.
EUR/USD is the most popular currency pair in the world and it represents the two largest economies of Europe and the United States. Generally speaking, stability is the desired trait in the pair so that there’s a minimum of volatility derived from currency fluctuations on either side of the Atlantic. But, what’s desired isn’t always so and when a strong trend does develop, such as we’ve seen since February of this year, markets are constantly jostling to find that equilibrium of what’s perceived as ‘fair value.’
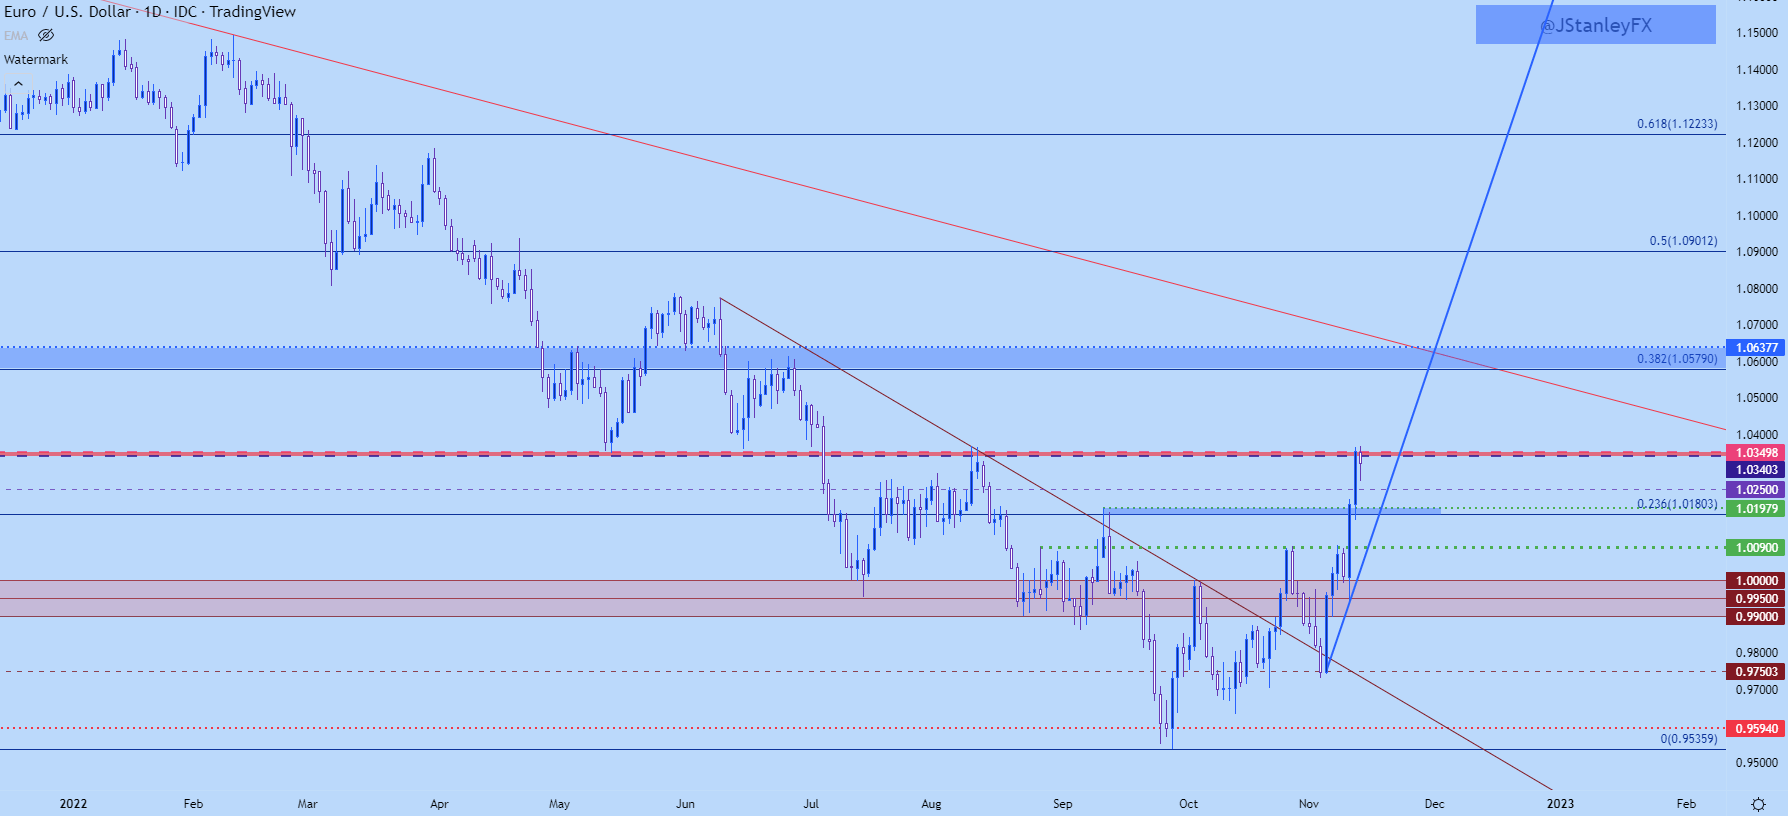
In EUR/USD at the moment, the proverbial rubber band was pulled fairly far back going into October trade and that’s started to snap as prices have started to put in notable rallies, with a strong breakout last Thursday after the release of CPI data out of the US. The move continued on Friday, with EUR/USD pushing up to a very key zone on the chart at 1.0350. This was the swing-low in 2017 and when it came back into the picture last May, it was functioning as the five-year-low in the pair.
It held support in May and June, only to succumb to selling pressure in July. But, it popped back up again in August as resistance before sellers were able to push a break below the parity figure. Now that level is back in the picture in a different way, as EUR/USD has a full head of steam after last week’s breakout. This started from a build of higher-lows in late-October, with a bullish channel soon appearing that made up a possible bear flag formation. But, that bear flag was nullified in last week’s breakout and that put the focus on short-term strength as the longer-term oversold condition continued to correct.
There’s support potential at prior areas of resistance, taken from the late-September high of 1.0198 which is confluent with the 23.6% Fibonacci retracement of the February-October sell-off. And below that, the 1.0090 level retains higher-low support potential as well, as this was resistance last week just before the breakout and it hasn’t yet been tested as higher-low support.
EUR/USD Daily Price Chart
Chart prepared by James Stanley; EURUSD on Tradingview
EUR/USD: Can Bulls Force a Reversal
I keep an open mind on these matters because whether a bottom is in or not is rather irrelevant to my day-to-day approach. It’s also guesswork, at least in my opinion.
Many reversals start as a short squeeze. And then before you know it, they take on a life of their own and you have an entirely new bullish trend to work with. Complicate that with the fact that different trends show across different time frames, and it soon becomes a matter of subjectivity. But, one item that can help is perspective; taking a longer-term look at the matter to put into scope just what this recent theme means in the bigger picture.
And in EUR/USD, last week’s push was notable as it flung price to those fresh four-month-highs. But – it’s also still very early and at this point EUR/USD hasn’t even retraced 50% of the February-September move, nor has it tested through the 38.2% retracement of the May 2021-September 2022 major move.
So, with that perspective we could still consider this as a longer-term bearish trend that’s in process of correction. But, given how long that trend had run, this correction may also have more scope before the bigger picture bearish move is ready for continuation. But, now we need to look at the shorter-term part of the matter, as EUR/USD is already showing tendencies of near-term overbought behavior.
Recommended by James Stanley
Building Confidence in Trading
EUR/USD Weekly Chart

Chart prepared by James Stanley; EURUSD on Tradingview
EUR/USD Shorter-Term
From the four-hour chart, RSI pushed into overbought territory last week after the rally pushed up to the 1.0350 level, indicating how aggressive the matter was on a short-term basis. This also indicates that the short-term trend may be a little hot at the moment. This brings in short-term pullback potential and there’s areas of prior resistance that remain of interest for possible support.
The September swing-high of 1.0198 remains of interest. This stalled the breakout last week but didn’t really provide much for notable resistance. The next level down did, however, as 1.0090 was the late-October swing-high that held resistance early last week, just before CPI. That allowed for prices to pullback to .9950 before launching higher after the release of the report.
Closer to near-term price, we can see the lows this morning holding around the 38.2% Fibonacci retracement of the February-September move; and just below that, around 1.0250, there’s a major psychological level.
Recommended by James Stanley
How to Trade EUR/USD
EUR/USD Four-Hour Price Chart
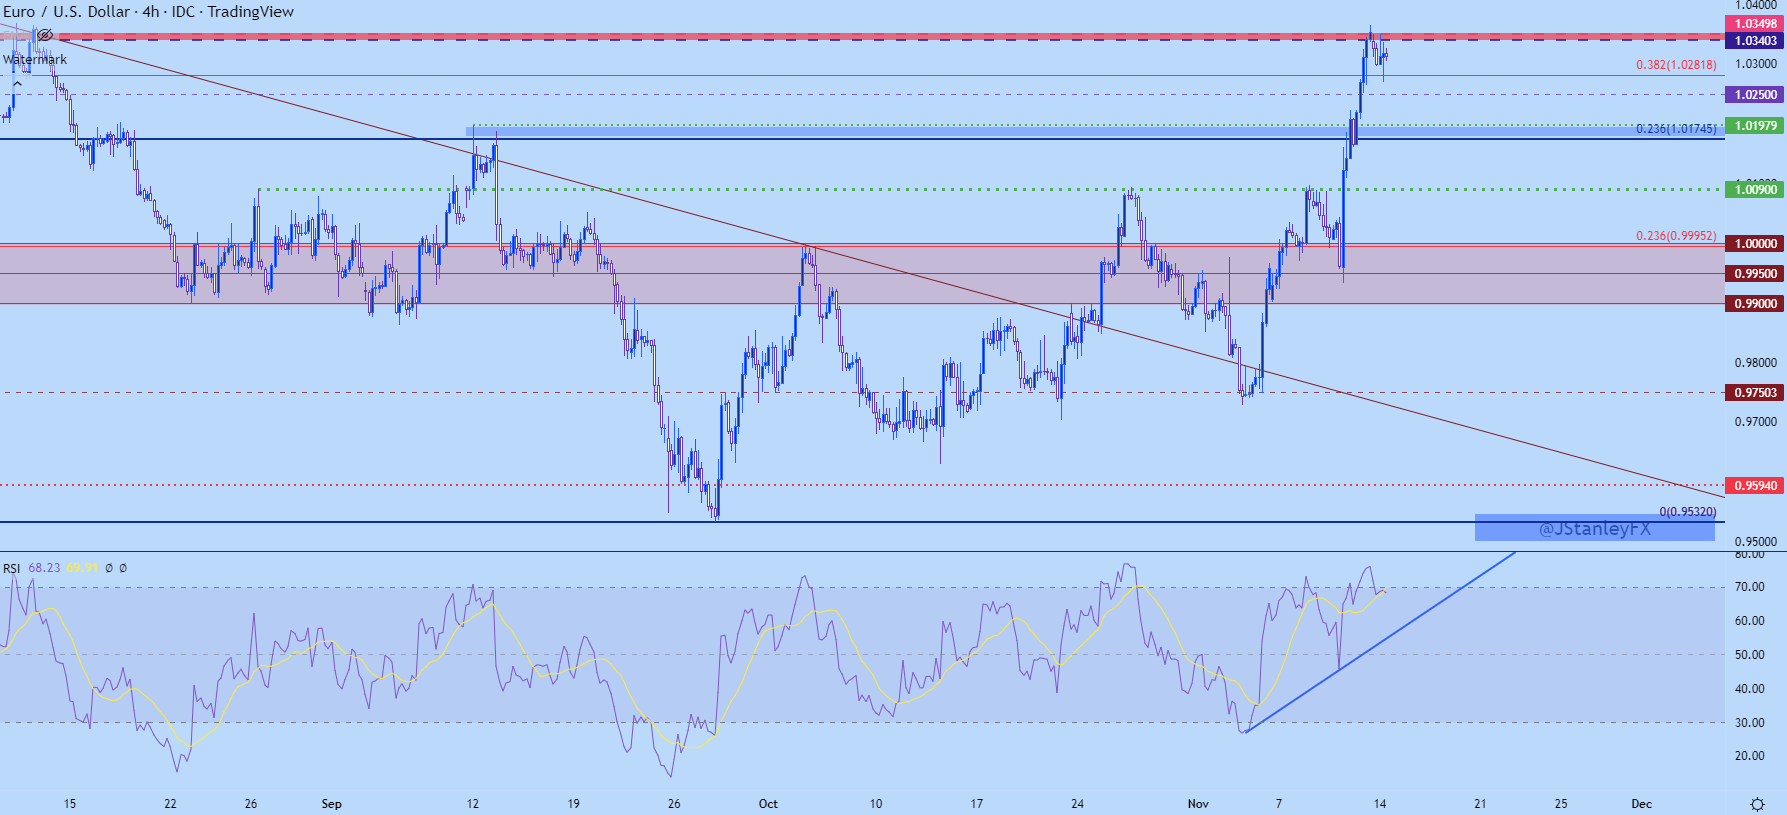
Chart prepared by James Stanley; EURUSD on Tradingview
— Written by James Stanley, Senior Strategist, DailyFX.com & Head of DailyFX Education
Contact and follow James on Twitter: @JStanleyFX
Be the first to comment