

EUR/USD started a strong increase above the 1.0200 resistance zone. USD/JPY started a major decline below the 143.50 support zone.
Important Takeaways for EUR/USD and USD/JPY
· The Euro formed a base and started a strong upward move above the 1.0200 zone.
· There is a key bullish trend line forming with support near 1.0290 on the hourly chart of EUR/USD.
· USD/JPY declined sharply after it traded below the 145.60 support zone.
· There is a major bearish trend line forming with resistance near 143.55 on the hourly chart.
EUR/USD Technical Analysis
This past week, the Euro found support near the 0.9950 zone against the US Dollar. The EUR/USD pair started a steady upward move above the 1.0100 and 1.0200 resistance levels.
There was a steady increase above the 1.0350 resistance zone and the 50 hourly simple moving average. The pair even climbed above the 1.0400 resistance zone. A high was formed near 1.0479 on FXOpen and the pair is now consolidating gains.
An immediate resistance on the upside is near the 1.0380 level. It is near the 50% Fib retracement level of the recent decline from the 1.0479 swing high to 1.0277 low.
The next major resistance is near the 1.0430 level. It is close to the 76.4% Fib retracement level of the recent decline from the 1.0479 swing high to 1.0277 low. An upside break above 1.0430 could set the pace for another increase.
In the stated case, the pair might revisit 1.0480. Any more gains might send the pair towards 1.0550. An initial support on the downside is near the 1.0340 level.
The first major support is near the 1.0300 level. There is also a major bearish trend line forming with resistance near 143.55 on the hourly chart. The main support sits near the 1.0250 zone, below which the pair could start a major decline.
USD/JPY Technical Analysis
The US Dollar started a fresh decline from well above the 150.00 zone against the Japanese Yen. The USD/JPY pair declined below the 148.50 and 147.00 levels.
There was a drop below the 146.50 level and the 50 hourly simple moving average. The bears even pushed the pair below the 140.00 level. It tested the 137.50 zone. A low is formed near 137.67 and the pair is now correcting higher.
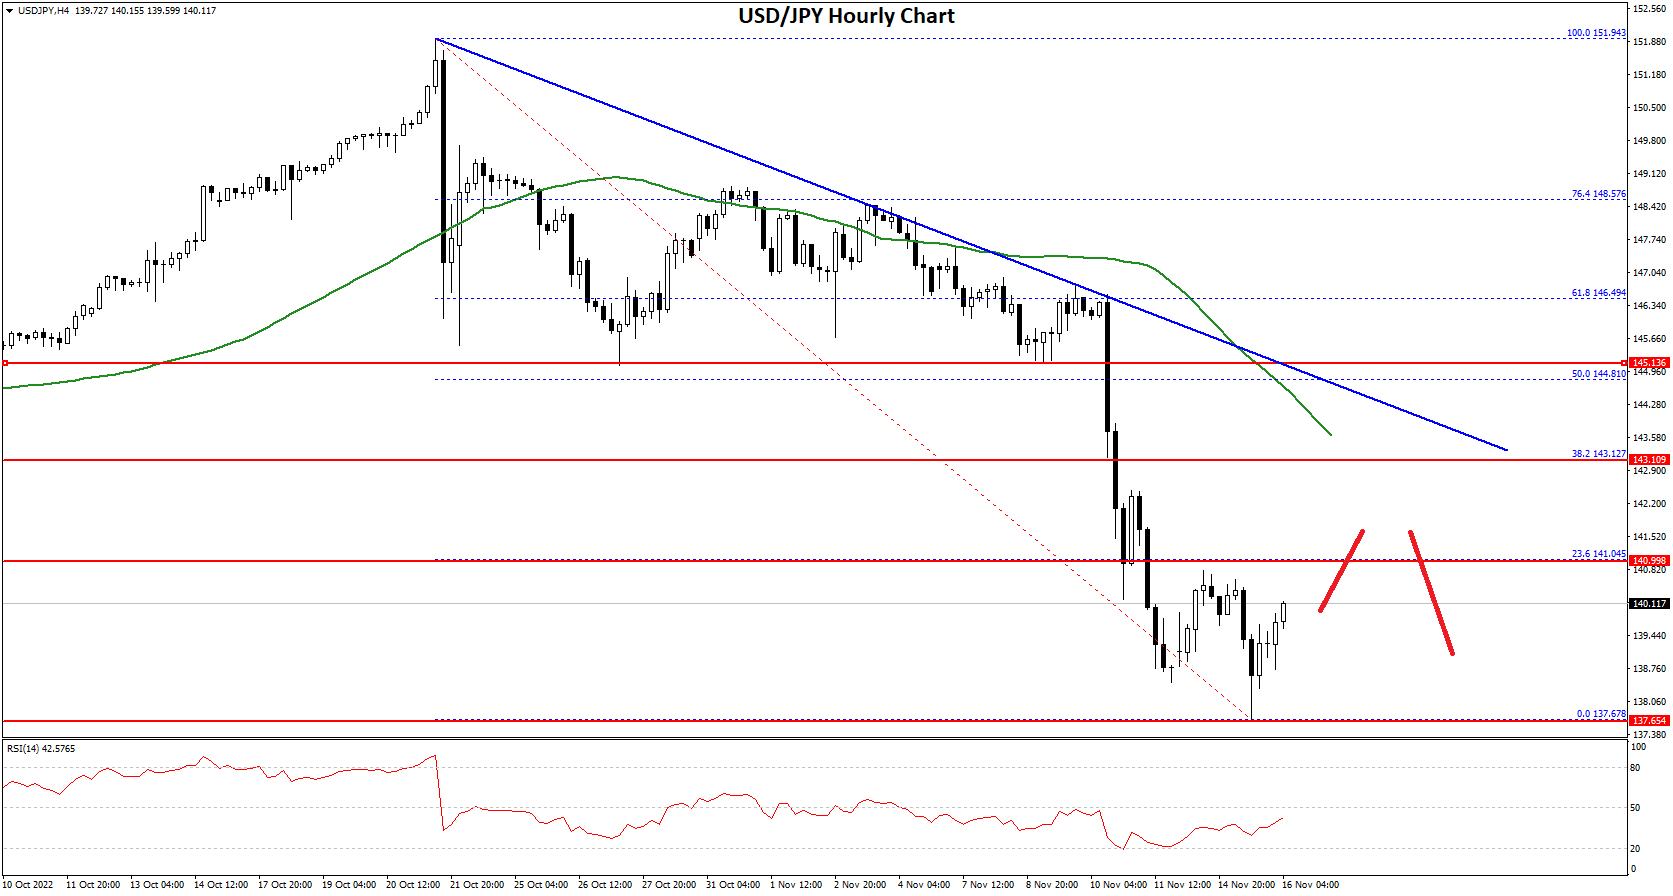
There was a move above the 138.50 level. An immediate resistance is near the 141.00 level. It is close to the 23.6% Fib retracement level of the downward move from the 151.94 swing high to 137.67 low.
The next major resistance is near the 143.20 level. There is also a major bearish trend line forming with resistance near 143.55 on the hourly chart. The trend line is near the 38.2% Fib retracement level of the downward move from the 151.94 swing high to 137.67 low.
Any more gains could send the pair towards the 144.50 level. The next key hurdle is near the 145.60 level. An initial support on the downside is near the 139.20 level. The next major support is near the 138.00 level. Any more downsides might lead the pair towards the 137.50 support zone, below which the bears might aim a test of the 135.00 support zone.
This forecast represents FXOpen Companies opinion only, it should not be construed as an offer, invitation or recommendation in respect to FXOpen Companies products and services or as financial advice.
Trade global forex with the best ECN broker of 2021*.
Choose from 50+ forex markets 24/5.
Open your FXOpen account now or learn more about making your money go further with FXOpen.
* FXOpen International, best ECN broker of 2021, according to the IAFT

Be the first to comment