

imaginima/E+ via Getty Images
Back in January, I expected apartment real estate investment trusts (“REITs”) to outperform the REIT average. Thanks to the mad rush to high yield brought on by inflation, that hasn’t happened. According to Hoya Capital Income Builder, the Apartment REIT sector’s total return of (-14.62)% YTD slightly trails the Equity REIT Index of (-12.54)%.
Hoya Capital Income Builder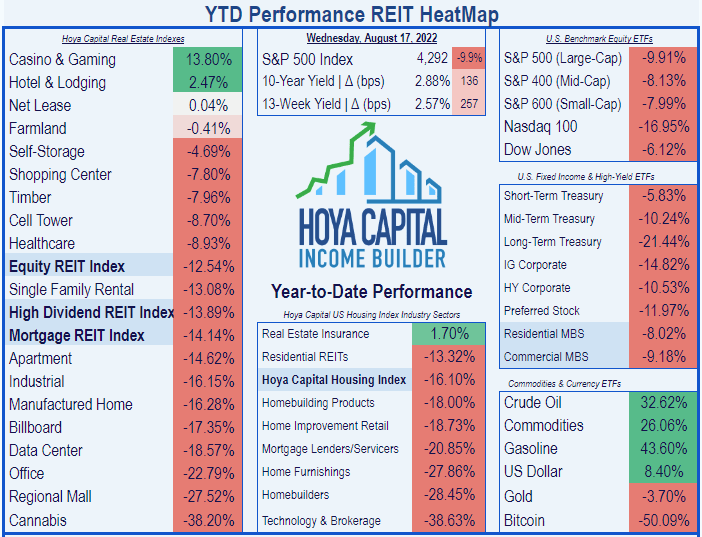
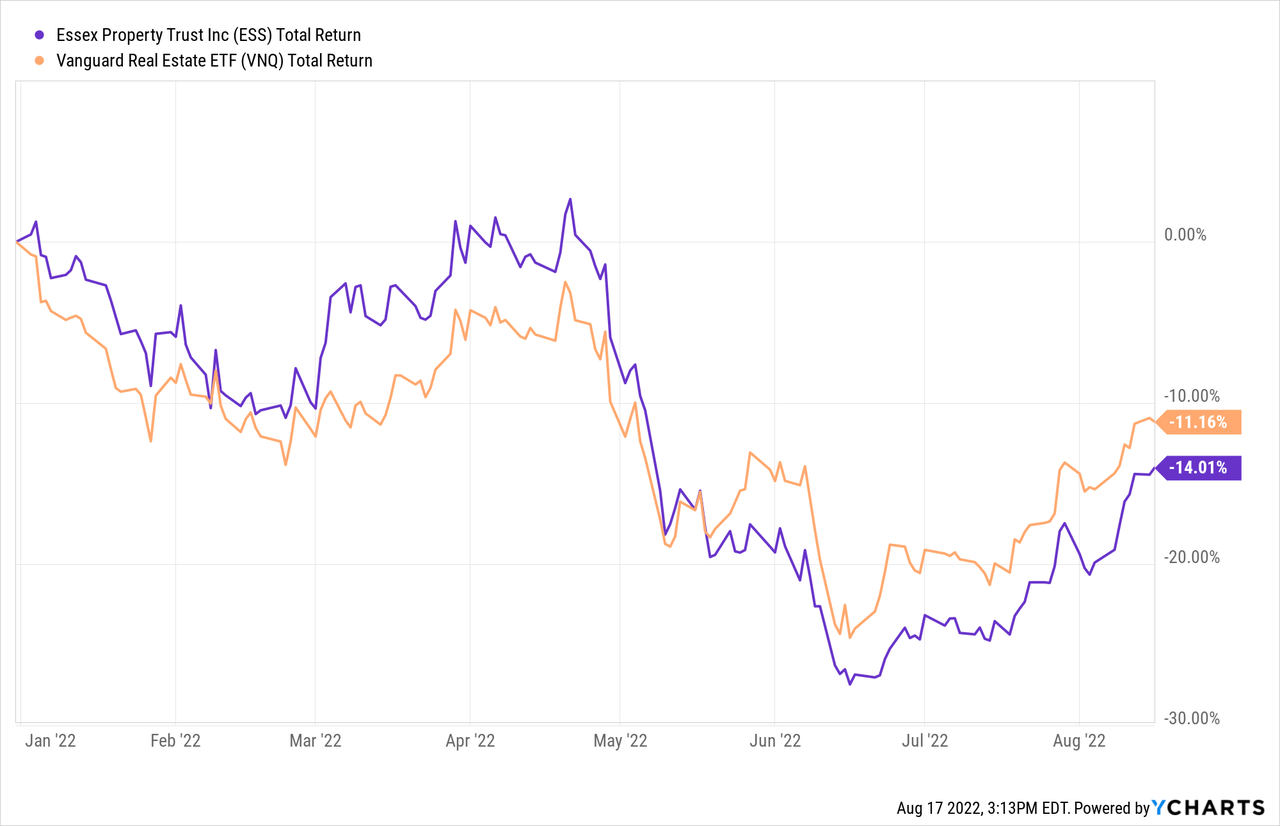
Essex Property Trust, Inc. (NYSE:ESS) has been typical of Apartment REITs in its total return, losing (-14.0)% thus far this year.
The price movement, however, stands in sharp contrast to the company’s performance. Essex just posted its second straight beat-and-raise quarter.
This article examines growth, balance sheet, dividend, and valuation metrics for this Cadillac of apartment REITs.
Meet the company
Founded in 1971 and headquartered in San Mateo, California, Essex Property Trust owns 253 apartment communities in 8 major West Coast markets, totaling about 62,000 units. The company divides these into three regions:
- Northern California (85 communities)
- Southern California (104 communities), and
- Seattle Metro (59 communities).
In a recent article, I went into considerable detail about this company. For the sake of this article, suffice it to say Essex deals in high-end apartments (average rent near $2800 per month), and is benefitting from the return to office of high-tech workers displaced by the pandemic.
Company investor presentation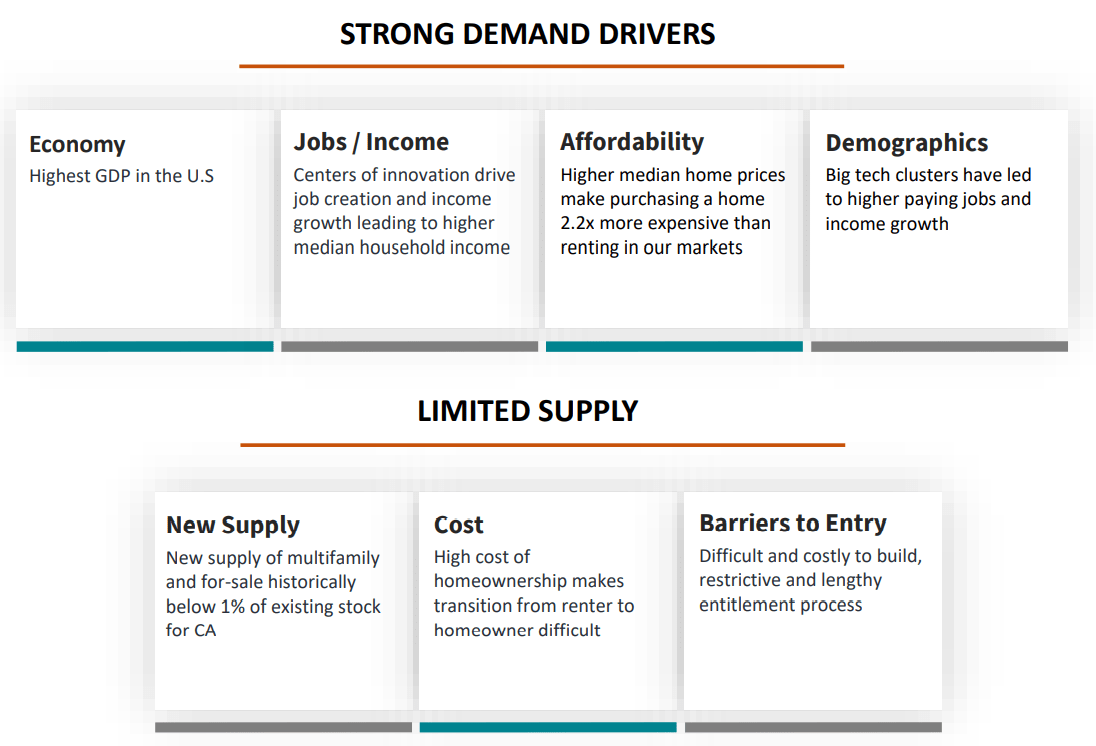
The West Coast states of California, Oregon, and Washington have higher-than-average GDP and job growth. At the same time, restricted supply due to high barriers to entry and demanding regulations drives up the rent on existing apartments. Still, purchasing a house on the West Coast costs more than double the cost of renting.
Company investor presentation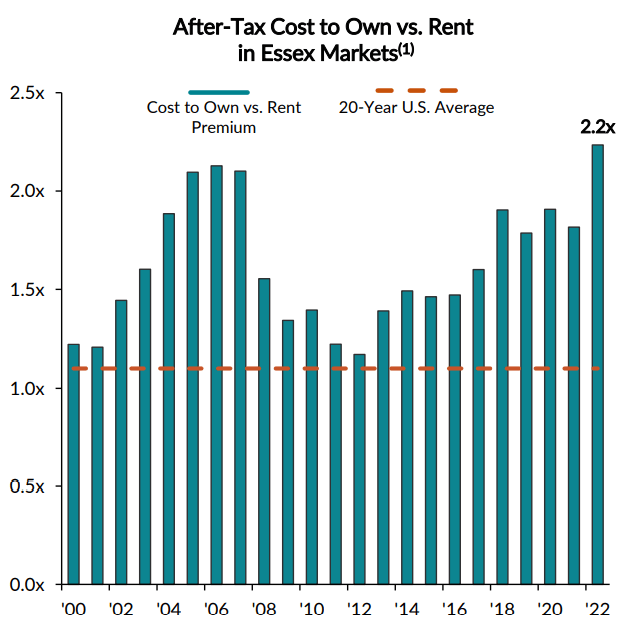
Essex is riding a wave of superior job growth in its West Coast markets, that started in the latter half of 2021, and continues to this day.
Company investor presentation
This is also reflected in the massive increase in job openings in the top 10 tech companies California and Washington. Prior to the pandemic, this was running between 25,000 and 30,000. COVID cut that to less than 20,000. By May of this year, it was over 50,000.
Company investor presentation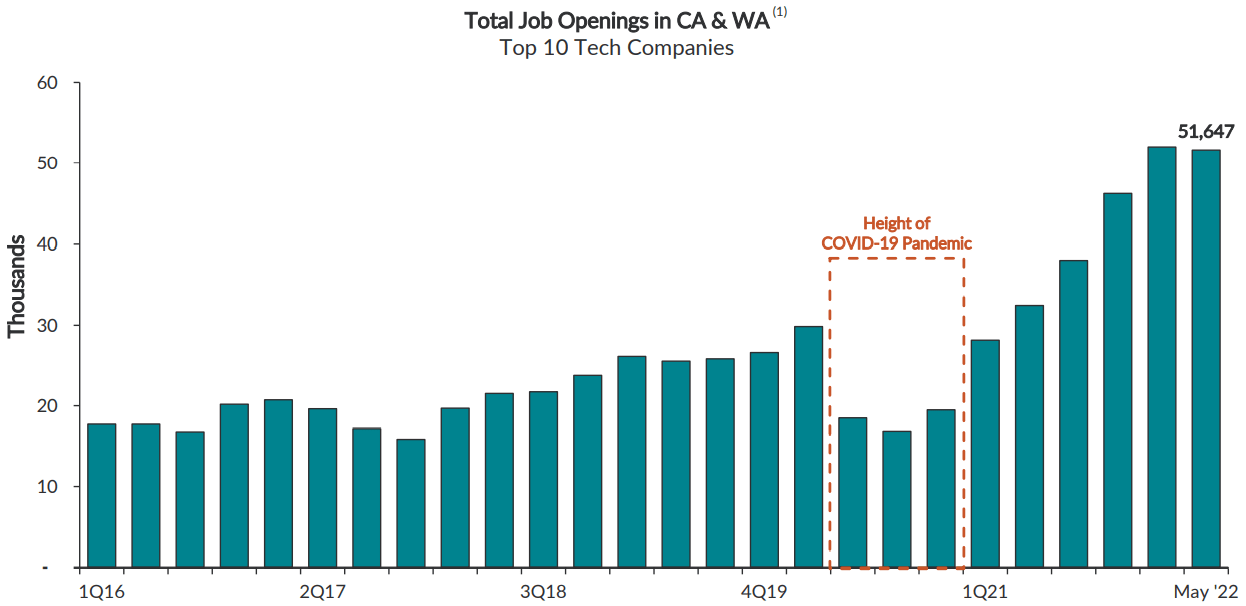
Quarterly Results
Essex beat expectations and raised guidance in Q1 2022. Here are the highlights for Q2, reported July 26:
- FFO was up 1.3% QoQ (quarter-over-quarter), and 2.5% YoY.
- Core FFO was up a whopping 21.1% QoQ and 15.4% YoY.
- Net income declined 13.0% QoQ, and 44.3% YoY, mostly because of unrealized losses on “non-core co-investments” the company made.
Company Q2 2022 earnings release
- Same-property revenues rose 4.8% QoQ and 12.7% YoY
- Same-property NOI (net operating income) rose 8.0% QoQ, and 16.7% YoY
- Same-store gains were shared by all three Essex regions, but the biggest gain was in the biggest segment, Southern California, at 14.5%.
Company Q2 earnings release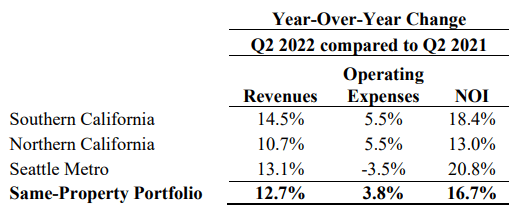
- Each and every one of Essex’ markets saw significant same-store gains, but they were heaviest in Los Angeles County, with 18.8%.
Company Q2 earnings release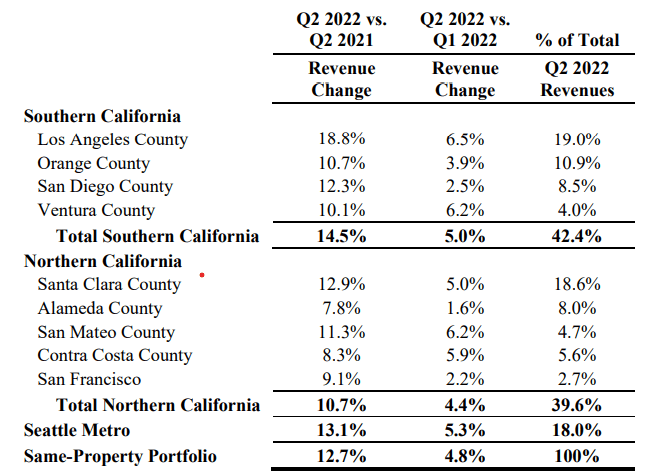
- This happened in spite of slightly lower occupancy.
Company Q2 earnings release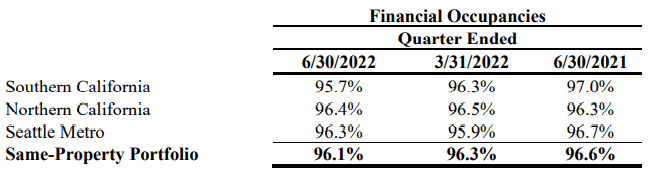
- That can only mean leasing spreads were very favorable. In fact, net effective rents have increased between 18% and 20% year-to-date, according to CEO Michael Schall, on the earnings call, with Q3 renewals coming in at about 10%.
- Loss-to-lease stands at 10.3% and growing.
- The company raised full-year guidance for full-year Core FFO by 2%, to $14.45 at the midpoint.
- The company also raised full-year guidance for full-year NOI by 1.4%, to 13.5% at the midpoint.
- It was not a pure beat-and-raise, however, because Essex also lowered its guidance for full-year net income and total FFO, due primarily to the unrealized losses on their investments in Q2. (I would love to know what they invested in, that lost that much money, wouldn’t you? Unfortunately, none of the analysts on the earnings call asked that question.)
- The company also trimmed back their planned acquisitions for H2 2022 by a whopping $275 million (45% decrease), their targeted dispositions by $50 million (25% decrease), and their planned preferred equity redemptions by $25 million (10% decrease).
Company Q2 2022 earnings release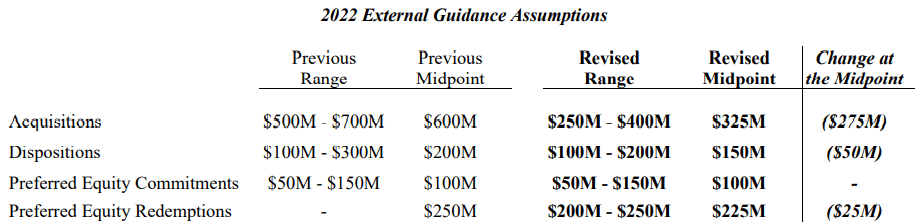
- Essex repurchased 219,000 shares of common stock totaling $60.8 million, at an average of $277.81 per share. (ESS still has $153.6 million in purchase authority remaining, but CFO Barbara Pak said any cash for buying back more shares would come from dispositions only, and those plans have been trimmed back, as shown in the figure above.)
- Essex completed stabilization of a 107-unit apartment complex in San Mateo.
Growth metrics
Here are the 3-year growth figures for FFO (funds from operations), TCFO (total cash from operations), and market cap.
| Metric | 2019 | 2020 | 2021 | 2022* | 3-year CAGR |
| FFO (millions) | $936 | $865 | $941 | $877 | — |
| FFO Growth % | — | (-7.6) | 8.8 | (-6.8) | (-2.15)% |
| FFO per share | $13.38 | $12.82 | $12.49 | $14.45 | — |
| FFO per share growth % | — | (-4.2) | (-2.6) | 15.7 | 2.60% |
| TCFO (millions) | $919 | $803 | $905 | $1,020 | — |
| TCFO Growth % | — | (-12.4) | 12.7 | 12.7 | 3.54% |
*Projected, based on H1 2022 results
Source: TD Ameritrade, CompaniesMarketCap.com, and author calculations
As you can see, COVID dealt a blow to ESS in all three metrics above, but it bounced right back in 2021, and FFO per share and TCFO are growing rapidly this year, despite a drop-off in FFO, which reflects the share buybacks. ESS is the picture of stability in these numbers.
Meanwhile, here is how the stock price has done over the past 3 twelve-month periods, compared to the REIT average as represented by the Vanguard Real Estate ETF (VNQ).
| Metric | 2019 | 2020 | 2021 | 2022 | 3-yr CAGR |
| ESS share price Aug. 18 | $314.72 | $218.73 | $316.07 | $293.29 | — |
| ESS share price Gain % | — | (-30.5) | 44.5 | (-7.2) | (-2.32)% |
| VNQ share price Aug. 18 | $91.18 | $81.42 | $105.55 | $100.58 | — |
| VNQ share price Gain % | — | (-10.7) | 29.6 | (-4.7) | 3.32% |
Source: MarketWatch.com and author calculations
Here again, COVID delivered a gut punch, and ESS share price bounced right back the next year, before selling off again this year. All in all, ESS shares have declined an average of (-2.32)% over the past 3 years, compared to the mediocre 3.32% gain posted by the VNQ. Thus ESS shares have underperformed, and after dividends are figured in, investors have gotten essentially a wash.
Balance sheet metrics
ESS has a strong, conservatively-managed balance sheet that is bond rated, and the company maintains more liquidity than most Apartment REITs. The Debt/EBITDA of 5.8x is considerably improved from 6.5 in Q1 2022.
| Company | Liquidity Ratio | Debt Ratio | Debt/EBITDA | Bond Rating |
| ESS | 1.93 | 22% | 5.8 | BBB+ |
Source: Hoya Capital Income Builder, TD Ameritrade, and author calculations
ESS has approximately $1.3 billion in liquidity, including cash, undrawn capacity on its unsecured credit facilities, and marketable securities (which are evidently worth a lot less than they were three months ago).
Company investor presentation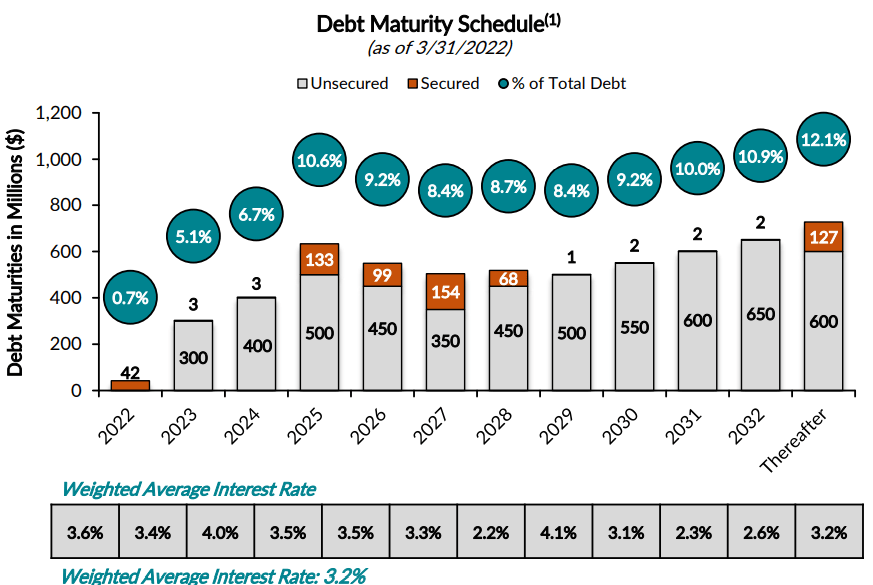
Less than 6% of ESS debt matures annually for the next 2 and a half years, as the company faces only $300 million of repayments in 2023 and $400 million in 2024. Afterward, maturities average close to 10% of total debt for the next 8 years. The weighted average interest rate on Essex’ $6 billion debt is nice and low, at 3.2%.
Dividend metrics
With an unbroken streak of 28 consecutive years of dividend growth, ESS ranks as a Dividend Aristocrat, but the rate of dividend growth is less than the average REIT, so that is a bit overblown. Like most Apartment REITs, ESS pays a lower current Yield than the typical REIT.
| Company | Div. Yield | 3-yr Div. Growth | Div. Score | Payout | Div. Safety |
| ESS | 2.96% | 4.1% | 3.21 | 60% | B |
Source: Hoya Capital Income Builder, TD Ameritrade, Seeking Alpha Premium
Dividend Score projects the Yield three years from now, on shares bought today, assuming the Dividend Growth rate remains unchanged.
Valuation metrics
ESS is priced right down the middle, just a hair less than the average REIT, and trades at a slightly larger than average discount to NAV. Nothing to get a value investor excited, and nothing to scare a growth investor away.
| Company | Div. Score | Price/FFO ’22 | Premium to NAV |
| ESS | 3.21 | 19.0 | (-8.9)% |
Source: Hoya Capital Income Builder, TD Ameritrade, and author calculations
What could go wrong?
Fundamental research from our data analytics team indicates job openings at the largest technology companies have moderated recently off the very high levels throughout the pandemic, with job openings now about 15% above pre-COVID levels compared to about 77% last quarter.
Senior Executive VP and Chief Operating Officer Angela Kleiman added,
We . . . anticipated a deceleration in market rent growth in the second half of the year . . . As expected, we are seeing this deceleration show up on our new lease spreads.
Company investor presentation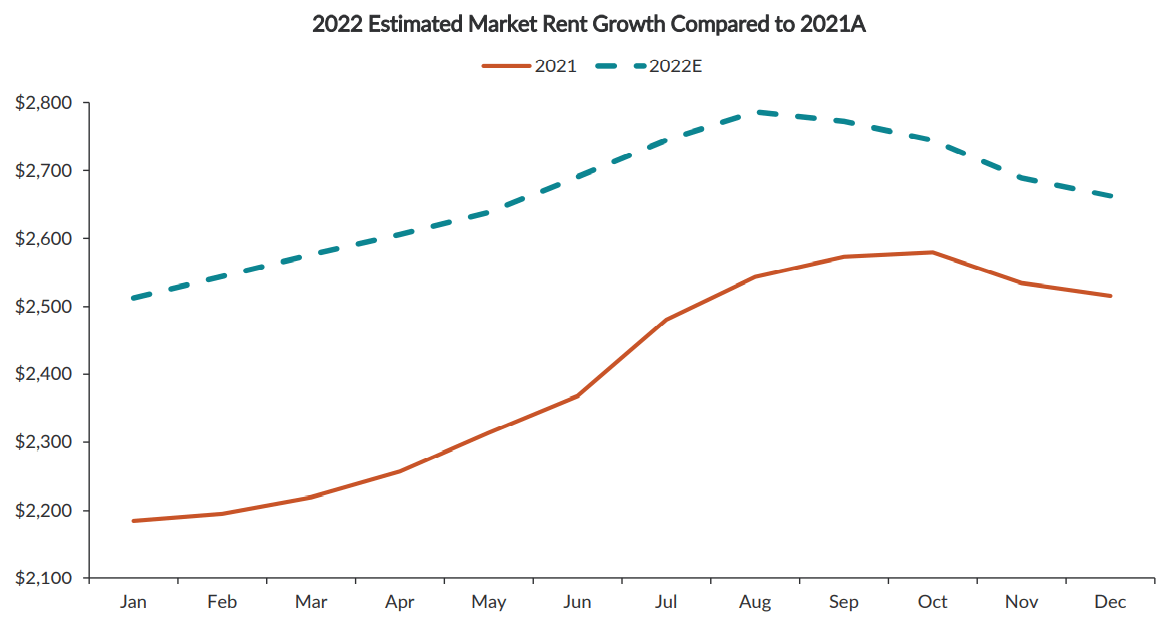
The company has clearly made some questionable investments in Q2, that affect their expansion plans going forward. The lack of information on the nature of those investments gives no assurance the company will avoid further missteps in the future.
Investor’s bottom line
ESS is the picture of stability, with its conservative balance sheet, slow growth rates, consistent modest dividend increases, and eminently fair valuation. It is practically the definition of a Hold, despite two consecutive beat-and-raise quarters.
The Seeking Alpha Quant ratings agree, as do The Street and Ford Equity Research, but 13 of the 25 Wall Street analysts that cover ESS consider it a Buy or Strong Buy, and so does Zacks. The average analyst price target is $311.87, implying just 6.3% upside.
Seeking Alpha Premium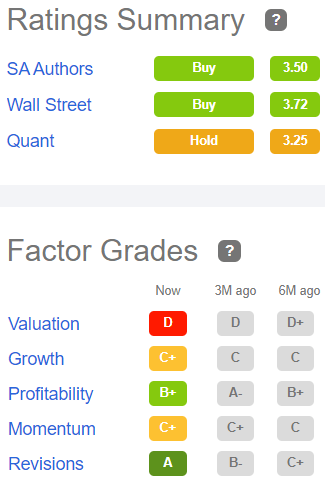
Your move, as always.
Be the first to comment