

Pgiam/iStock via Getty Images
Investment Thesis
The reason individual do-it-yourself [DIY] investors do poorly with stock investments is that many (most?) of them only pay attention at the wrong time, selling when prices are depressed and buying when it looks like the “good ones” are getting away in increased price without them (Fear of Missing Out).
If the DIYs can control their emotions for a change, now is a good time to turn those practices around and follow the instincts (and experiences) of the professionals.
What do Investing Professionals Expect Today?
Every market day since the turn of this Y2K century over 20 years ago we have examined carefully and thoroughly the impact on equity markets imposed by the actions of the pros. Being close to the transaction centers and in continuing active contact with daily transactions and information flows, their expectations tend to be more profitable than not. Their firms tend to employ the best educated, informed, and evenly motivated market participants.
Their investing actions tell what their expectations are for coming equity prices over the next few months. That is what we keep score on when questions arise of “the market’s” current pricey-ness.
Yesterday’s (6/16/2022) evaluation of over 3,000 actively-traded and widely-held stocks, ETFs, REITs, and Indexes is instructive because it indicates that equity markets are at a relatively low level and average Reward-to-Risk levels appear attractive to additional capital investment.
Here is how they look across a continuum of Reward to Risk ratios.
The scale at the bottom of the picture is of that percentage of the full price-expectations range which is to the downside, between the current market price and the forecast’s lower limit. The upside is the complement (or 100% minus scale%) to the downside. Examples appear in the bullet-points above.
Figure 1
blockdesk.com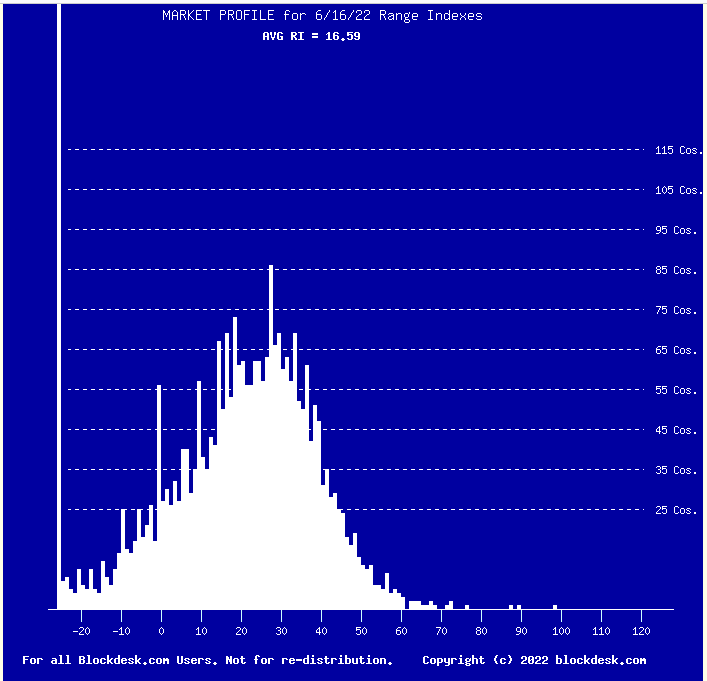
Used with permission
The little square white blocks on the right-hand side of the bottom scale are of individual securities and piled up on one another in columns they make up the remainder of the picture.
No, that tower at the extreme left is not a border-frame for the picture, it is the white blocks of over 115 securities so depressed in price relative to forecast expectations of the pros that they fall off the left extreme of the scale. Can you say “screaming cheap?”
Now, is this a picture of staggering opportunity, or just another piece of bait to depress DIY investors into thinking that things could get even worse? Figure 2 offers some prior extremes.
Figure 2
blockdesk.com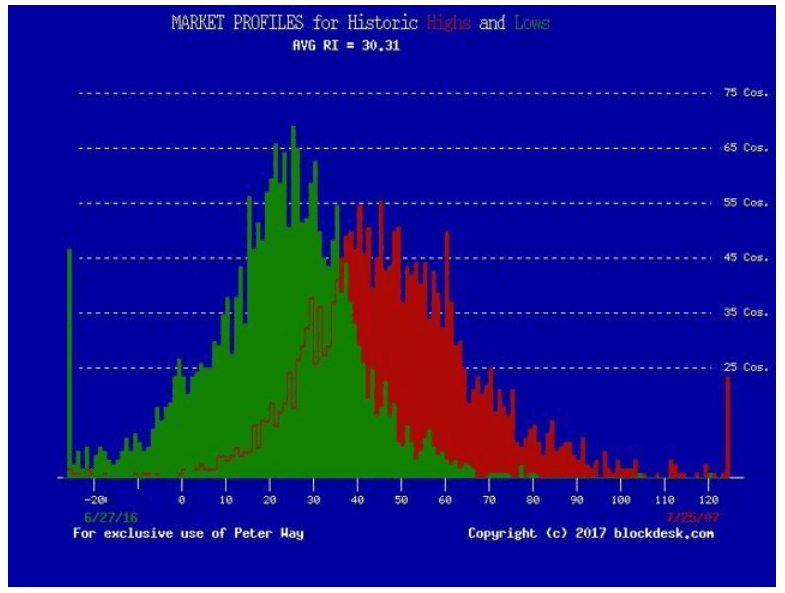
(used with permission)
The dates of forecasts in these distributions are of 6/27/2016 for the market low, and July of 2007 for the high.
Today’s Market Profile is clearly a more extreme set of price recovery expectations than in 2016, where the market price of the S&P 500 index ETF (SPY) rose from just below 200 to a peak of 477 at year-end 2021.
Conclusion
The difference between Reward-Risk forecast market measures and past history measures is in their forecast horizons. The Market Profile draws from derivatives which look only a few months into the future, which provides benefits from repeated actions. Past history market index measures can only act as an after-the fact confirmation of a longer continuing trend of growth, if that is what happens. The ability to avoid long-term capital losses is foregone, with the time consumed never replaceable.
Buy&hold passive strategy investors may take solace in those hindsight reassurances but are left victim of whatever occurs, while active-strategy investors have the advantage of tailoring actions to most productive courses of subsequent outcomes. In this century’s more volatile surroundings guided flexibility can produce substantial wealth-building.
Be the first to comment