

arild lilleboe/iStock Editorial via Getty Images
Introduction
The Norwegian-based Equinor ASA (NYSE:EQNR) reported its fourth quarter 2021 results on February 9, 2022.
1 – 4Q21 and full-year 2021 Snapshot
Equinor reported strong fourth quarter results on February 9, 2022. Higher commodity prices and an increased contribution from the Martin Linge oil field boosted the company’s fourth quarter performance. It was another great quarter.
EQNR: 4Q21 Financial results Presentation (Equinor ASA)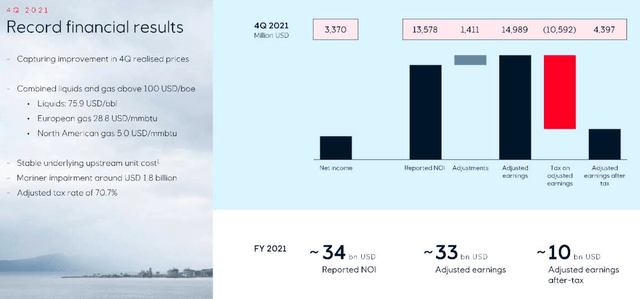
Equinor generated $5.925 billion in free cash flow this quarter. After the significant revenues and cash flow, Equinor announced the increase of its share buyback program to up to $5 billion.
The company is also making significant progress on the debt front and is now virtually net debt-free.
Feeling confident again with the increase in commodity prices and ongoing recovery, Equinor’s Board of Directors proposed a quarterly dividend of $0.20 per share and added an extra $0.20 per share.
The integrated company is primarily an oil and gas producer with a robust crude oil segment, as we can see below:
EQNR: Chart Quarterly Revenue per segment 3Q versus 4Q (Fun Trading)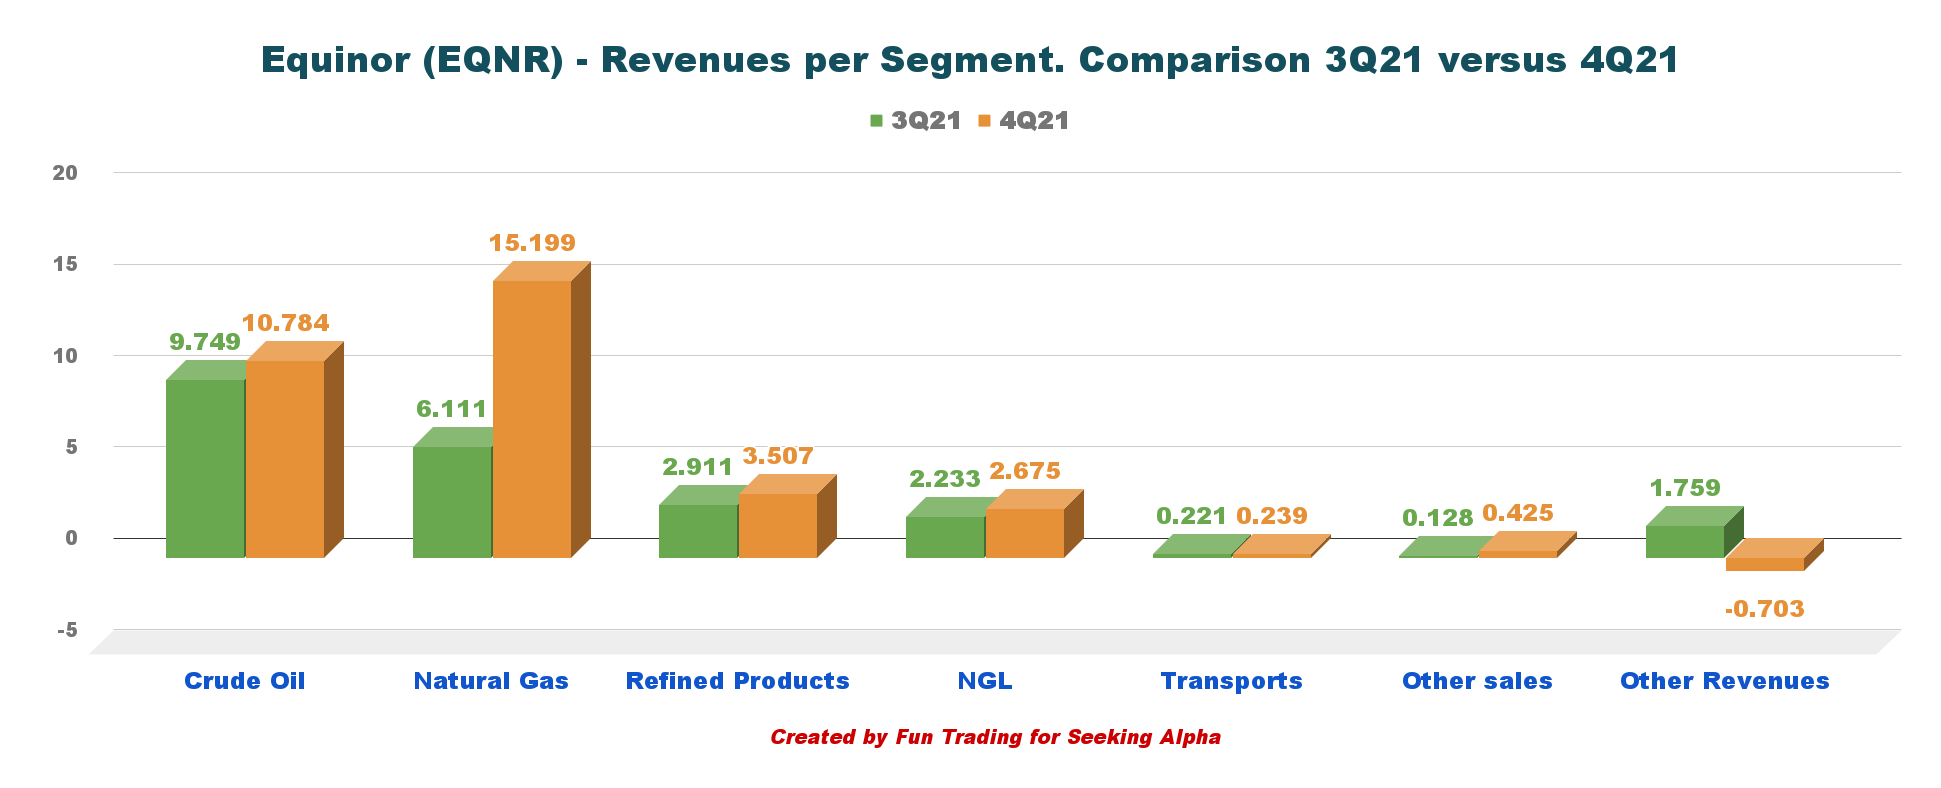
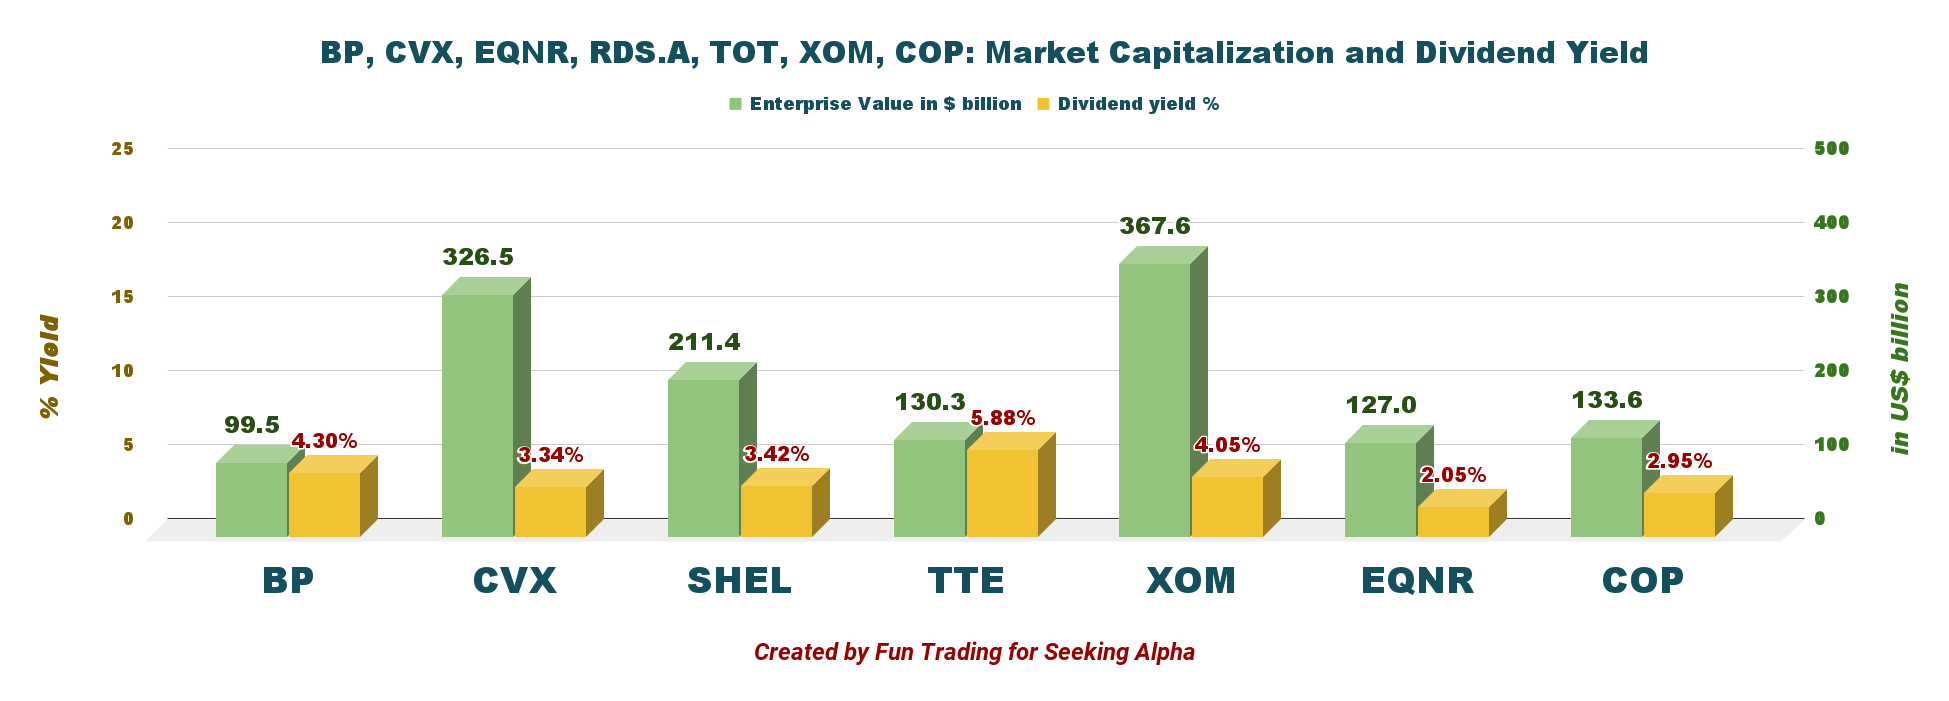
2 – EQNR compared to its peers
Equinor is one of the smallest in terms of market cap amongst its peers and pays a low dividend with a withholding tax of 25%, limiting its attractiveness for dividend-oriented investors. However, with the extra $0.20 per share, the dividend yield is now 4.10%.
EQNR: Chart comparison dividend (Fun Trading)
CEO Anders Opedal said in the conference call:
Our strong operational performance lay the foundation for our financial results in 2021, both for earnings after tax and cashflow are very strong. We reduced the unplanned losses on our producing assets by almost 30% compared to the five-year average. In eight months, last year, Johan Sverdrup achieved nearly 100% production efficiency and delivered 230,000 barrels per day to Equinor. Strong operations, new wells and fields on stream, and optimized gas production increased our production by more than 3% above the 2% expected for the year. We achieved adjusted earnings of $10 billion after tax.
3 – Investment Thesis
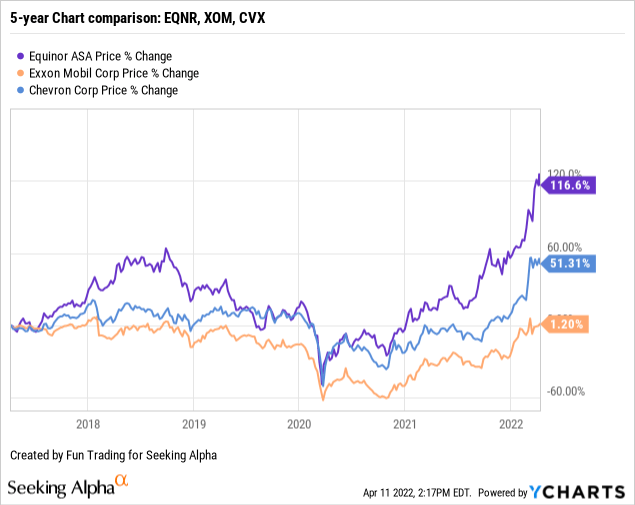
I consider EQNR a long-term investment in the oil industry. It is a reliable investment based on a long-term viewpoint. EQNR’s long-term performance shows that it outperforms its US peers with a 117% increase over the past five years.
Thus, I believe long-term investors should continue accumulating this cyclical stock on any weakness. But, due to extreme volatility in the oil industry, I recommend short-term trading LIFO, a portion of your long-term position. I believe 30-40% should be allocated for this task to minimize the risks of a sudden negative and unsuspected downturn and profit from the volatility.
Balance Sheet And Production 4Q21: The Raw Numbers
| Equinor | 4Q20 | 1Q21 | 2Q21 | 3Q21 | 4Q21 |
| Revenues in $ billion | 11.88 | 16.13 | 17.38 | 23.11 | 32.13 |
| Total Revenues and others in $ billion | 11.75 | 17.59 | 17.46 | 23.26 | 32.61 |
| Net Income in $ million | -2,421 | 1,851 | 1,938 | 1,406 | 3,368 |
| EBITDA $ billion | 2.404 | 7.622 | 7.320 | 11.37 | 17.76 |
| EPS diluted in $/share | -0.75 | 0.57 | 0.60 | 0.43 | 1.03 |
| Cash from operating activities in $ billion | 2.34 | 5.98 | 6.64 | 8.04 | 8.15 |
| Capital Expenditure in $ billion | 2.50 | 2.15 | 1.75 | 1.92 | 2.23 |
| Free Cash Flow in $ million | -0.161 | 3.83 | 4.90 | 6.12 | 5.93 |
| Total cash $ billion | 17.62 | 19.91 | 25.06 | 28.85 | 33.28 |
| Long-term debt (+liabilities) in $ billion | 38.12 | 34.91 | 35.48 | 30.80 | 32.68 |
| Dividend per share in $ per share | 0.12 | 0.15 | 0.18 | 0.18 | 0.20 (+0.20 extra) |
| Shares outstanding (diluted) in billion | 3.257 | 3.256 | 3.257 | 3.255 | 3.248 |
| Oil Production | 4Q20 | 1Q21 | 2Q21 | 3Q21 | 4Q21 |
| Oil Equivalent Production in K Boepd | 2,043 | 2,168 | 1,997 | 1,994 | 2,158 |
| Group average oil price ($/b) | 40.6 | 56.4 | 63.7 | 69.2 | 75.9 |
Courtesy: Company 2021 Press release
Financials: Revenues, Free Cash Flow, Debt, And Production
1 – Revenues and others were $32.61 billion in 4Q21
EQNR: Chart Quarterly Revenues history (Fun Trading)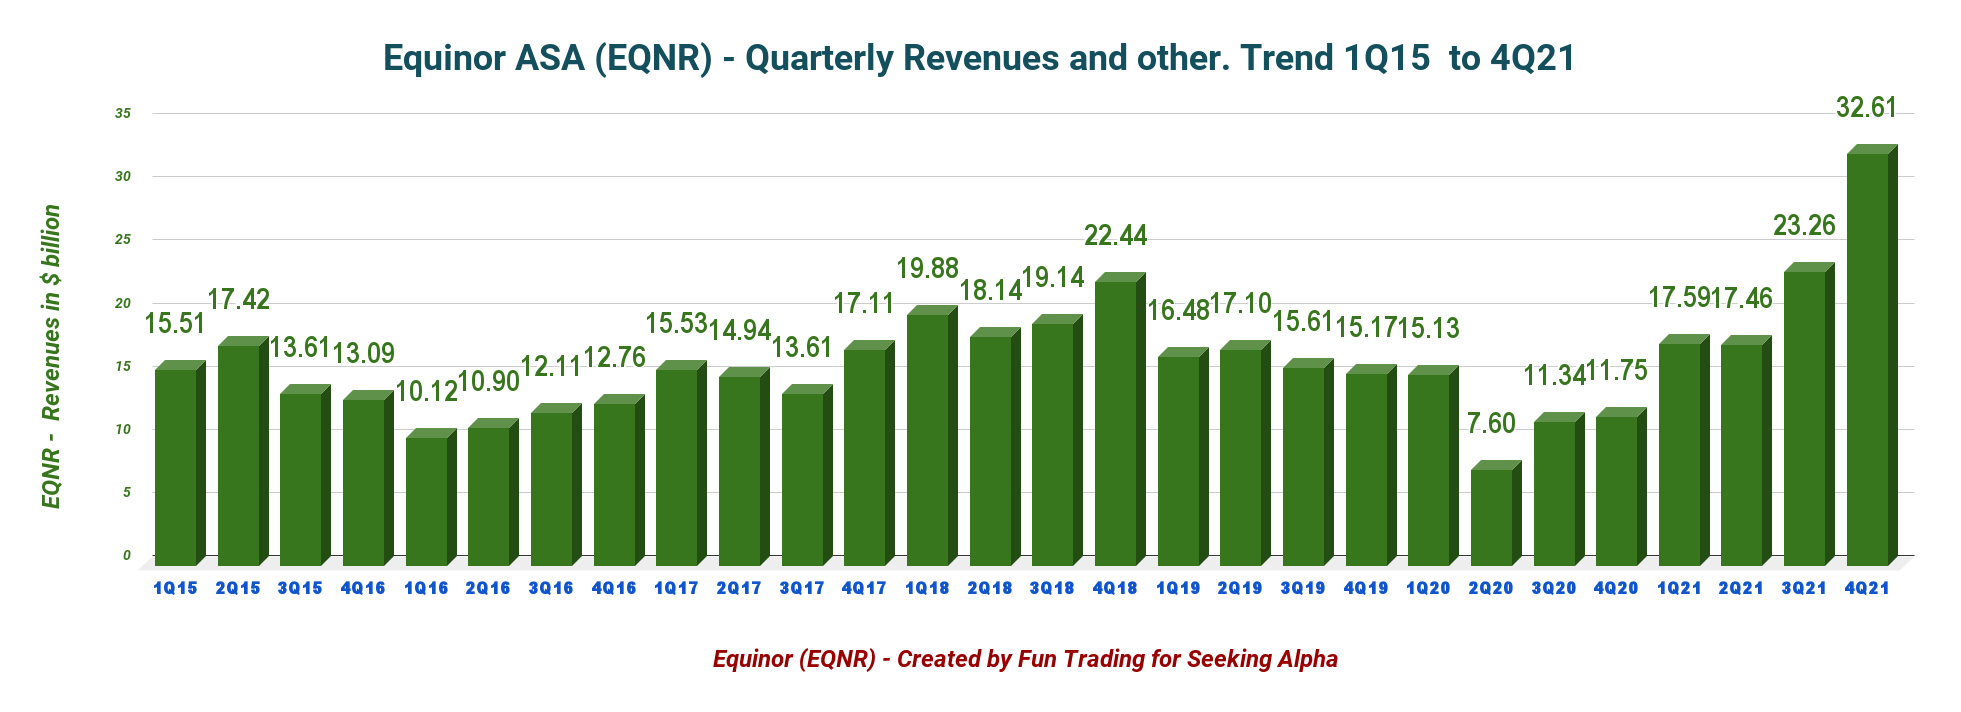
EQNR reported fourth quarter 2021 on February 9, 2022. Revenues and others were $32.608 billion, up from $11.746 billion the same quarter a year ago and up 40.2% sequentially (please look at the graph above).
Net income was $3,368 million, or $1.03 per diluted share, up from a loss of $0.75 per diluted share in the same quarter last year.
After-tax, the adjusted earnings were $4,397 million in the fourth quarter, up from a loss of $554 million in the same period in 2020.
Higher prices for liquids boosted the earnings this quarter. Details per segment are presented below:
EQNR: Table Earnings details 4Q21 and Y21 (Equinor ASA)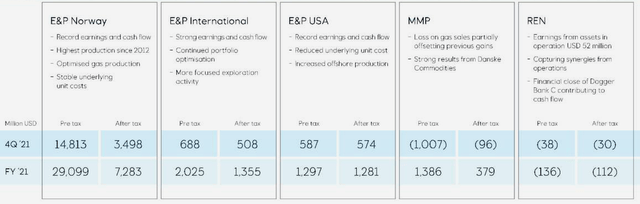
1.1 – Exploration & Production Norway (E&P Norway)
The adjusted earnings were $14,813 million, up from a profit of $1,841 million last year. This year’s increase was due to higher production and liquid prices. The company’s average daily liquids and gas production increased 12% year over year to 1,469K Boepd due to ramping up operations at the new field Martin Linge.
1.2 – E&P International
The adjusted operating profit was $688 million, compared to the year-ago quarter loss of $1,215 million. Liquids and gas prices boosted upstream activities. The company’s average daily equity production of liquids and gas was stale to 339K Boepd from 340K Boepd last year. An increase in output from Russian fields helped the segment.
Note: On February 28, 2022, Equinor announced that it started exiting its Russian JV.
At the end of 2021 Equinor had USD 1.2 billion in non-current assets in Russia. We expect that the decision to start the process of exiting Joint Ventures in Russia will impact the book value of Equinor’s Russian assets and lead to impairments.
1.3 – E&P USA
The adjusted quarterly income was $587 million, compared to a loss of $172 million last year. Oil and price contributed to the outperformance. More potent liquids and gas prices were helping this quarter.
Equinor’s average equity production of liquids and gas was 350K Boepd, down from 390K Boepd last year due to the divestment of unconventional U.S. onshore assets.
1.4 – Marketing, Midstream & Processing (“MMP”)
The adjusted loss was $1,007 million, down significantly from $352 million a year ago.
1.5 – Renewables
The segment’s adjusted loss was $38 million from a loss of $59 million a year ago. Lower expenses associated with the Beacon Wind and Empire Wind properties helped the segment.
1.6 – 4Q21 prices realized
Equinor’s realized price for liquids was $75.9 per barrel during the fourth quarter of 2021. The price realized increased significantly from last year’s $40.6. A massive improvement in this segment.
In the fourth quarter, the average European invoiced gas price was $28.76 per million Btu for Europe and $4.97 for North America, up from $5.04 and $1.99 a year ago. It was a massive improvement here as well.
EQNR: Chart Quarterly Oil prices history (Fun Trading)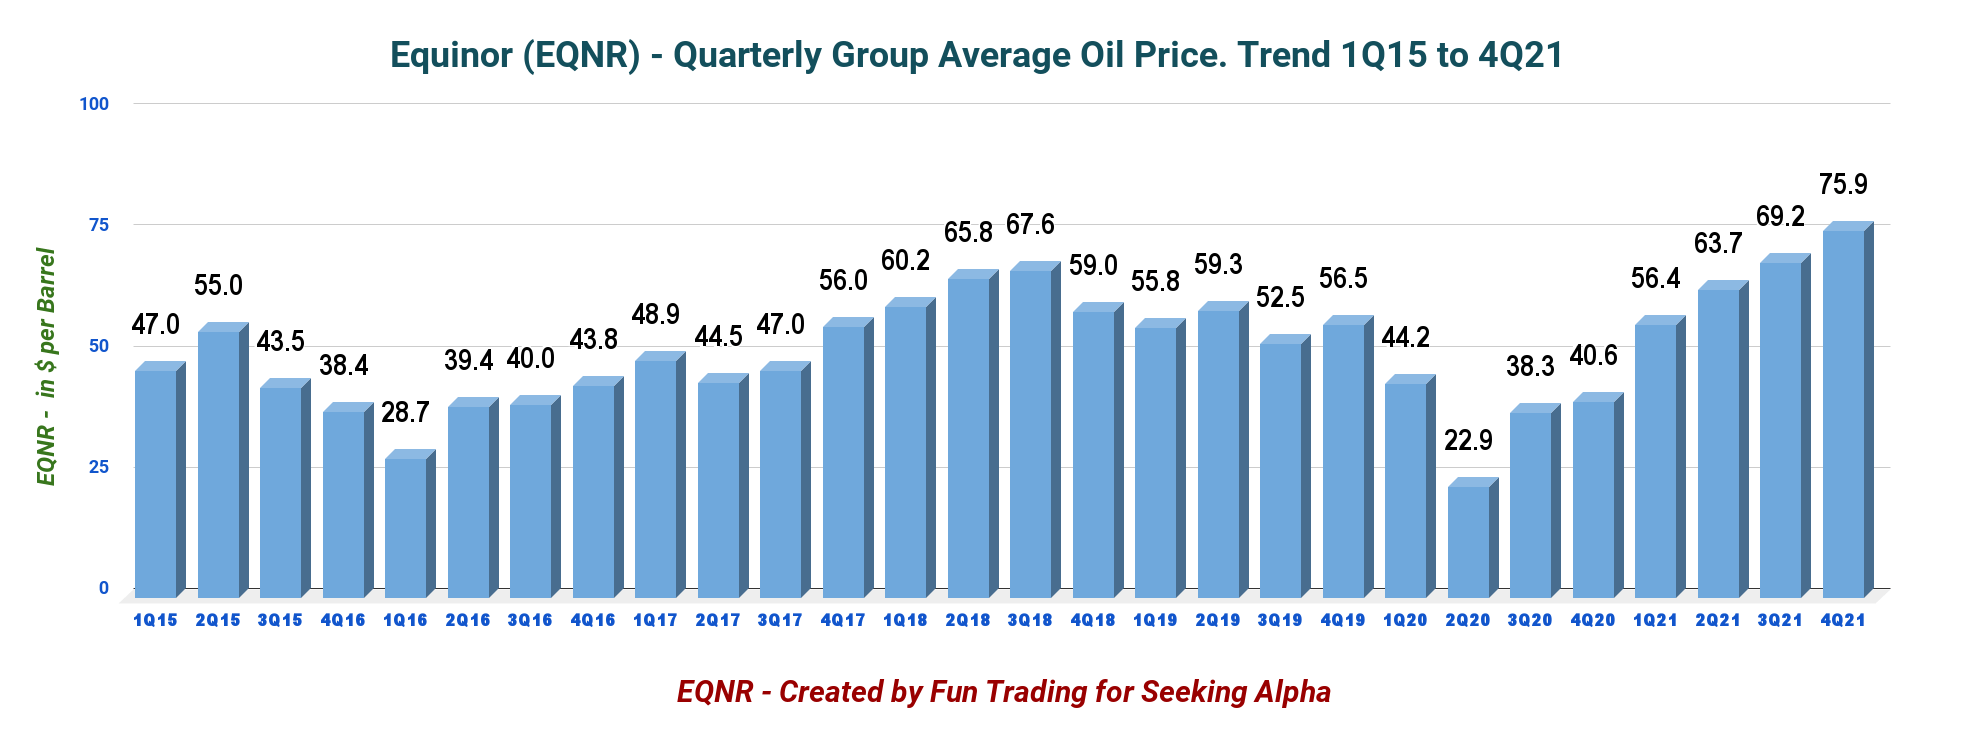
Cash from operating activities was a new record of $8.15 billion in 4Q21.
EQNR: Quarterly cash from operations history (Fun Trading)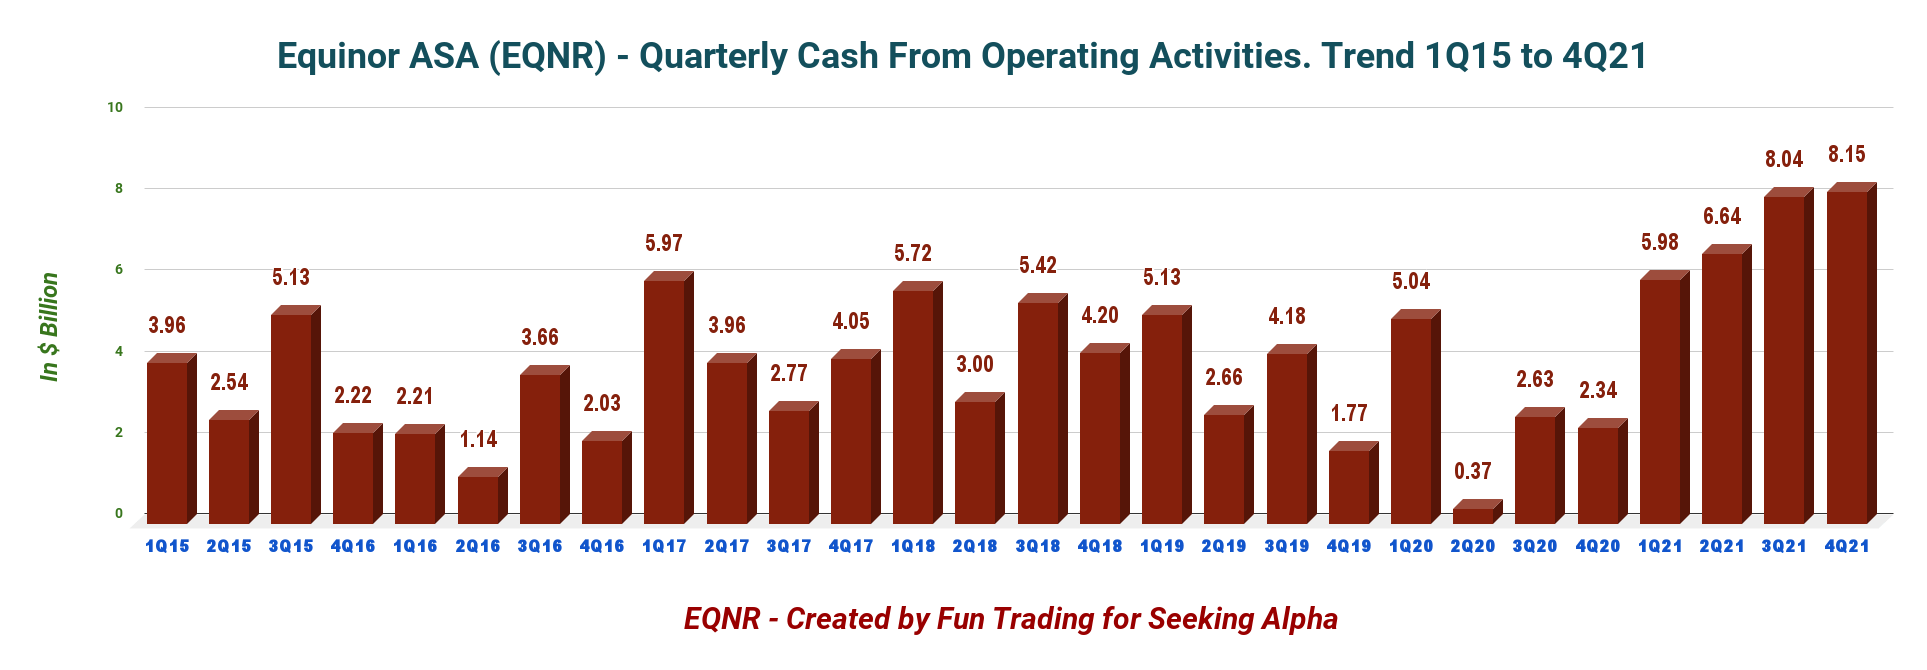
2 – 2022 Guidance and Outlook
Organic CapEx is estimated at an annual average of $10 billion for 2022-2023, increasing to $12 billion in 2024-2025.
Equinor reaffirmed production growth expectations at 2% for 2022.
EQNR: Presentation 2022 Outlook (Equinor ASA)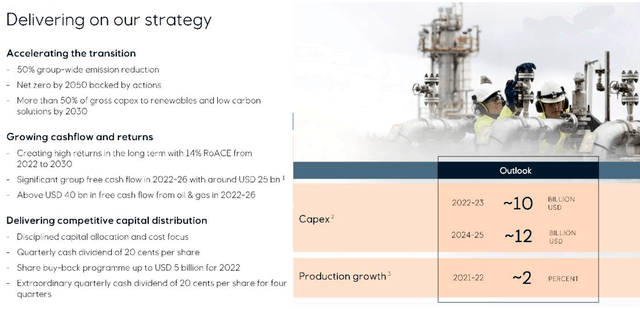
CFO Ulrica Fearn said in the conference call:
Our oil and gas production outlook reflects Equinor’s commitment to supply energy for society towards 2030 and simultaneously aim to reduce our emission by 50% over that period. In 2021, the CO2 intensity was 7 kilos per BOE, which continues to be well below half of the industry average. Our oil and gas portfolio is cash flow positive at prices around $30 per barrel after investments, and this ensures resilience through the cycles. This portfolio is expected to generate over $40 billion of free cash flow over the next five years. I also want to highlight Equinor’s commitment to securing gas supplies to the – from the NCS to Europe, and we expect to produce more than 40 BCM annually towards 2026.
3 – Free Cash Flow was a record of $5,925 million in 4Q21
EQNR: Chart Quarterly Free Cash Flow history (Fun Trading)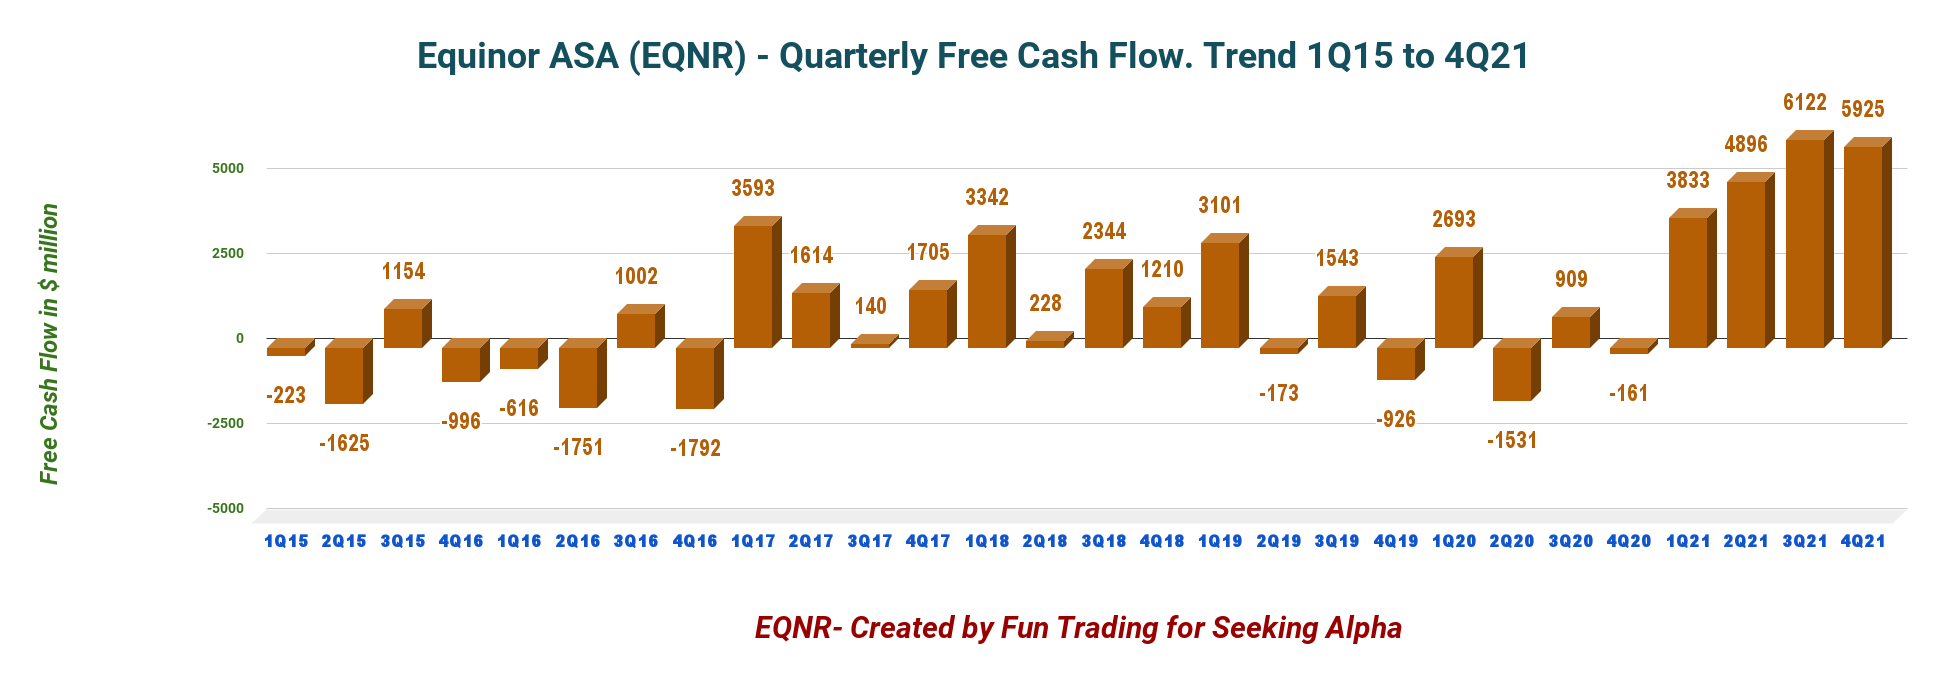
Note: I use the generic free cash flow, not including divestitures. It is the cash flow from operations minus CapEx. The company has a different way of calculating the free cash flow.
The company’s free cash flow was $5,925 million in the fourth quarter of 2021, or a trailing 12-month free cash flow of $20,776 million.
Equinor announced a quarterly dividend of $0.20 per share, 11.1% higher than the prior dividend of $0.18. Also, its board declared a special quarterly cash dividend of $0.20 per share for fourth quarter 2021 and the first three quarters of 2022.
4 – No more Net Debt in 4Q21
EQNR: Chart Quarterly Cash versus Debt history (Fun Trading)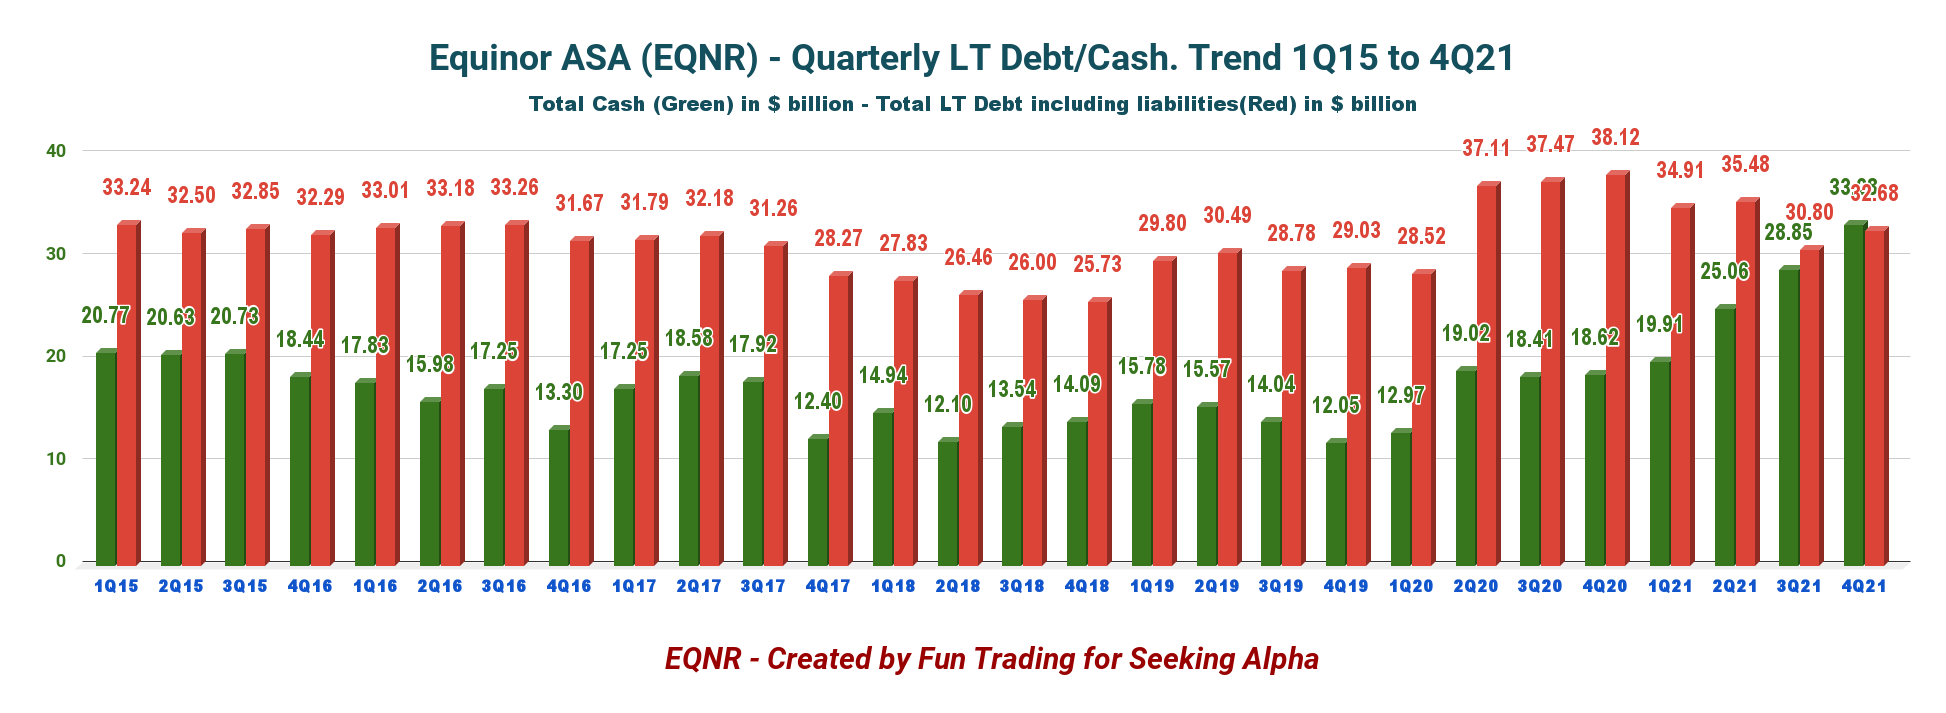
Note: The debt indicated above in the graph is the gross interest-bearing debt plus liabilities.
As of December 31, 2021, Equinor reported $33.279 billion in cash, cash equivalents, and securities. The company’s long-term debt amounted to $32.677 billion at the quarter-end.
The debt-to-equity ratio is relatively high now at 0.838.
5 – Production Upstream and Investment in Renewables
5.1 – Oil Equivalent Production
EQNR: Chart Quarterly Oil equivalent production history (Fun Trading)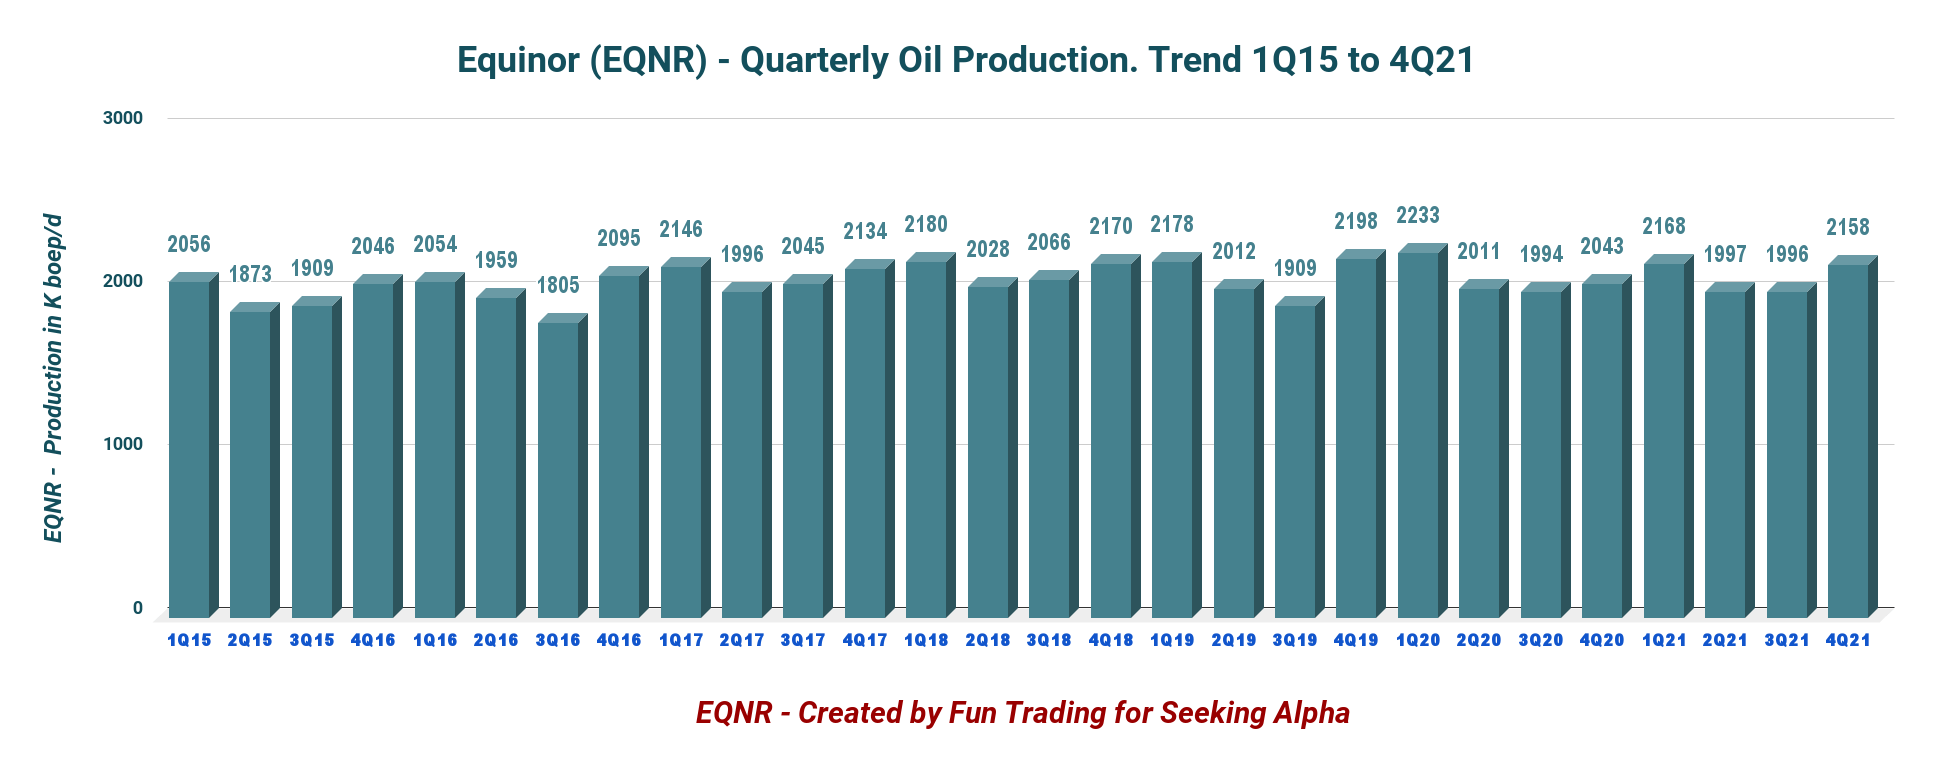
- The fourth quarter production was 2,158K Boepd, up from 2,043K Boepd in the same period in 2020 and up 8.1% sequentially.
- Equinor share for power generation was 526 GWh this quarter, up from 480 GWh last year.
EQNR: Production repartition Presentation (Equinor ASA)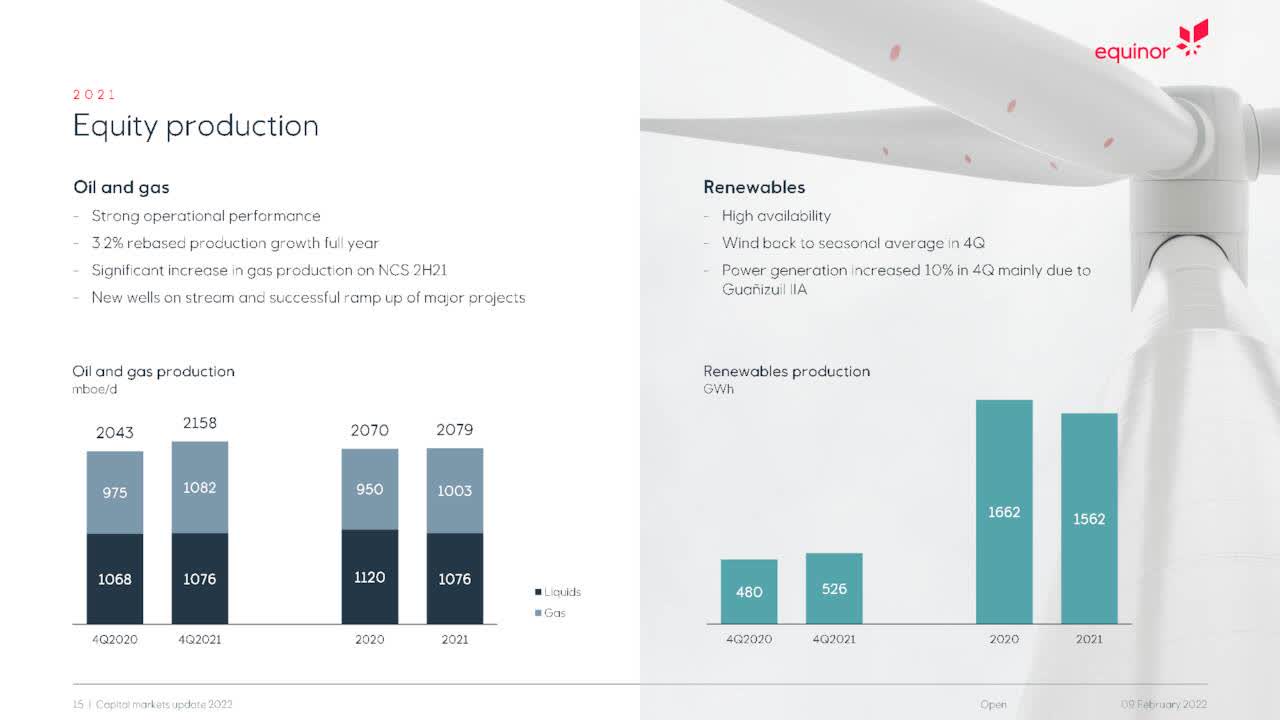
The company indicated a significant increase in gas production in NCS H2 2021 with 813K Boepd in E&P Norway equity gas production.
5.2 – 2021 Reserves down 9.3% year over year
EQNR: 2021 Reserves Presentation (Equinor ASA)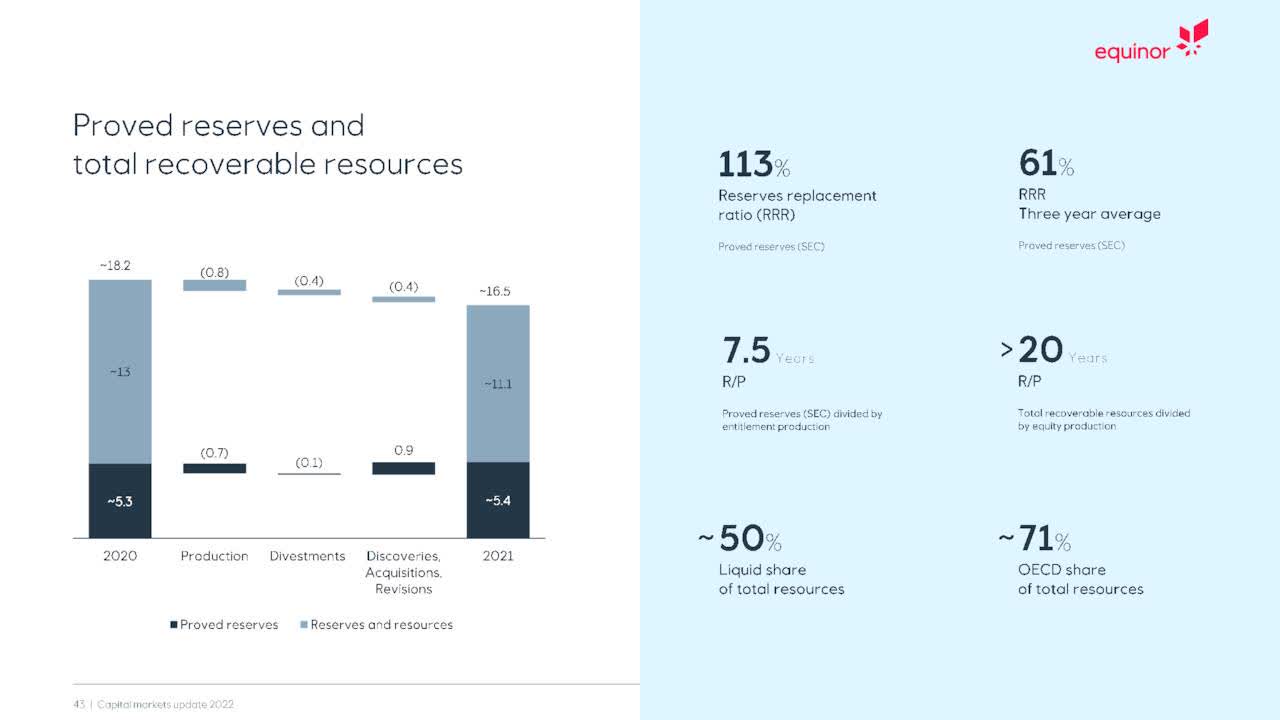
Technical Analysis And Commentary
EQNR: TA Chart short-term (Fun Trading)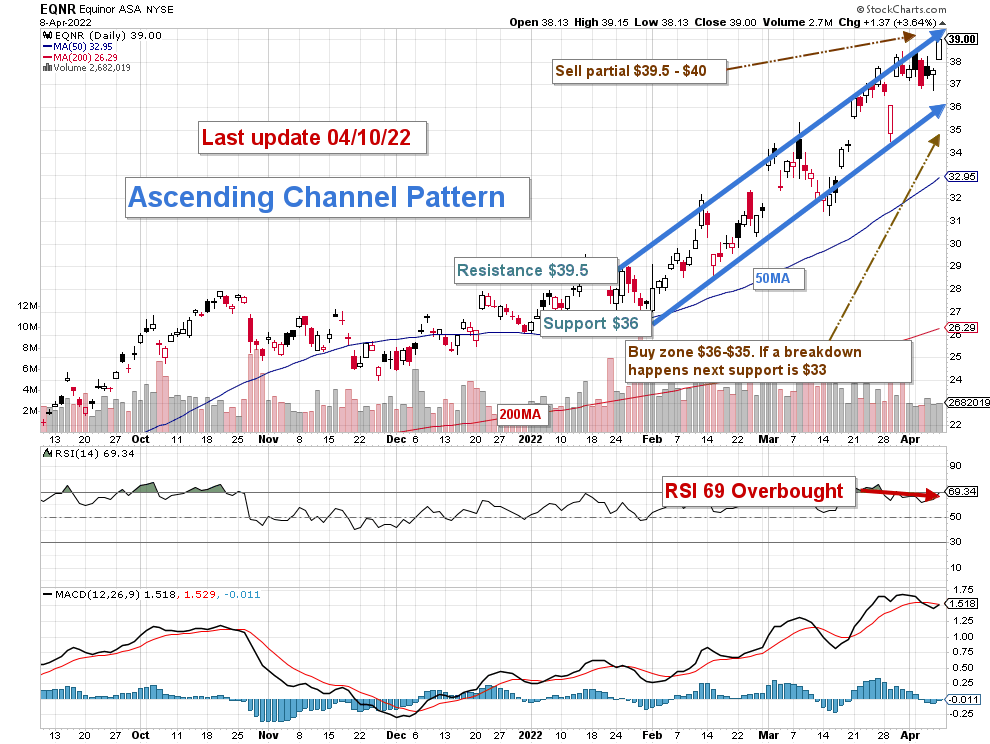
Note: The chart is adjusted for the dividend.
EQNR forms an ascending channel pattern with resistance at $39.5 and support at $36. The stock has had a substantial run since early February.
The trading strategy is to sell about 30% or more at or above $39.5 and accumulate between $36.5 and $35.5. EQNR is highly correlated to oil prices, and any selling or buying decisions must factor in this critical component.
If oil prices keep trending up despite attempts from the USA and allies to reduce the pressure, EQNR could eventually cross $40, but it is not very likely at the moment. I believe oil prices are reaching an unsustainable valuation and should be retracing in the next few weeks due to a weakening of the world economy.
Hence, if oil prices lose momentum and drop at or below $90 per barrel, I see EQNR crossing the pattern support and retesting $31, which is safe to buy back again.
The best way to profit from your investment in EQNR is to trade LIFO while keeping a long-term position for a potential retest of $40s or higher. I suggest taking some time to understand how it works. Also, options trading could be an alternative to direct trading.
Warning: The TA chart must be updated frequently to be relevant. It is what I am doing in my stock tracker. The chart above has a possible validity of about a week. Remember, the TA chart is a tool only to help you adopt the right strategy. It is not a way to foresee the future. No one and nothing can.
Author’s note: If you find value in this article and would like to encourage such continued efforts, please click the “Like” button below as a vote of support. Thanks!
Be the first to comment