

Stasys Kudarauskas/iStock Editorial via Getty Images
Introduction
The Norwegian-based Equinor ASA (NYSE: NYSE:EQNR) reported its second quarter 2022 results on July 27, 2022.
Note: This article is an update of my article published on July 20, 2022. I have followed EQNR on Seeking Alpha since January 2017.
1 – 2Q’22 result Snapshot
Equinor reported strong second-quarter results. Earnings easily beat analysts’ expectations. Equinor generated $6.81 billion in generic free cash flow this quarter, and revenues were $36.46 billion, more than double the revenues of 2Q21 or $17.46 billion.
After posting significant revenues and cash flow, Equinor proposed a second tranche of the share buyback program of $1.83 billion this quarter and increased the share buy-back program for 2022 from previously communicated up to $5.00 billion to up to $6.00 billion.
In the press release:
The board of directors has decided a cash dividend of USD 0.20 per share for the second quarter. Based on continued strong earnings in the quarter the board of directors has decided an increase in extraordinary cash dividend from USD 0.20 to USD 0.50 per share for second and third quarter of 2022.
Furthermore, based on the strength of the brent price, balance sheet and commodity prices, the board of directors has decided to initiate a third tranche of share buy-back of USD 1.83 billion and increase the share buy-back programme for 2022 from previously communicated up to USD 5.00 billion to up to USD 6.00 billion. The third tranche will commence on 28 July and will end no later than 26 October 2022.
Also, due to the increase in commodity prices and ongoing recovery, Equinor’s Board of Directors proposed a quarterly dividend of $0.20 per share and added an extra $0.50 per share in 2Q22 for a total of $0.70 per share.
Equinor produced an 18% increase in Norwegian gas production in 2Q22 as part of its effort to help energy security in Europe. This significant production increase benefited EQNR, which sold its gas at $25.53 per million British thermal units.
The integrated company is primarily an oil and gas producer with a robust crude oil segment, as we can see below:
EQNR Quarterly Revenue per segment 1Q22 versus 2Q22 (Fun Trading) In short, Equinor is the perfect play in the natural gas segment due to its strategic location. The company is well positioned to profit from the situation created by the conflict in Ukraine, which cut the gas flow from Russia to Europe. A long-term investment in this company is imperative. 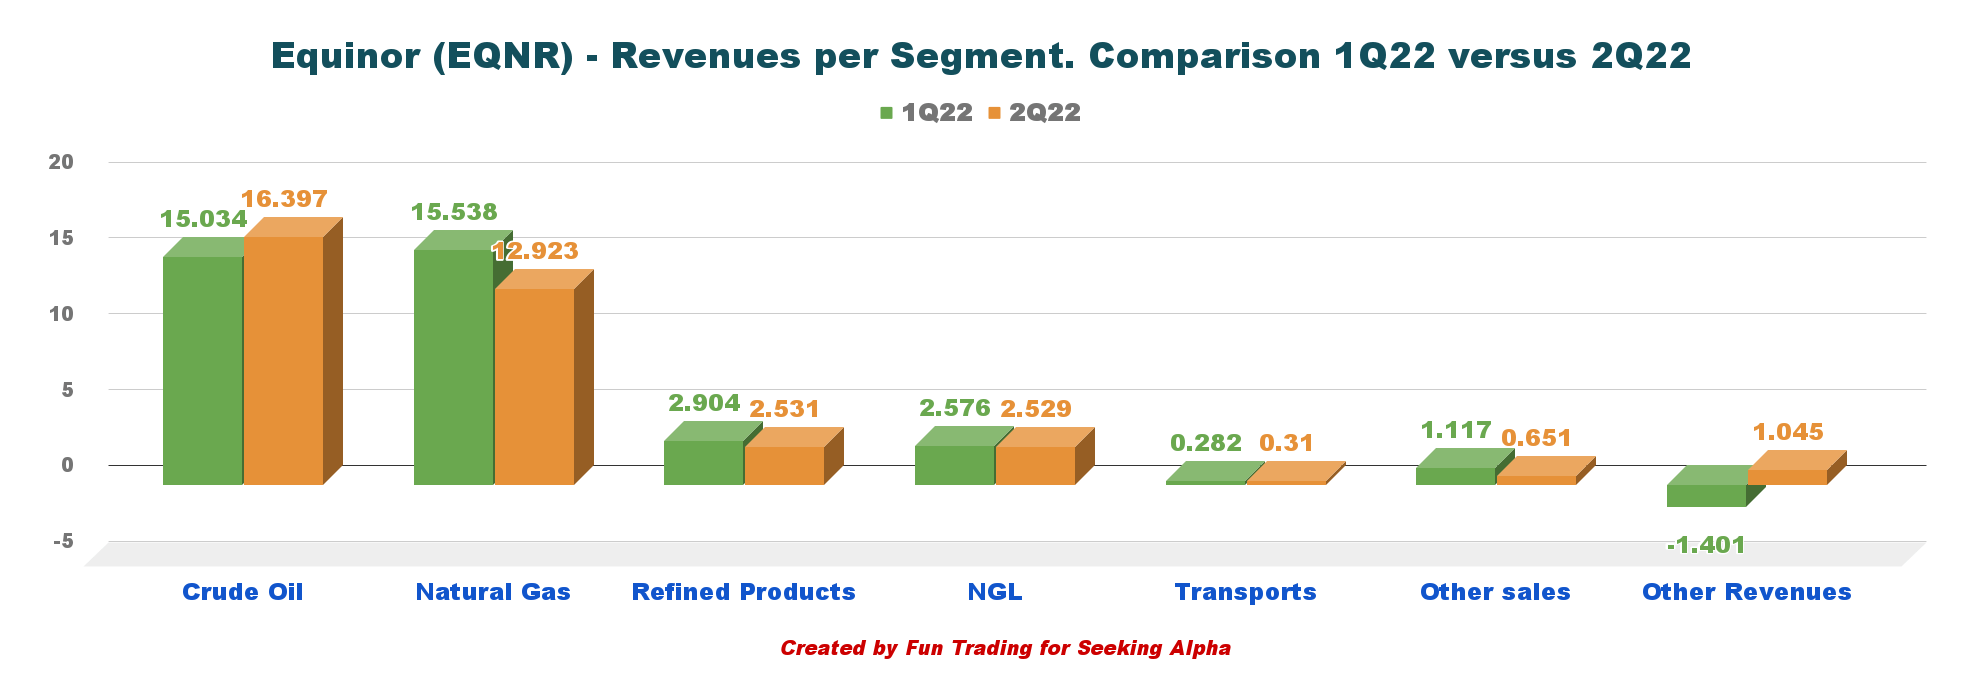
2 – EQNR compared to its peers
Equinor is one of the smallest in market cap amongst its peers and pays a solid dividend with a Foreign withholding tax of 25%, altering its attractiveness for dividend-oriented investors. However, with the extra $0.50 per share for 2Q22 and 3Q22, the dividend yield is now close to 7%.
EQNR Dividend comparison (Fun Trading)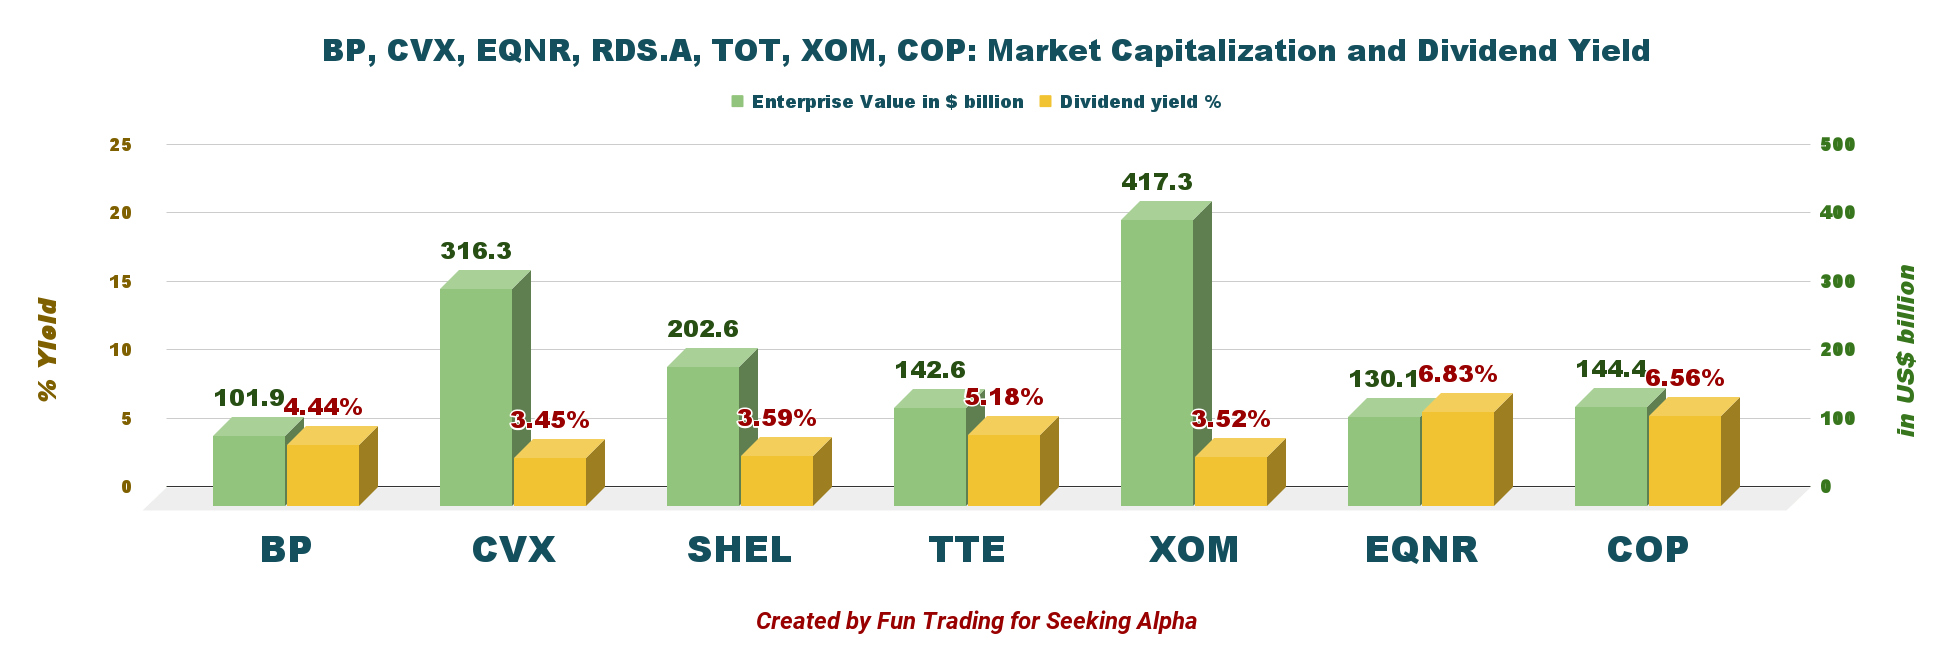
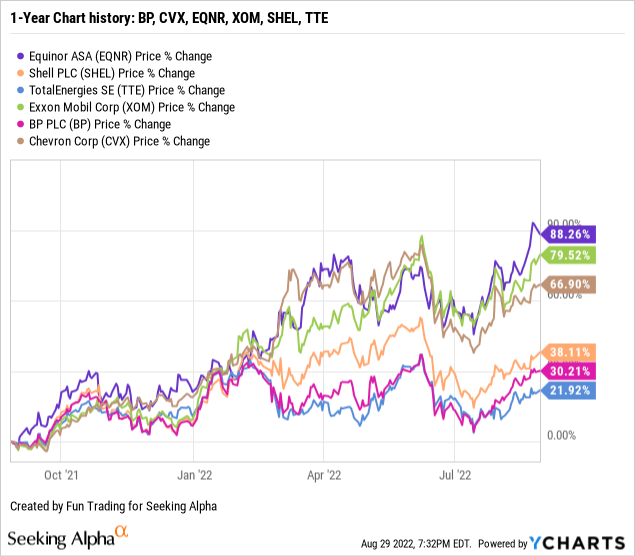
3 – Stock Performance
EQNR’s long-term performance shows that it outperforms its peers, with a 88% increase on a one-year basis.
Balance Sheet And Production 2Q’22: The Raw Numbers
| Equinor | 2Q21 | 3Q21 | 4Q21 | 1Q22 | 2Q22 |
| Revenues in $ billion | 17.38 | 23.11 | 32.13 | 36.05 | 36.39 |
| Total Revenues and others in $ billion | 17.46 | 23.26 | 32.61 | 36.39 | 36.46 |
| Net Income in $ million | 1,938 | 1,406 | 3,368 | 4,710 | 6,757 |
| EBITDA $ billion | 7.320 | 11.37 | 17.76 | 19.51 | 22.22 |
| EPS diluted in $/share | 0.60 | 0.43 | 1.03 | 1.46 | 2.11 |
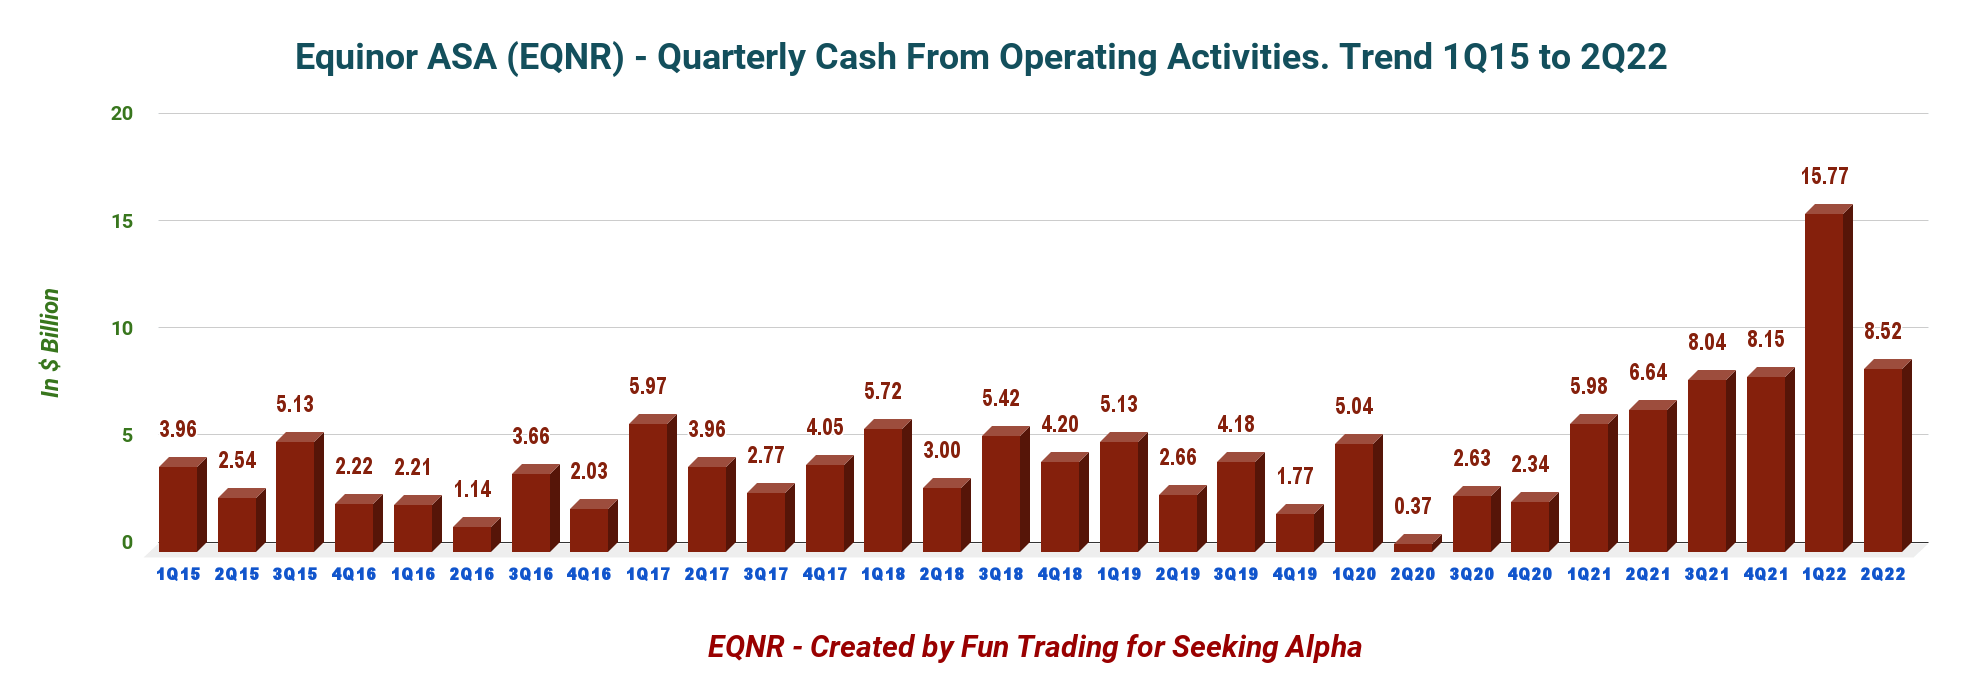
| Cash from operating activities in $ billion | 6.64 | 8.04 | 8.15 | 15.77 | 8.52 |
| Capital Expenditure in $ billion | 1.75 | 1.92 | 2.23 | 2.18 | 1.71 |
| Free Cash Flow in $ billion | 4.90 | 6.12 | 5.93 | 13.59 | 6.81 |
| Total cash $ billion | 25.06 | 28.85 | 33.28 | 44.57 | 45.69 |
| Long-term debt (+liabilities) in $ billion | 35.48 | 30.80 | 32.68 | 30.47 | 29.84 |
| Dividend per share in $ per share | 0.18 | 0.18 |
0.20 (+0.20) |
0.20 (+0.20) |
0.20 (+0.50) |
| Shares outstanding (diluted) in billion | 3.257 | 3.255 | 3.249 | 3.237 | 3.197 |
| Oil Production | 2Q21 | 3Q21 | 4Q21 | 1Q22 | 2Q22 |
| Oil Equivalent Production in K Boepd | 1,997 | 1,994 | 2,158 | 2,106 | 1,984 |
| Group average liquid price ($/b) | 63.7 | 69.2 | 75.9 | 97.1 | 106.9 |
Courtesy: Company 2021 Press release
Financials: Revenues, Free Cash Flow, Debt, And Production
1 – Revenues and others were $36.46 billion in 2Q’22
EQNR Quarterly Revenues history (Fun Trading) Revenues and others were $36.46 billion, up from $17.46 billion in the same quarter a year ago and up slightly sequentially (please look at the graph above). The strong quarterly results were due to higher commodity prices and increased contributions from the Martin Linge oil field.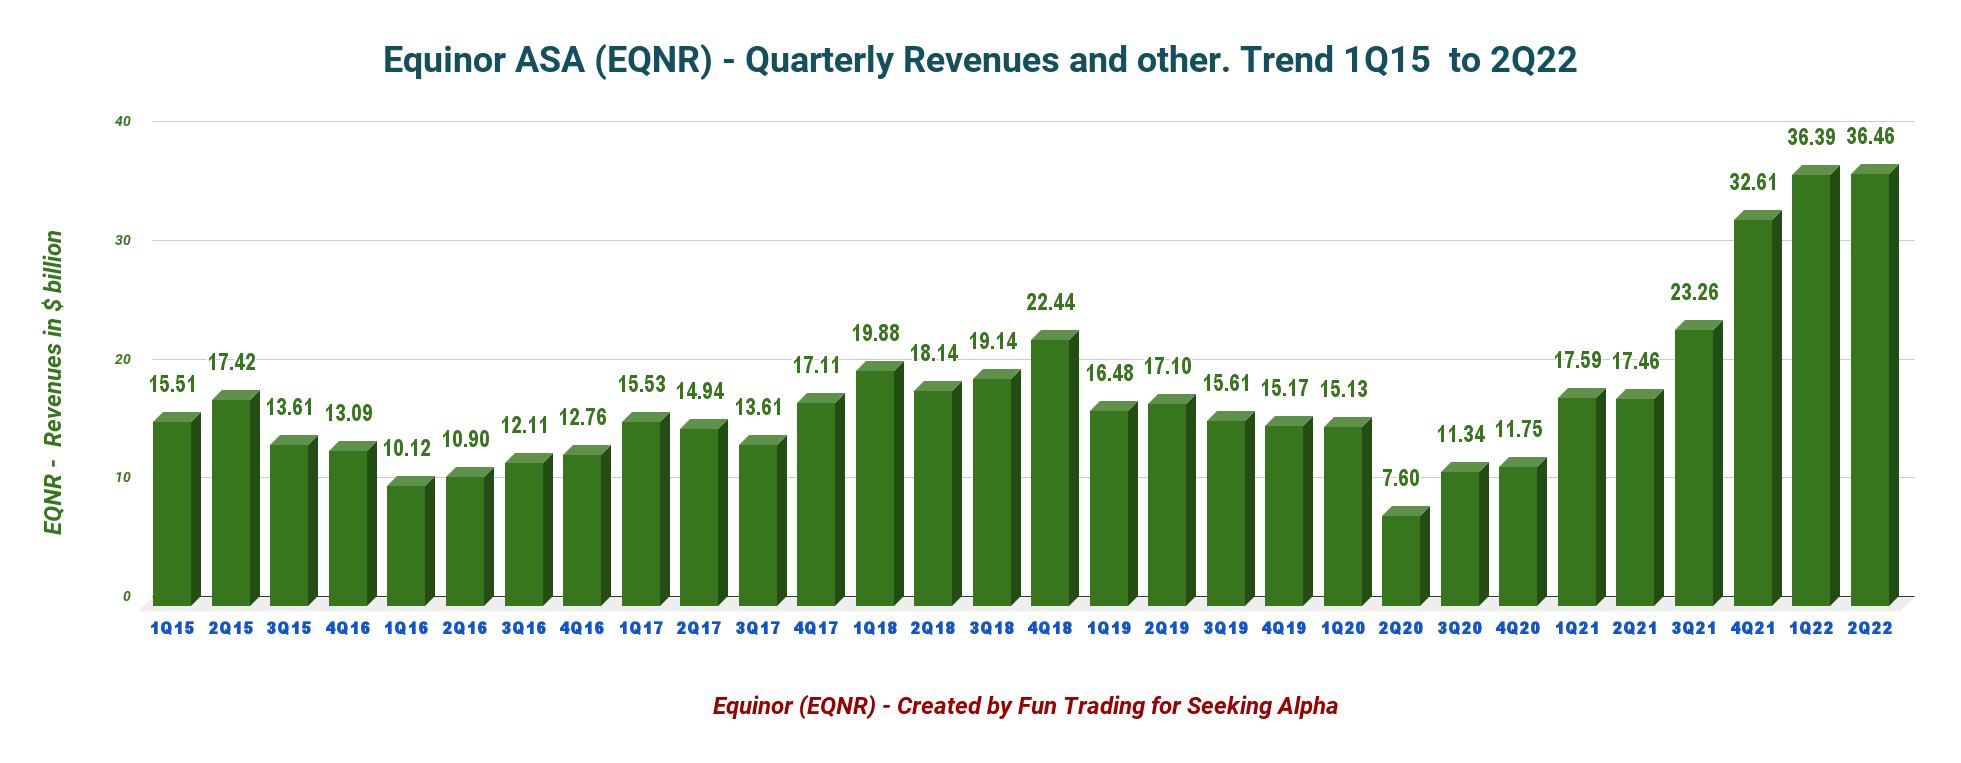
Net income was $6,757 million, or $2.11 per diluted share, up from $0.60 per diluted share in the same quarter last year.
Higher prices for liquids boosted the earnings this quarter again. Details per segment are presented below:
EQNR Adjusted earnings details Presentation (Equinor) 1.1 – Exploration & Production Norway (E&P Norway) The adjusted earnings were $14,330 million, up from a profit of $3,967 million last year. The company’s average daily liquids and gas production increased 7% yearly to 1,343K Boep/d due to higher output from the Martin Linge oil field. EQNR Production Details (Equinor Presentation)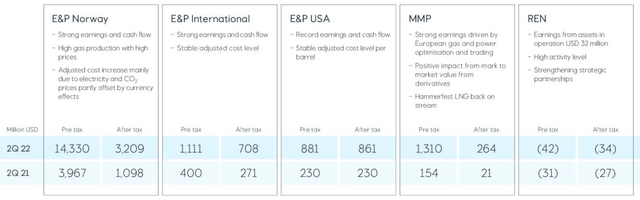
1.2 – E&P International
The adjusted operating profit was $1,111 million, compared to the year-ago quarter of $400 million. Liquids and gas prices boosted upstream activities again. The company’s average daily equity production of liquids and gas decreased slightly to 306K Boepd from 349K Boepd last year. The decrease was attributed to a lack of production from Russia.
1.3 – E&P USA
The adjusted quarterly income was $881 million, compared to $230 million last year. Oil and price contributed to the outperformance. More potent liquids and gas prices were helping.
Equinor’s average equity production of liquids and gas was 335K Boepd, down from 391K Boepd last year due to the divestment of unconventional U.S. from the Appalachia Basin assets.
1.4 – Marketing, Midstream & Processing (“MMP”)
The adjusted earnings were $1,310 million, up from $154 million a year ago.
1.5 – Renewables
The segment’s adjusted loss was $42 million from a loss of $31 million a year ago. Higher business development costs were to blame this quarter.
1.6 – 1Q’22 oil and gas prices realized
Equinor’s realized price for liquids was $106.9 per barrel during the second quarter of 2022 (oil was $113.8). The price realized increased significantly from last year’s $63.7.
The average European invoiced gas price in the first quarter was $25.53 per million Btu for Europe ($7.08 last year) and $6.51 for North America. It was a massive improvement from a year ago.
EQNR Quarterly liquids price history (Fun Trading) 1.7 – Cash from operating activities was a new record of $15.77 billion in 1Q’22. EQNR Quarterly Cash from Operations history (Fun Trading)
2 – 2022 Guidance and Outlook (Unchanged sequentially)
Organic CapEx is estimated at an annual average of $10 billion for 2022-2023, increasing to $12 billion in 2024-2025.
Equinor reaffirmed production growth expectations at 2% for 2022.
EQNR 2022 Outlook (Equinor Presentation) EQNR Quarterly Free cash flow history (Fun Trading) Note: I use the generic free cash flow, not including divestitures. It is the cash flow from operations minus CapEx. The company has a different way of calculating the free cash flow.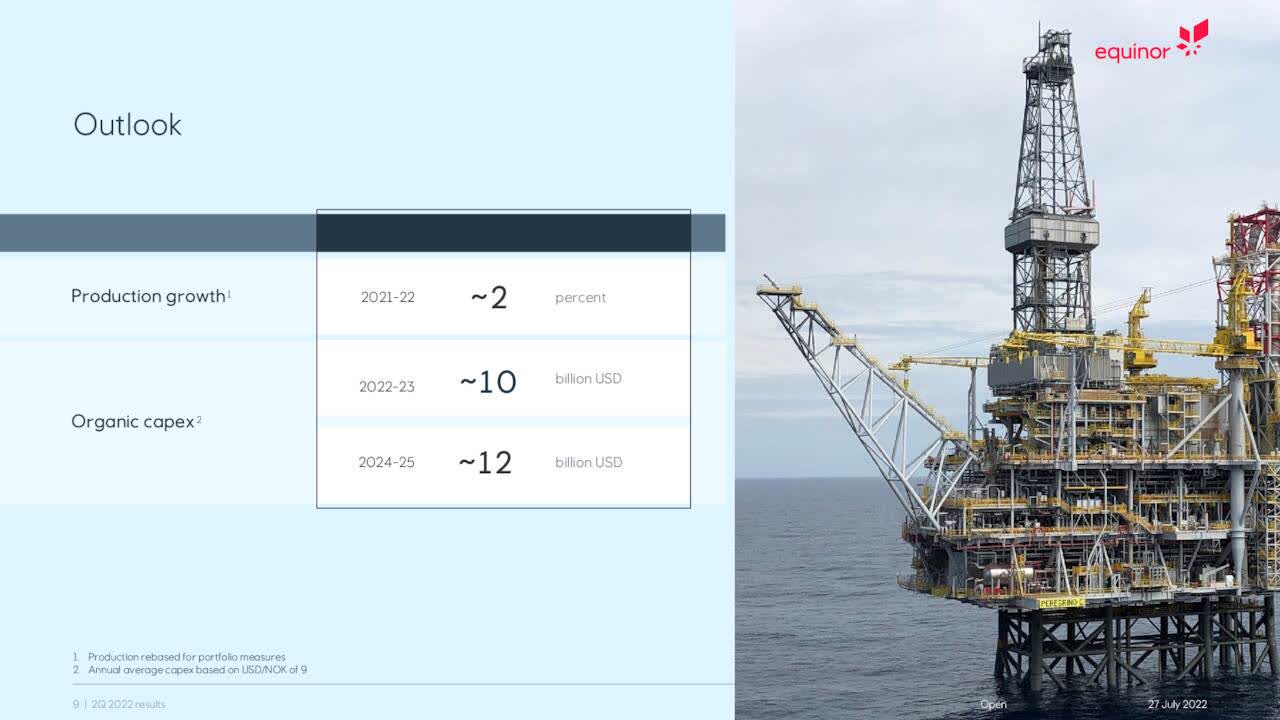
3 – Free Cash Flow was a record of $6,807 million in 2Q22

The company’s free cash flow was a record of $6,807 million in the second quarter of 2022 or a trailing 12-month free cash flow of $32,444 million.
Equinor announced a quarterly dividend of $0.20 per share, unchanged from the 1Q22. Also, its board declared a special quarterly cash dividend of $0.50 per share for the second and third quarters of 2022.
4 – No Net Debt in 2Q’22. Excellent profile.
EQNR Cash versus Debt history (Fun Trading)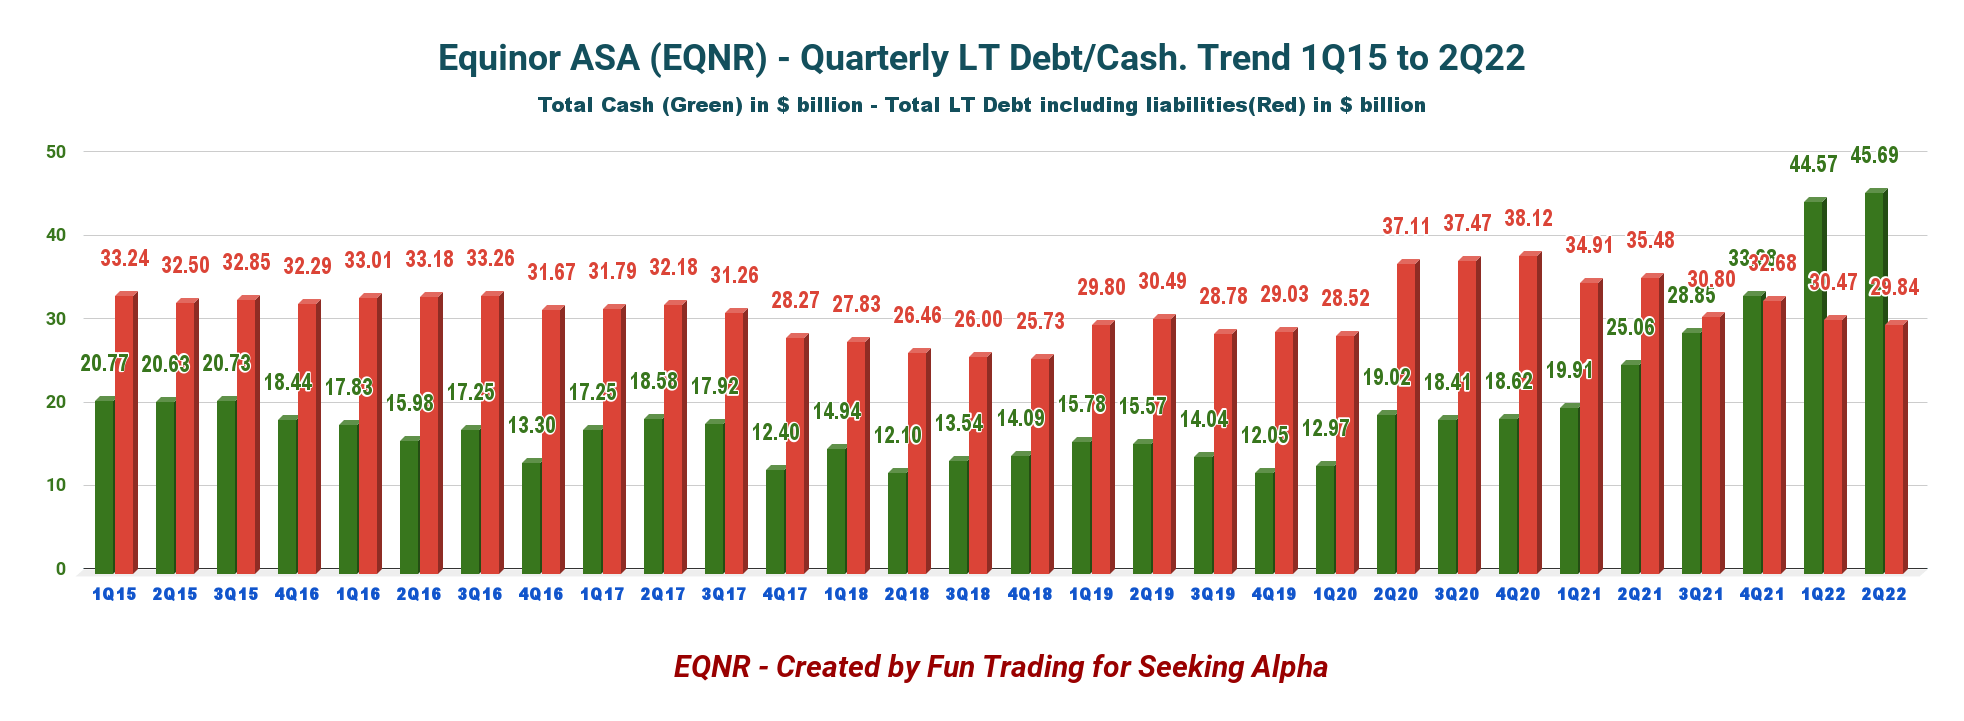
Note: The debt indicated above in the graph is the gross interest-bearing debt plus liabilities.
As of June 30, 2022, Equinor reported $45.69 billion in cash, cash equivalents, and securities. The company’s long-term debt amounted to $29.84 billion at the quarter-end.
5 – Production Upstream and Investment in Renewables
5.1 – Oil Equivalent Production
EQNR Quarterly Production history (Fun Trading)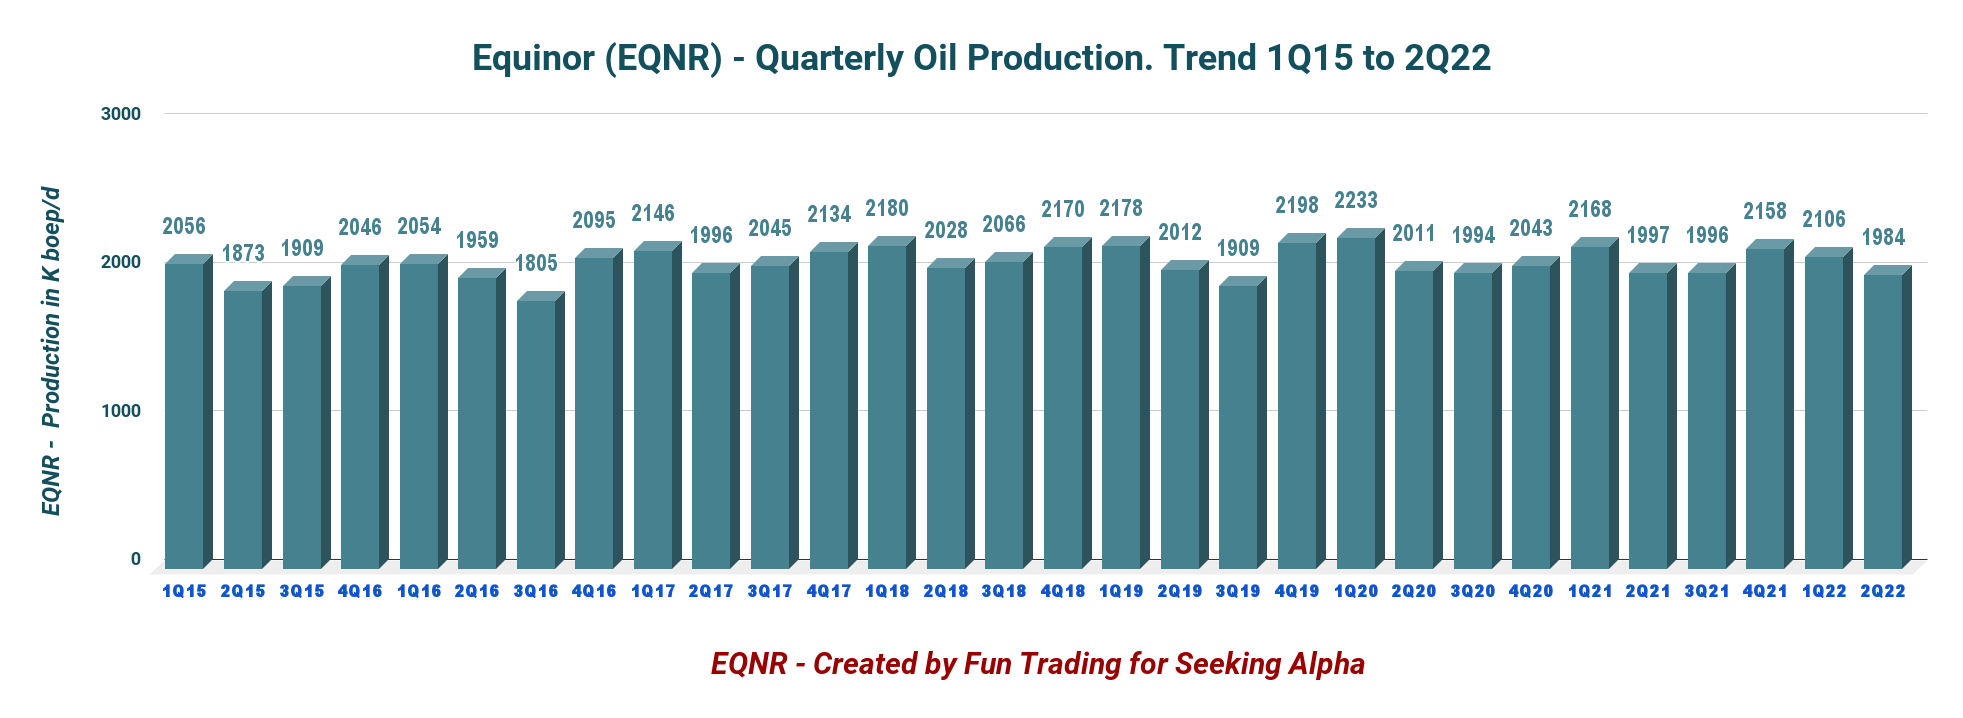
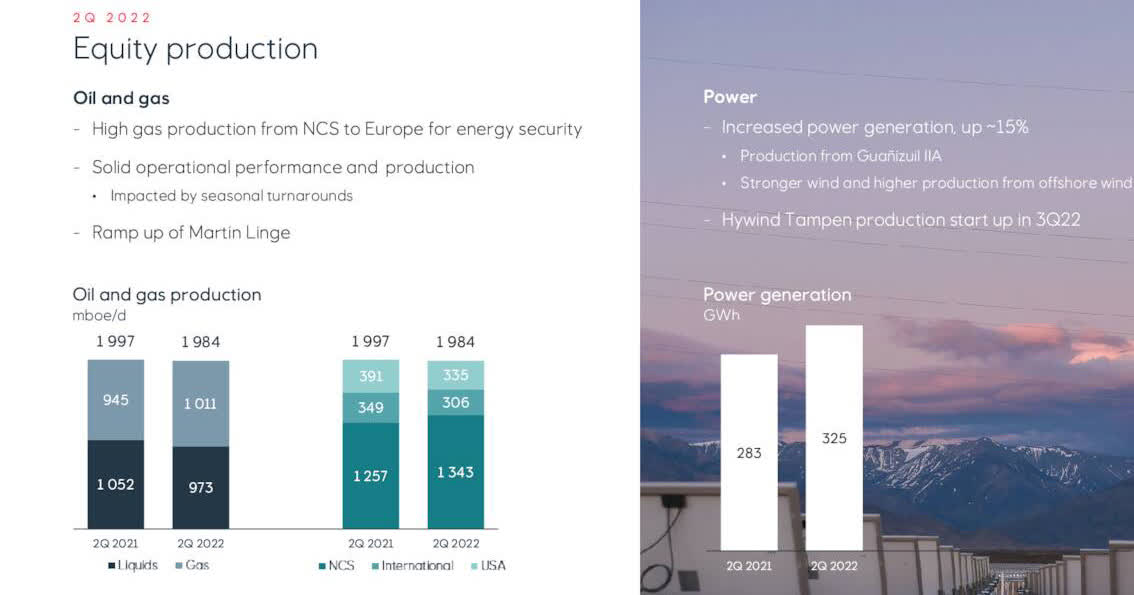
- The second quarter production was 1,984K Boep/d, down from 1,987K Boep/d in the same period in 2021 and down 5.8% sequentially. Gas production was 1,111 Boep/d or about 56% of the total output.
- Equinor share for power generation was 325 GWh this quarter, up from 283 GWh last year.
5.2 – Large Project ongoing: Canadian Bay du Nord.
The final investment decision for Bay du Nord is expected in the next couple of years, while the first oil could be achieved as early as late 2028.
5.3 – 2021 Reserves are down 9.3% from 2020 (unchanged from the preceding quarter).
EQNR Reserves (Equinor older Presentation) EQNR TA Chart short-term (Fun Trading)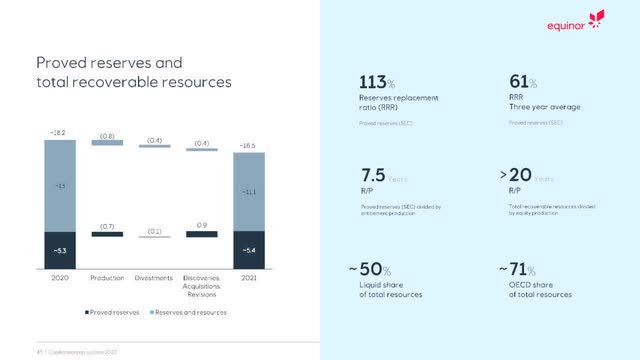
Technical Analysis And Commentary
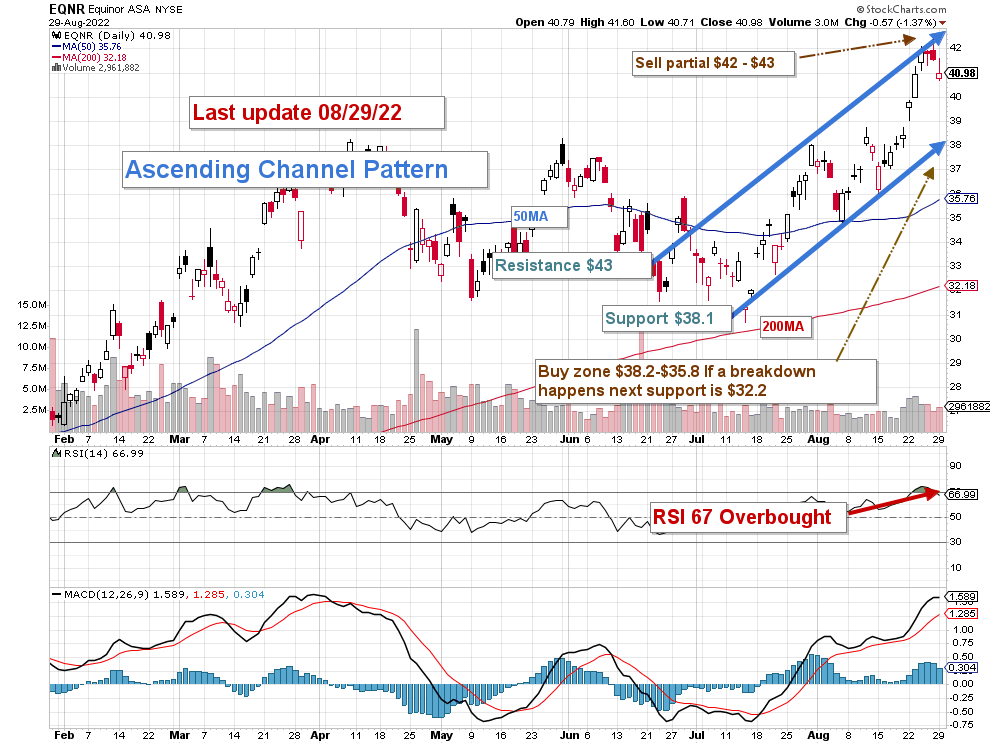
Note: The chart is adjusted for the dividend.
EQNR forms an ascending channel pattern with resistance at $43 and support at $38.1.
The trading strategy is to sell about 35% or more at or above $43 and accumulate between $38.2 and $35.8. EQNR is highly correlated to oil and gas prices, and your selling or buying decision must factor in these critical components.
I believe long-term investors should continue accumulating this cyclical stock on any weakness, which is an excellent natural gas play. However, we may have reached the top here, and it is perhaps time to figure out a way to protect your profits or sell a part expecting some retracement.
The overall strategy that I usually promote in my marketplace, “The Gold and Oil Corner,” is to keep a core long-term position and use about 35%-40% to trade LIFO while waiting for a higher final price target to sell your core position.
Note: The LIFO method is prohibited under International Financial Reporting Standards (IFRS), though it is permitted in the United States by Generally Accepted Accounting Principles (GAAP). Therefore, only US traders can apply this method. Those who cannot trade LIFO can use an alternative by setting two different accounts for the same stock, one for the long-term and one for short-term trading.
Warning: The TA chart must be updated frequently to be relevant. It is what I am doing in my stock tracker. The chart above has a possible validity of about a week. Remember, the TA chart is a tool only to help you adopt the right strategy. It is not a way to foresee the future. No one and nothing can.
Author’s note: If you find value in this article and would like to encourage such continued efforts, please click the “Like” button below to vote for support. Thanks.
Be the first to comment