


tadamichi
Thesis
Enterprise Products Partners (NYSE:EPD) released its Q2 2022 earnings report (“ER”) last week. The company, together with many other natural resource providers, has suffered strong headwinds during the COVID-19 pandemic. And earnings have dipped earlier in the year. In Q2, the company continues to benefit from an uptick in crude oil pipeline volumes and also higher commodity prices.
Against this backdrop, it reported strong Q2 results, beating consensus estimates on both lines. To wit, Q2 net income dialed in at $1.4B, or $0.64/unit, setting a record. In comparison, it earned $1.1B, or $0.50/unit, last year. Top line growth is even more impressive. Revenues surged 70% YoY to $16.06B.
Looking forward, I see the Q2 results only as the starting point of its new expansion cycle. The business now boasts a strong balance sheet and cash flow to fund its capital investments. In particular, it also unveiled three projects in the Permian Basin to expand its operations, paving the path for many years of organic growth ahead. In the meantime, the recent spike in oil and natural gas prices might encourage the current Administration to potentially open new drilling activities, which would further help EPD.
Expansion projects and Capital allocation
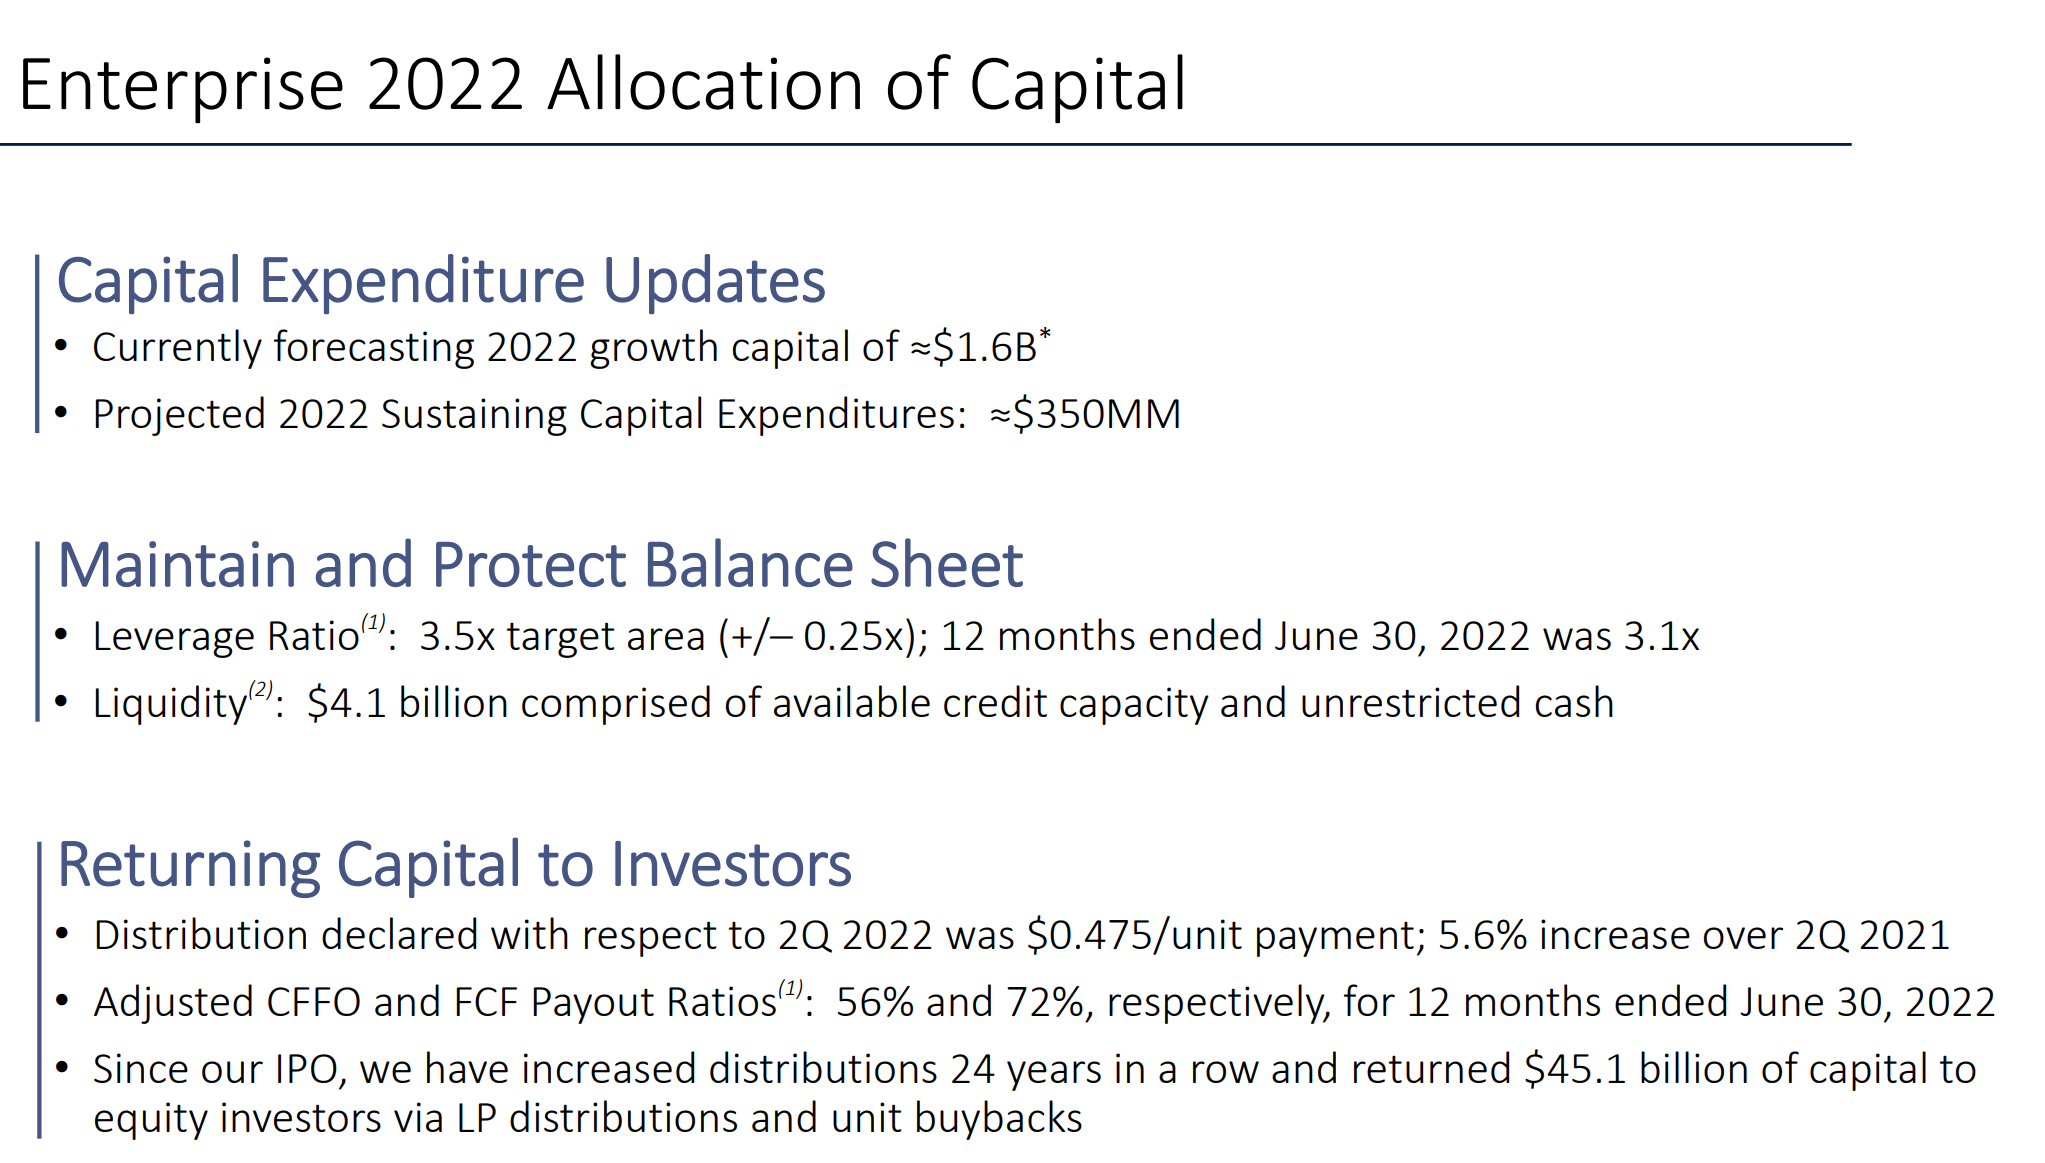
As aforementioned, EPD has just announced three organic growth projects in the Permian Basin. To fund such an expansion, the firm currently is forecasting a growth CAPEX budget of ~$1.6B for the full year 2022. In terms of maintenance CAPEX, the firm is projecting a sustaining CAPEX budget of ~$350M for 2022.
Its balance sheet is in a strong position to fund such capital projects thanks to its low debt cost, long duration, fix rates on the majority of the debt, and ample liquidity. As commented by Co-CEO Randy Fowler (abridged and emphases added by me):
For 2023, we currently expect that our growth capital spending will be $2 billion. Our total debt principal outstanding at the end of the quarter was $29.1 billion. Assuming the final maturity date for the hybrids, the average life of our debt portfolio is approximately 21 years. Our weighted average cost of debt is 4.4%. And at June 30, approximately 97% of our debt was fixed rate. Our consolidated liquidity at the end of the quarter was $4.1 billion. And this includes availability under our credit facilities and $231 million of unrestricted cash on hand.
Next, we will put these numbers under a historical perspective to better appreciate its financial strength.
EPD Q2 ER
Financial strength near a decade peak
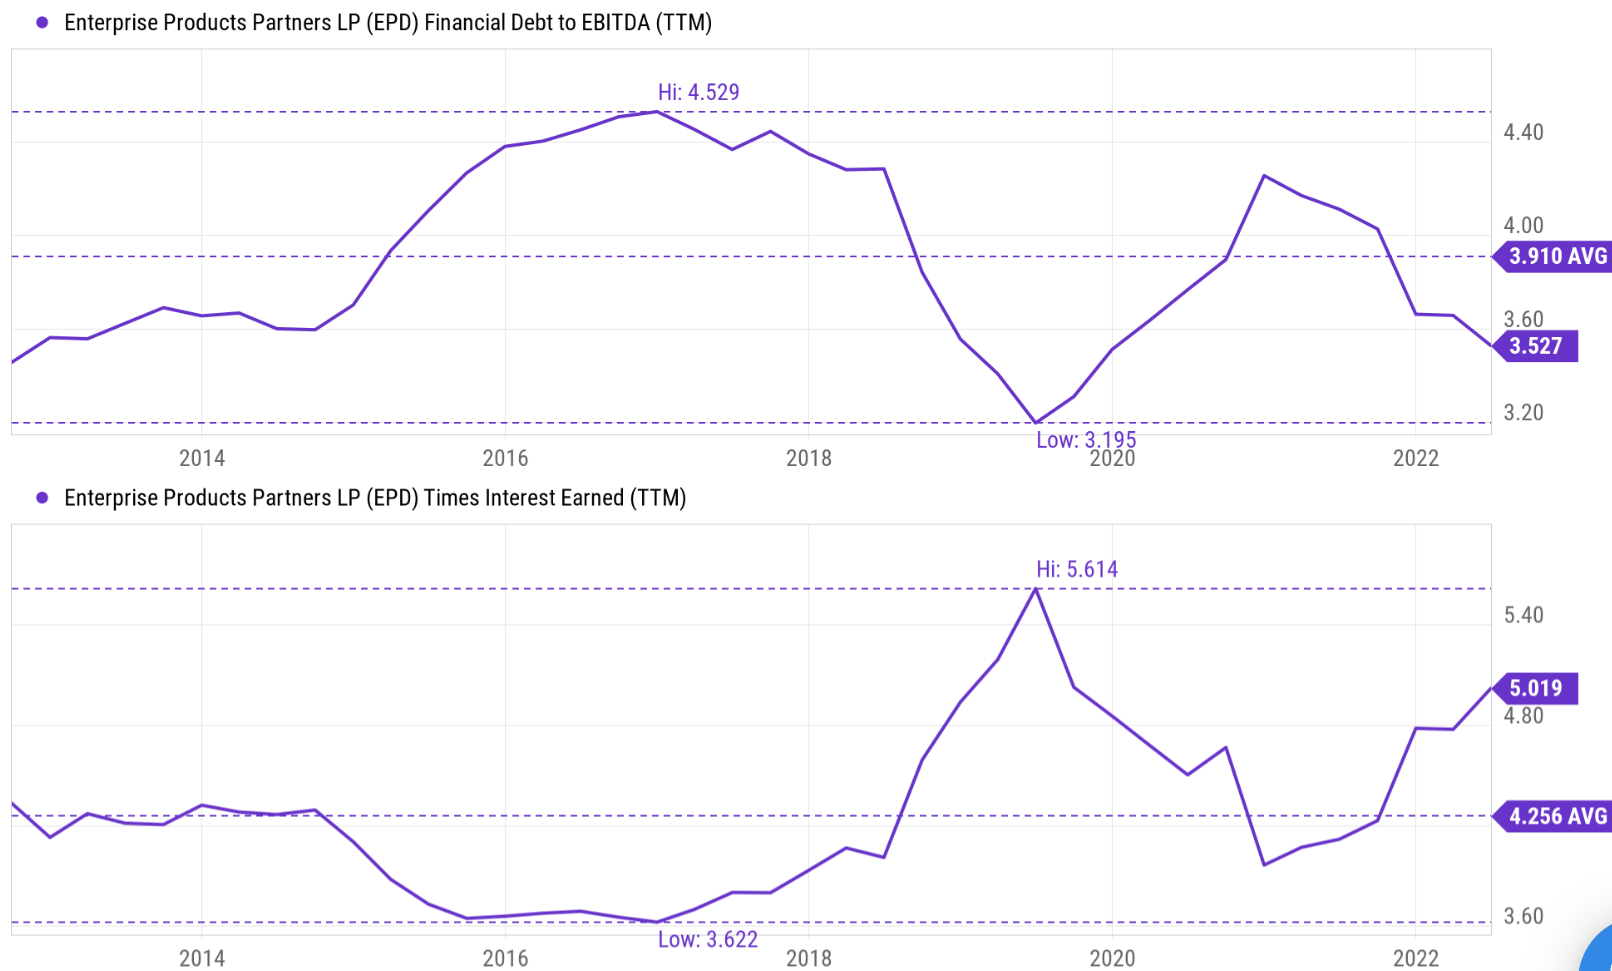
Thanks to its strong cash generation in recent quarters, EPD had plenty of cash to deleverage its balance sheet after covering the CAPEX expenses and also rewarding shareholders with generous dividends. It decreased its long-term debt from $28.1B in 2021 to the current level of $26.9B.
To anchor the discussion of such deleveraging a bit better, the top panel of the following chart shows its debt to EBITDA ratios over the past decade. As you can see, the leverage peaked around 2017 at 4.5x. And it then has been in decline steadily. Currently, it is at 3.5x, not only substantially below its historical average of 3.9x but also near the lowest level in a decade.
At the same time, thanks to the recovery of earnings, its interest coverage (currently at over 5x as shown in the bottom panel) is far above the historical average of 4.2x and also close to the highest level in a decade.
Seeking Alpha
Stabilizing asset utilization and margin
Ultimately, what drives profit for a manufacturing-type business like EPD are three things: leverage, asset utilization, and margin. More formally, it is explained by the so-called DuPont framework as detailed in my blog article below,
The DuPont analysis shows that there are three knobs that management can turn to drive up profitability: profit margin (“PM”), asset turnover ratio (“ATR”), and leverage. Through simple math, we can show that the ultimate profit is just the product of these three factors.
We’ve covered the first driver already. So, let’s examine the next two here.
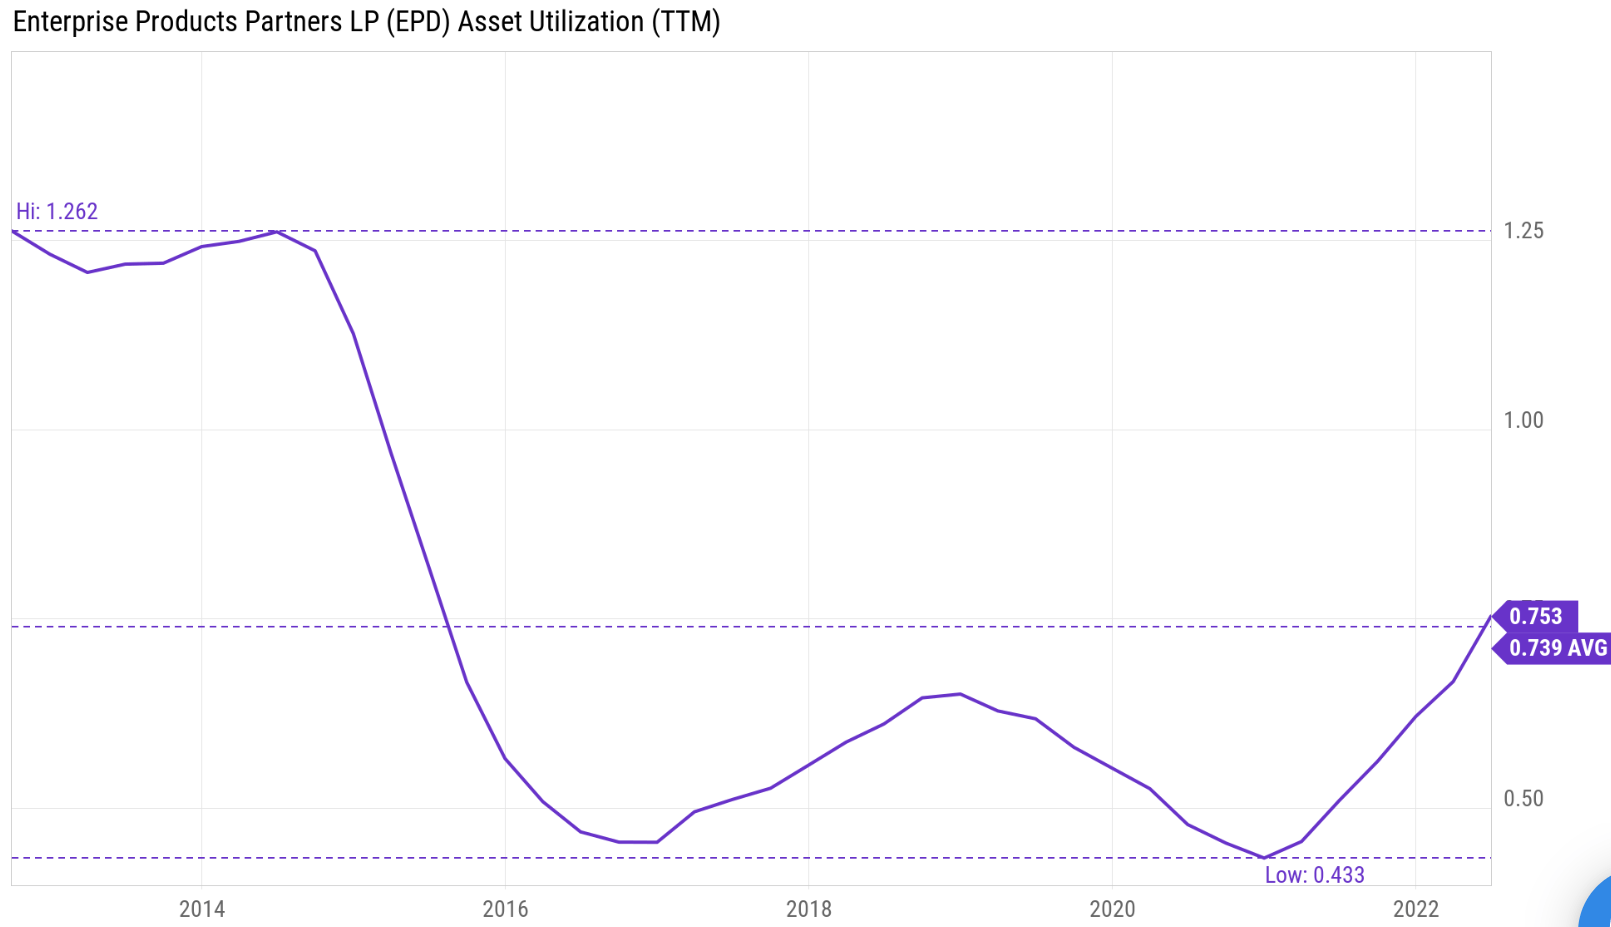
In the next chart, you can see that EPD’s asset turnover rate, or asset utilization rate, is on a path of rapid recovery recently. To be more specific, the ATR for EPD peaked at 1.2x at the beginning of the decade. It has then suffered a sharp decline and bottomed at 0.43x only due to the COVID pandemic as aforementioned. Since then, it has recovered to the current level of 0.75x. Its current ATR is already slightly above its long-term average.
Seeking Alpha
In terms of margin, I see several tailwinds to stabilize the margin at a healthy level. First, as aforementioned, I see the high commodity price persist and keep supporting a healthy margin. Second, also as mentioned above, the current Administration might encourage new drilling activities, which would help EPS volume (and ATR) and also its margin. Third, there is further synergistic potential for its recently acquired assets as co-CEO Jim Teague commented (abridged and emphasis added by me):
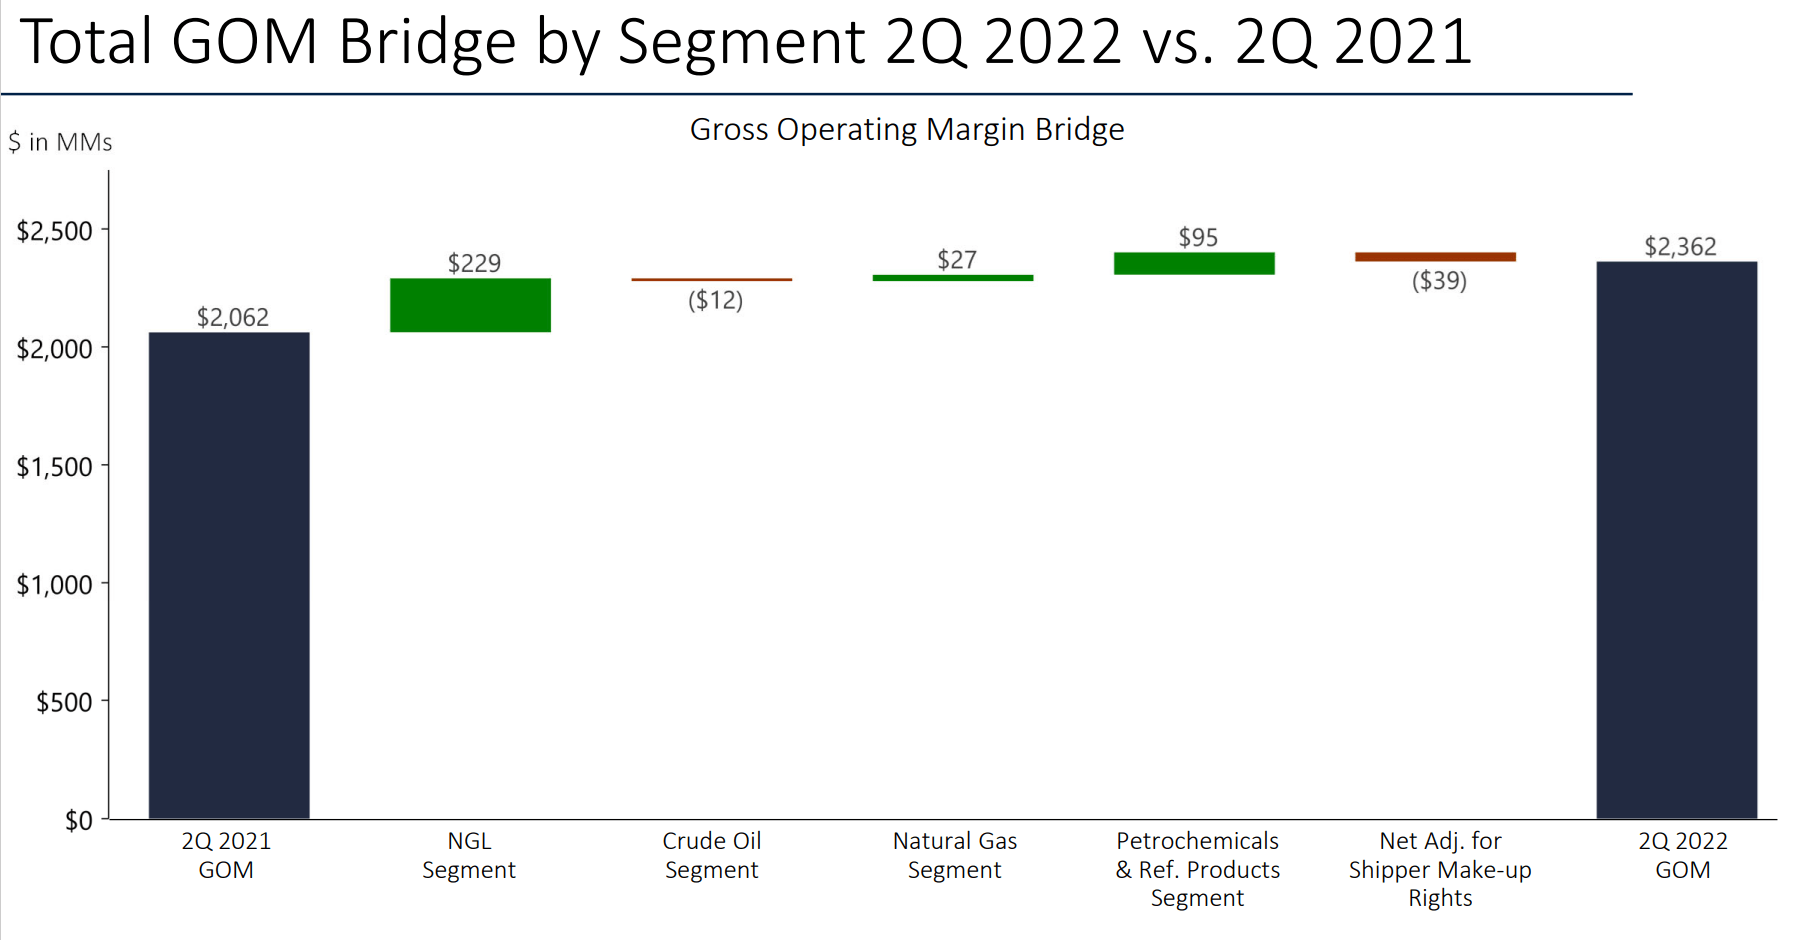
… we reported record adjusted EBITDA of $2.4 billion for the second quarter and that was driven primarily by higher margins and our octane enhancement business, higher natural gas processing margins and contributions from the Midland Basin assets we recently acquired. Those assets continue to significantly exceed our expectations.
EPD Q2 ER
Valuation and projected shareholder returns
Despite the growth potential and financial strength discussed above, the stock is currently for sale at a discounted valuation. As you can see from the chart below, in terms of P/E multiples, it’s currently valued at 12.2x, a discount from its historical average of 18x by about 1/3. In terms of dividend yields, its current yield of 6.8% is 11% above its historical average of 6.15%, signaling an 11% discount.
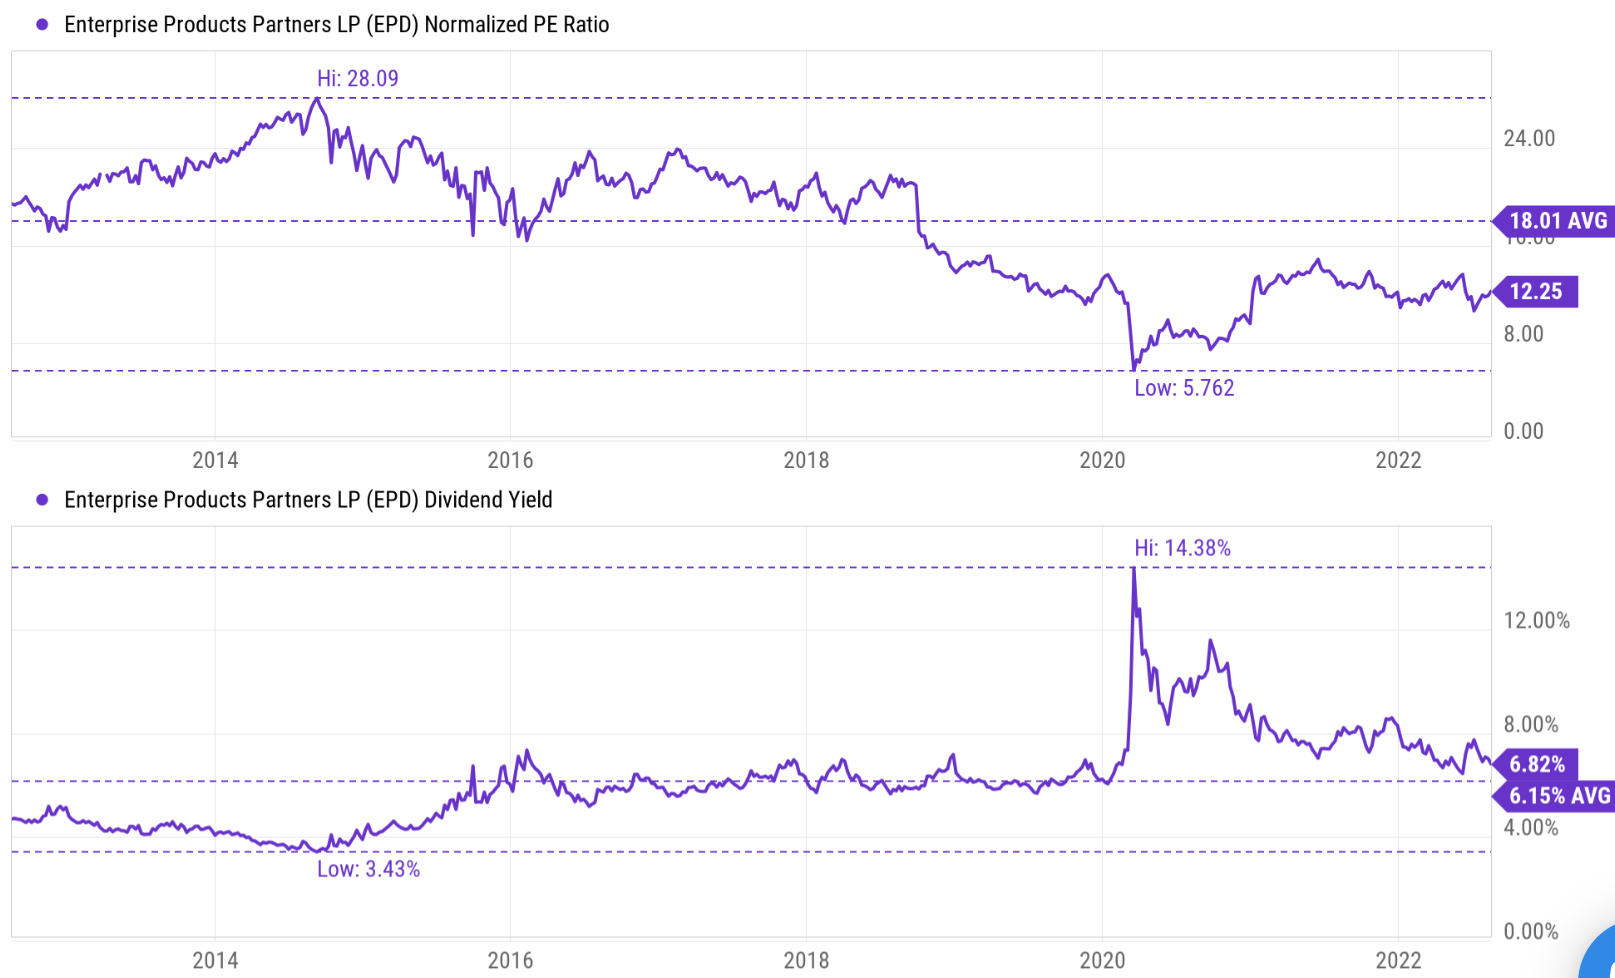
Seeking Alpha
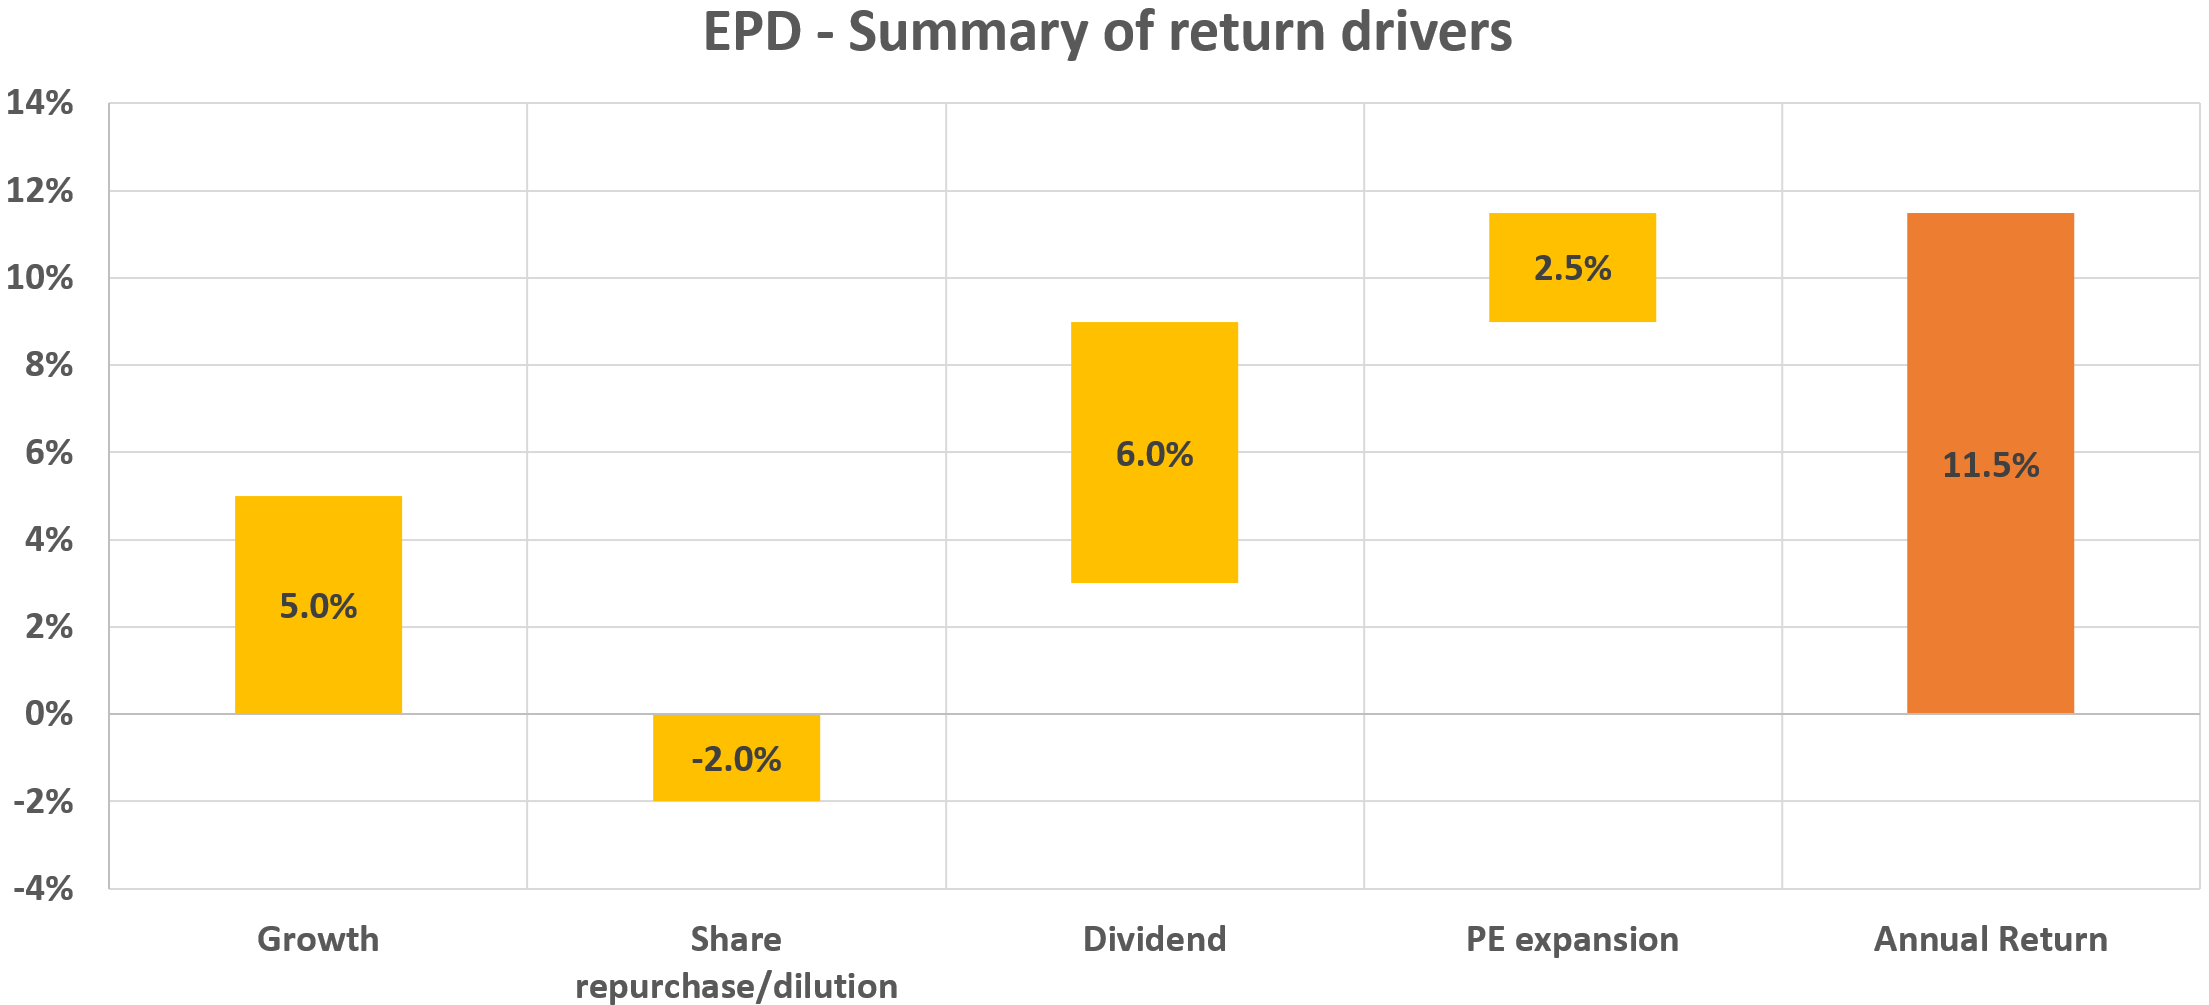
Based on the above business fundamental, growth potential, and valuation metrics, it is relatively straightforward to project the return in the next few years. Here let’s consider the following “normal” scenario. This scenario considers the following return drivers:
- 5% growth in total profit – on the conservative side given its expansion projects.
- 2% share dilution, consistent with its recent year level.
- Dividend at around 6% level (again consistent with historical average).
- A valuation expansion of 2.5% a year (using the valuation discount signaled in dividend yields to be conservative).
Based on the above return drivers, the annual return should be around 11.5% a year for the next ~5 years.
Author
Final thoughts and risks
Note that about ½ of the project return comes from dividends. And the current dividend yield (about 6.8%) is not only attractive in absolute terms but also attractive when compared to the industry average (about 3.6%) by a good margin. As such, the return profile should be even more appealing for value- and income-oriented accounts.
Finally, risks. In terms of macroeconomic risks, inflation is certainly a concern. Also, the overall domestic economy could suffer a recession in the near future. More specifically to EPD and its industry sector, the Russia-Ukraine war could potentially change the dynamics for the whole industry. The war remains a significant wildcard and could alter the balance of oil and natural gas markets in fundamental ways.
Be the first to comment