imaginima/E+ via Getty Images
Price Action Thesis
We present a detailed price action discussion on Energy Transfer LP (NYSE:ET) stock. Investors have been all over energy stocks in 2022, following the remarkable recovery from the 2020 COVID bottom.
However, ET stock has been a relative laggard somewhat, as the market remains tentative over its long-term bearish bias. We were watching to see whether ET could retake its critical 200-week moving average. However, the stock formed a significant bull trap in May, as the market rejected further buying momentum.
Therefore, the recent sell-off after the bull trap wasn’t surprising. We had also observed similar traps in Occidental (OXY) and Exxon (XOM) stock and discussed them recently (here and here) before the decline. Therefore, the market worked in unison to force rapid liquidation.
Our price action analysis suggests that ET stock could be at its near-term support. However, we have not yet seen any bear trap price action signal to indicate a bottoming process. So buying/selling now may not be astute.
Our valuation analysis indicates that ET’s falling revenue growth estimates could impact its valuation, despite still posting robust free cash flow (FCF) profitability. Furthermore, the market’s rejection of buying momentum in May, despite posting high FCF yields of 14%, is a critical concern. The market might be anticipating a further slowdown and therefore requires a higher yield to justify holding ET stock.
As such, we now rate ET stock as a Hold as we await the re-test of its near-term support.
Buying Momentum In ET Stock Stalled By A Bull Trap In May
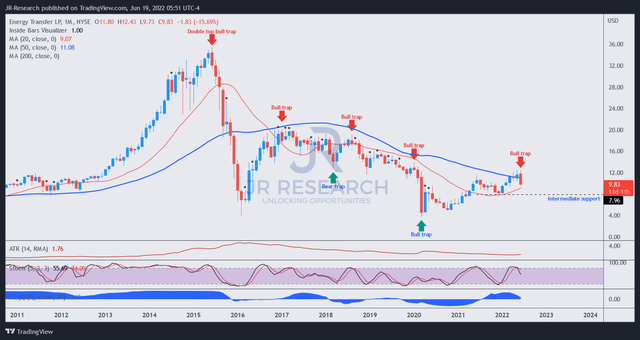
ET price chart (monthly) (TradingView)
A cursory glance over its monthly chart indicates that ET has remained mired in a long-term downtrend since 2016. After getting hit by a double top bull trap in June 2015 at its previous uptrend, it went into negative flow (decisive bearish momentum). A series of subsequent bull traps followed over the next four years as the market continued to mark down ET stock and prevent a retaking of bullish momentum.
However, that all seemed to change at the COVID bottom in March 2020, with a validated bear trap. ET stock then staged a series of higher lows, indicating a reversal of bearish momentum. However, the bull trap in May prevented another retaking of its bullish momentum. It appeared as though the market was staging a massive “bear market rally,” given the significant sell-off leading into the COVID bottom in 2020, validated by a bear trap reversal.
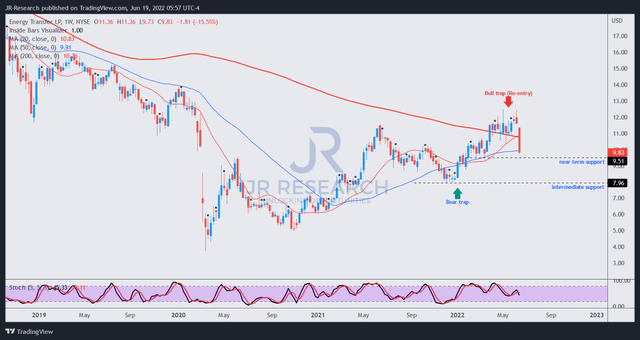
ET price chart (weekly) (TradingView)
Moving into its weekly chart, we can clearly glean the critical support/resistance levels. The bull trap was initially invalidated in May but was validated again two weeks later, with what we call a re-entry signal. Therefore, it shows that the market has been using false breaks to the upside to draw in more buyers but eventually decisively rejected the buying momentum.
Notably, the bull trap occurred at a critical juncture in its attempt to retake bullish momentum. As a result, the rapid liquidation sent ET back within negative flow, even though it seems to be at its near-term support, as seen above.
Given its bearish momentum, investors should be aware that any dip-buying at the current levels represents a counter-trending exposure, until ET can retake its bullish momentum decisively.
Furthermore, we have not observed signs of a bear trap reversal at its near-term support and therefore urge investors to be patient. We believe a breakdown of its near-term support could force further liquidation towards its intermediate support, where there was a validated bear trap.
Energy Transfer – Buying Momentum Rejected Despite Posting 14% NTM FCF Yield
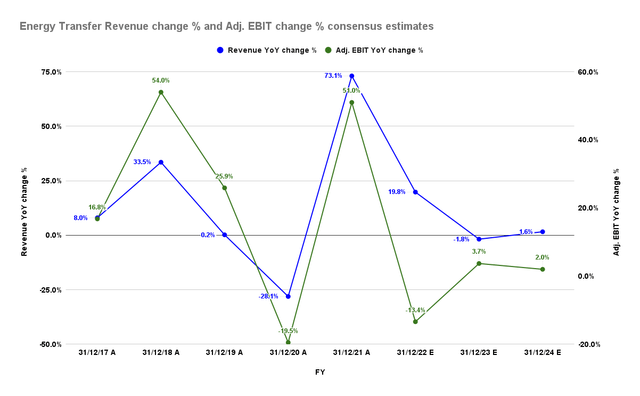
ET revenue change % and adjusted EBIT change % consensus estimates (S&P Cap IQ)
The consensus estimates (Street is highly bullish; 18/18 Buy/Strong Buy ratings) suggest that ET’s revenue growth could continue to moderate through FY24. Moreover, its adjusted EBIT growth is estimated to be impacted markedly, with FY21 as its likely peak growth.
| Stock | ET |
| Current market cap | $30.33B |
| Hurdle rate (CAGR) | 10% |
| Projection through | CQ2’26 |
| Required FCF yield in CQ2’26 | 15% |
| Assumed TTM FCF margin in CQ2’26 | 8% |
| Implied TTM revenue by CQ2’26 | $83.26B |
ET stock reverse cash flow valuation model. Data source: S&P Cap IQ, author
As a result, it could markedly impact its valuation. Therefore, we used a reverse cash flow valuation model to estimate the TTM revenue that ET needs to post by CQ2’26 to justify its current valuation.
We used a reasonable hurdle rate of 10% and an FCF yield of 15%. Since the market rejected its buying momentum at about 14% yield, we believe it’s a reasonable trade-off between its current yield (ET last traded at 16.94% yield). Using a TTM FCF margin of 8% (broadly in line with the Street’s consensus), we require ET to post a TTM revenue of $83.26B by CQ2’26.
However, the Street’s modeling suggests ET may have trouble meeting our revenue targets at its current valuation. And the Street is already highly bullish.
Is ET Stock A Buy, Sell, Or Hold?
We rate ET stock as a Hold for now. Although it has underperformed several of its energy peers, it remains mired in a long-term downtrend. Therefore, the dominant long-term bias remains bearish until ET stock can retake the bullish momentum that it lost in 2016.
Our price action analysis suggests that ET could be at its near-term support. But, we have yet to observe a bear trap price action signal.
Our valuation analysis indicates that ET seems overvalued at the current levels, based on the FCF yield that saw the rejection of its buying momentum in May.


Be the first to comment