

deepblue4you
Foreword
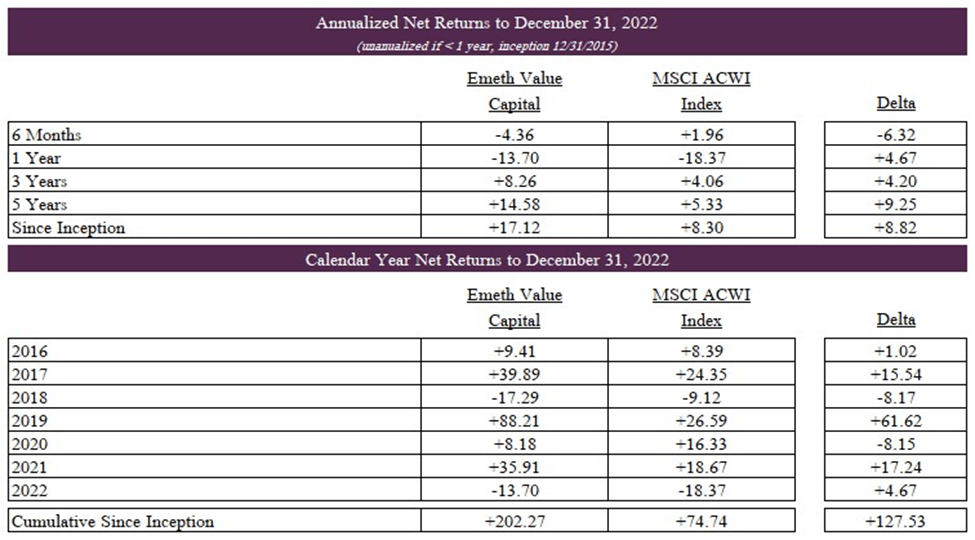
I intend to share the updated results at the outset of each letter. It is worth reiterating that I ascribe little significance to short term results. I look out many years when making investments for the partnership and believe our results are best weighed using a similar time horizon.
The Overreaction Hypothesis
[c. Dotcom Crash] If I’d learned anything it was that conventional wisdom had nothing to do with the truth and the efficient markets hypothesis was deceptive. How else could one explain Opsware trading at half of the cash we had in the bank when we had a $20 million a year contract and 50 of the smartest engineers in the world? No, markets weren’t efficient at finding the truth; they were just very efficient at converging on a conclusion – often the wrong conclusion. (Ben Horowitz)
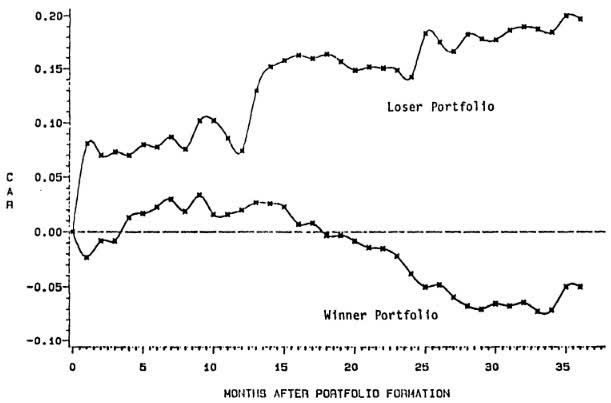
In 1985, Werner De Bondt and Richard Thaler published their renowned article, “Does the Stock Market Overreact?” which established the anomaly of systematic overreaction in financial markets. In the report, the authors examined stocks that had experienced either extreme capital gains or extreme losses over periods up to five years. “Winner” and “Loser” portfolios were constructed using this observable return data, and subsequent performance of the respective portfolios was measured. The experiments were inclusive of common stocks listed on the NYSE for the period beginning January 1926 and ending December 1982, which comprised between 347 and 1,089 participating securities. In short, at the end of each formation period securities were ranked from high to low, and the decile of top performing stocks became the “Winner” portfolio, whereas the decile of worst performing stocks became the “Loser” portfolio.
Performance was then measured for each successive period before a new rebalancing would occur, such that the formation and measurement periods were of equal duration. The outcomes are surprising even now. De Bondt and Thaler found that using a formation and measurement period of three years, “Loser” portfolios outperform the market by, on average, 19.6 percent. On the other hand, “Winner” portfolios earned about 5.0 percent less than the market. In other words, an investor would be 7.6 percent per annum better off by owning the worst performing stocks, calculated over the preceding three years, versus owning the best performing stocks. In addition, results showed that longer periods of extreme under- and over-performance were followed by equally pronounced reversals. For example, using a five-year formation and measurement period, “Loser” portfolios outperform the market by, on average, 28.5 percent. Alternatively, “Winner” portfolios earned 11.5 percent less than the market.
Some investors will undoubtedly dismiss the findings above as a relic of the past, a time, perhaps, when markets were less sophisticated and quantitative strategies less prevalent. The data suggests otherwise. In 2009, Clements et al. updated the original analysis with data extending through 2003. The results from the new two decade sub-period (1983-2003) demonstrated that the magnitude of the anomaly had actually increased over time. The “Loser” portfolios outperformed the market, on average, by 53.7 percent using the three year formation and measurement period. On the other hand, “Winner” portfolios underperformed the market by 4.03 percent. Thus, during this sub-period an investor would have been 16.4 percent per annum better off by owning the worst performing stocks, versus owning the best performing stocks. An examination of the full dataset from 1926 to 2003 reveals that the outperformance of the “Loser” portfolios versus the “Winner” portfolios increased to, on average, 42.5 percent, or fifty percent larger than the original 1985 study. Since the mid-2000s, numerous studies across dozens of geographies and asset classes have confirmed the existence of return premia associated with investor overreaction. Finally, while it is somewhat less comprehensive, we can replicate the analysis ourselves using constituents of the S&P500 for the most recent time period (2003-2022).
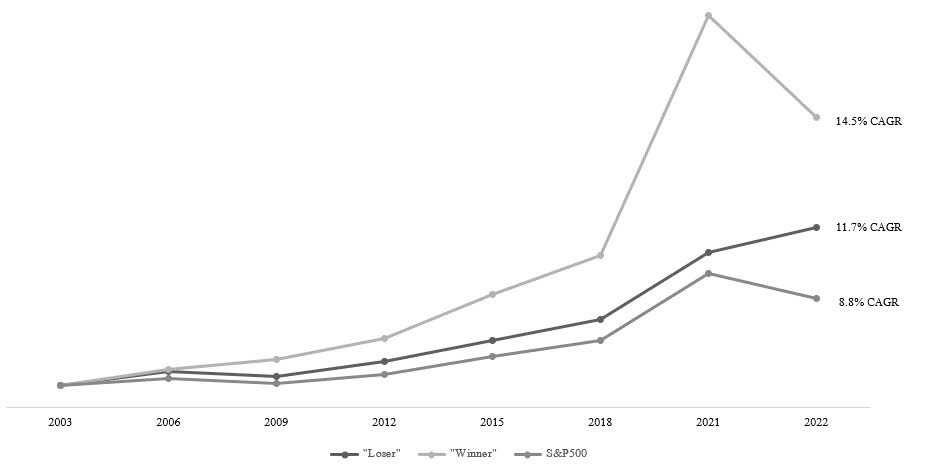
In particular, the last two decades have differed from other time periods in the United States with the remarkable outperformance of “Winner” portfolios. Winning companies have been winning bigger. However, “Loser” portfolios have also continued to outperform the market averages since 2003. The results show an impressive 2.9 percent per annum outperformance over this nineteen year measurement period. The collective ninety-seven years of data would seem to strongly suggest that, as long as humans are involved, bargains will continue to be found in the most unloved areas of the market. On occasion, opportunities arise to purchase companies where our perception of intrinsic value surpasses an already optimistic consensus. However, more often than not, opportunities exist when our assessment changes little, but spectacular shifts in sentiment drive prices away from intrinsic value. Below I highlight one of our portfolio companies that exemplifies the latter, Despegar.com, which has fallen by more than eighty percent since its IPO in 2017.
Despegar.com Corp (DESP) Overview
Despegar is the leading online travel agency (OTA) in Latin America. Increasingly, OTAs have become a destination of choice for consumers as they offer the ability to easily search, compare, and purchase travel products across thousands of suppliers on a single platform. Concurrently, OTAs provide travel suppliers, such as airlines and hoteliers, with a turn-key distribution channel to reach consumers who are rapidly becoming digital-native. Despegar was founded in Buenos Aires in 1999, and over the last two decades it has invested more than $2.5 billion developing a technologically world-class product offering and a leading brand presence in key markets, such as Brazil, Mexico, Argentina, Chile, and Colombia. The group has a blue-chip investor base including previous venture funding from General Atlantic, Tiger Global, Accel, and Sequoia, and current strategic investments from L Catterton (LCAA) and Expedia Group (EXPE). Despegar presently serves over five million travel customers per annum who account for nearly $6 billion in annual gross bookings.
A History of Travel Distribution
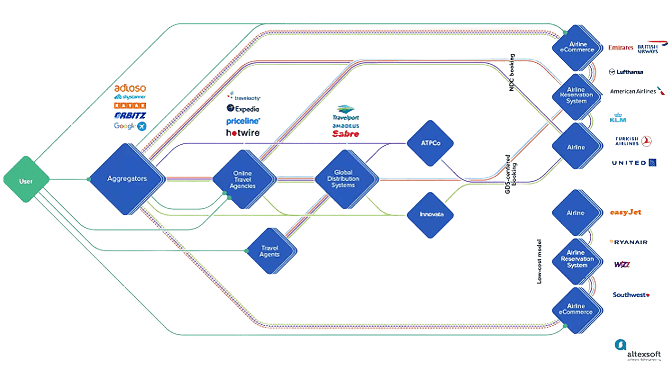
By the 1950s, exponential growth in consumer air travel began to stress the airlines’ existing manual reservation systems. Inaccuracies that drove flights to be frequently over or under booked were common, as route information and seat availability were hand documented by ticketing agents. In 1953, a chance meeting between a young IBM salesman, Blair Smith, and the president of American Airlines (AAL), C.R. Smith, incited the idea for a data processing system that could manage airline seat reservations electronically. The system would leverage the technology underpinning the first national air defense network, SAGE (Semi-Automatic Ground Environment), previously co-developed by IBM and MIT in the height of the Cold War. A decade later in 1964, American Airlines had the first operational Central Reservation System (CRS), which they called SABRE (Semi-Automated Business Research Environment). The system could process 7,500 reservations per hour at a near zero error rate, and information could be accessed instantly by ticketing agents through a network of 1,500 connected terminals. The success of the program prompted IBM to build its own system to market to airlines, and by the 1970s the technology was ubiquitous. However, while airline operations steadily became computerized, travel agency processes remained manual and reliant on calling the airlines to book reservations. It became clear that for airlines to fully benefit from automation, their new systems would need to bridge externally, thereby reducing the need to constantly grow the ticketing agent staff that handled inbound telephone calls. In 1976, United Airlines announced its intent to sell agency access to its CRS, APOLLO, and several other airlines followed shortly thereafter. Under this model, airlines would provide CRS access in an exclusive, long-term contract with the travel agency that included terminal installation, software maintenance, and training. At the outset, however, conditions proved less than ideal, as systems were expensive and travel agents, being bound to the CRS provider, could not access multiple airlines. Acknowledging the need for improvement, and amid the backdrop of the recently passed Airline Deregulation Act of 1978, airlines began to open their CRS platforms to non-competing carriers that paid co-host and booking fees. Ultimately, competing carriers subscribed to competitor CRS platforms as well, although they were charged higher booking fees and were often disadvantaged on search display results. By the mid-1980s, over ninety percent of travel agencies subscribed to a CRS platform, and American Airlines’ SABRE and United Airlines’ APOLLO controlled forty-nine percent and thirty-one percent of the market, respectively. In tandem, the importance of CRS platforms was magnified by the expanding role of travel agencies. In 1977, thirty-eight percent of airline tickets were booked through a travel agency and by 1989 that figure reached seventy-five percent. Owing to the growing dominance of a select few CRS platforms, the Department of Transportation promulgated a series of regulations throughout the 1980s and 1990s aimed at leveling competition for airlines that did not own a CRS. Among other things, these rules prohibited screen biasing, required non-discriminatory booking fees, and established mandatory equivalent participation for major airlines in competing CRS platforms. By the late 1990s, airlines began to divest their ownership in CRSs. SABRE launched an IPO in 1996, APOLLO followed in 1997, and AMADEUS, a platform founded by Air France, Iberia, Lufthansa, and SAS, filed for IPO in 1999. As these newly independent and increasingly global platforms continued to scale, it marked the emergence of a new vertical within travel, Global Distribution Systems or GDSs. Today, the GDS platforms account for roughly half of the 4.5 billion global airline passengers traveled per annum and connect travel agencies, both traditional and OTAs, to thousands of global travel suppliers.
The efforts within the hotel industry to process bookings electronically progressed more slowly. During the 1980s, while a vast majority of airline bookings were being processed electronically, over eighty percent of hotel reservations were still manual. Integration with GDS platforms proved expensive and onerous, particularly given the high fragmentation within the hotel industry. Moreover, connectivity that did exist on a one-off basis was scant, as incorporating the data requirements of a more diverse hotel product was difficult on purpose-built airline centric GDS platforms. Both the type and amount of data that could be displayed was limited, which resulted in simplified, abbreviated, or truncated descriptions and only a narrow selection of room availability. Some progress was made when, in 1988, a consortium of sixteen leading hotel chains established The Hotel Industry Switch Company (THISCO) and built a common user interface (UltraSwitch) between their central reservation systems and the GDSs. The effort to develop standardized communication protocols was a huge success and for the first time allowed travel agents to easily access a wide range of travel offerings, both air and hotel, through a single GDS terminal. Some years later, in the mid-1990s, mass internet adoption would create a paradigm shift in the travel landscape. In 1995, TravelWeb, founded by Pegasus Systems, the parent company of THISCO, became the first company to provide individual travelers the ability to make hotel reservations over the internet. In 1996, TravelWeb partnered with AMADEUS to offer direct flight booking capabilities and became the first full service OTA. In addition, in 1996, Travelocity was founded by SABRE as a consumer-facing OTA, and Microsoft (MSFT) launched Expedia as its online travel division. Booking.com was also founded in 1996, and Priceline was founded in 1997. Travel suppliers quickly realized that the rise of personal computing and the internet provided an alternative channel to reach end consumers without relying on a GDS. Airlines and large hotel chains began promoting direct access to reservations via their own website.com platforms, and many OTAs began developing direct connections with suppliers that bypassed GDSs. For the first time in its history, GDS market share fell as a percentage of global travel. Notably, direct connections with OTA platforms offered important advantages for travel suppliers beyond cost savings. HTML based webpages offered the ability to incorporate extensive data, including graphics, about a hotel property that simply was not possible via GDS platforms, which operated legacy code on IBM mainframes. Furthermore, in contrast to GDSs, the OTA’s modern technology platforms supported an era of exploding look-to-book ratios, from tens-to-one to thousands-to-one, which required that they operate with their own inventory and rate databases powered by direct connect XML interfaces. Today, OTAs have continued to leverage their second-mover advantage in technology to become the most sophisticated players in global travel distribution and as a result continue to gain market share more than two decades since inception.
OTA vs. Metasearch
It is important to draw a further distinction between two common business models in online travel – metasearch platforms and online travel agencies. While a consumer may find little difference between the two, the competitive position and economics that result contrast meaningfully. Metasearch platforms such as Tripadvisor (TRIP), Kayak, and Trivago (TRVG) serve as price comparison tools by aggregating data from across the internet, which primarily includes listings from OTAs and direct from supplier websites. Consumers are then offered rates from multiple providers for a given property or itinerary. Notably, metasearch platforms are not booking channels, but rather they are search engines for various booking channels. Consumers are able to view and select the best offer, but are then redirected to the travel company website to complete the booking. Unlike travel agencies that earn a commission based on travel bookings sold, metasearch engines operate an advertising model that generates revenue on a pay-per-click basis. In effect, inventory suppliers set marketing budgets and pay metasearch providers for leads that may or may not convert into bookings. On the other side of the ledger, metasearch providers acquire paid traffic through large search engines, such as Google, and traditional advertising methods. This leaves metasearch providers in a challenging position with a concentrated group of OTAs on one side of the platform and Google (GOOG, GOOGL) on the other. Indeed, the competitive challenges intensify when considering that Google itself operates a dominant travel metasearch imbedded within its own platform, which, as the de facto global starting point for search, has a near zero cost of customer acquisition, and because OTAs compete directly with metasearch for the same paid traffic that they would presumably be resold. The result has not been a good one for metasearch. On the other hand, OTAs that own the relationship with travel suppliers, have fragmentation on both sides of the platform, and have the scale to efficiently compete in acquiring paid traffic have proven to be wonderful businesses. There are dozens of OTAs globally; however, Booking.com and Expedia dominate the market with over seventy percent of OTA market share by revenue.
The Travel Industry in Latin America
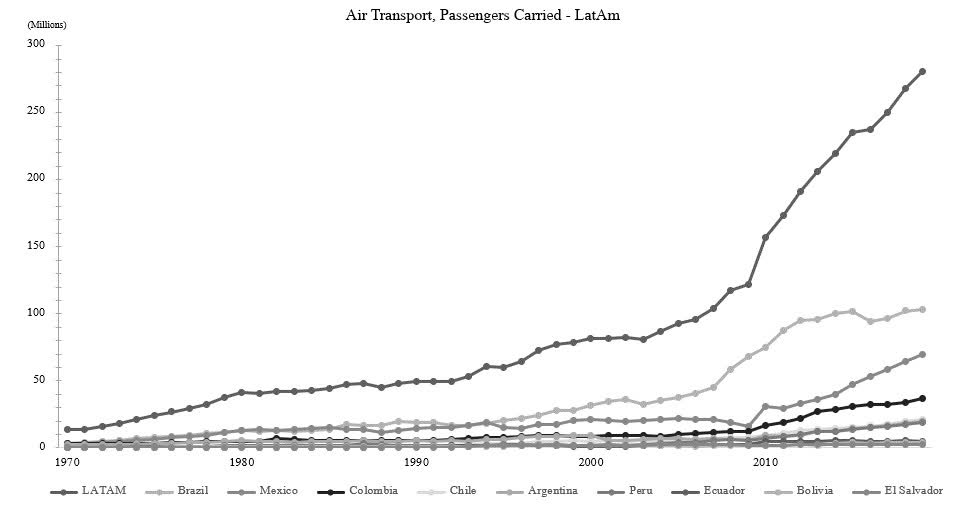
Travel is a structurally growing industry. Over the last five decades, global air passenger traffic has approximately doubled every fifteen years, and in Latin America the developments have been analogous. According to data from the International Air Transport Association, roughly 281 million air passengers were carried in Latin America in 2019, which represented a 6.4 percent annual growth rate in traffic since 1970. For refence, 4.56 billion air passengers were carried worldwide in 2019, which represented a 5.6 percent annual growth rate in traffic over the same time frame. Remarkably, while the air transportation market is often associated with cyclicality, there has only been one period over the five decades of reported data, both worldwide and in Latin America, when the three year growth rate of passengers was negative (*pre-covid). More specifically, the travel market serving Latin American consumers is attractive by several measures. Latin America is one of the largest and most diverse regions in the word, comprised of over forty countries with a total population in excess of 650 million, and possesses a relatively low current propensity to travel that is inflecting higher with the growth of the middle class. For instance, travelers in the United States take 2.1 trips per year on average, compared with 0.57 trips per year on average for Latin American travelers. The data is clear that propensity to travel is closely linked to levels of disposable income, and, on this basis, global market forecasts by Boeing (BA) and Airbus (OTCPK:EADSF) project travelers in Latin America to reach a propensity to travel of 1.2 trips per annum by 2041. In dollar terms, across both flights and hotels, the total travel market in Latin America is approximately $120 billion in gross bookings and is expected to grow at six percent per annum over the next several years. However, online travel currently represents only forty-two percent of gross bookings in Latin America, compared with seventy-two percent in the United States. As the penetration in online travel increases, which Euromonitor estimates to reach forty-seven percent in Latin America by 2026, the result is a growth rate for digital bookings that is fifty percent higher than the travel market in aggregate.
Competitive Landscape
Despegar’s competitors can be broadly segmented into the following three categories: (i) global, ((ii)) regional, and ((iii)) supplier direct. Within the segment of global competitors, Despegar competes with both OTAs and metasearch providers. Among OTAs, although Expedia and Booking.com are both globally dominant, Booking.com has a strong position across Latin America; whereas, Expedia is only a relevant competitor in Mexico. More specifically, the Booking.com brand is synonymous with leadership in the hotels segment, where it possesses the largest offering of properties across the region, and is particularly strong in Brazil, where the group has a more active marketing focus. The most relevant global metasearch providers, which function as both competitors and partners to Despegar, are Google and Trivago. Trivago is majority owned by Expedia and has a strong brand presence across Latin America. However, as alluded to previously, the economic model of metasearch is challenged, and Trivago is a case in point. Trivago has historically depended on Expedia and Booking.com for nearly eighty percent of its revenue, and as OTAs have prioritized spend that drives conversion of future direct bookings, pure performance marketing channels have been severely damaged. This dynamic is likely to limit Trivago’s capacity for growth in the years ahead. On the other hand, Google’s dominance within travel metasearch is growing rapidly, even while its ambiguous competitive position within the travel ecosystem has at times been a major source of concern for OTAs. In 2015, Google launched an instant booking option that for the first time would allow users to complete a hotel or flight booking without leaving the main search platform. Many believed that this was Google’s attempt to become a travel agency itself and cut out vertical specific players, like
Booking.com or Despegar, even if that meant walking away from billions of dollars of ad revenue. This was a particular concern as the Google Flights and Google Hotels widgets often sit at the top of the search engine results page for generic travel search queries and because Google search is still the starting point for a large proportion of consumer travel. However, in 2022 after low consumer take-up, Google discontinued its instant booking option for both hotels and flights and transitioned to a pure metasearch model. Google is likely to remain an essential partner and competitor for many years. Within regional competitors, Despegar competes with smaller OTAs that are often focused on a single country market and local offline travel agencies. The most notable offline competitor is CVC, the largest tour operator in Brazil with 1,200 physical store locations. CVC operates a franchise model, and over the last decade it has successfully doubled its unit count by adding new franchisees and converting existing independent travel agents into franchisees. However, the number of existing units has decreased by nearly twenty percent since the pandemic and is unlikely to be a source of growth going forward. Finally, Despegar competes with its own travel suppliers that are constantly aiming to increase their share of direct bookings.
From Flights to Hotels+
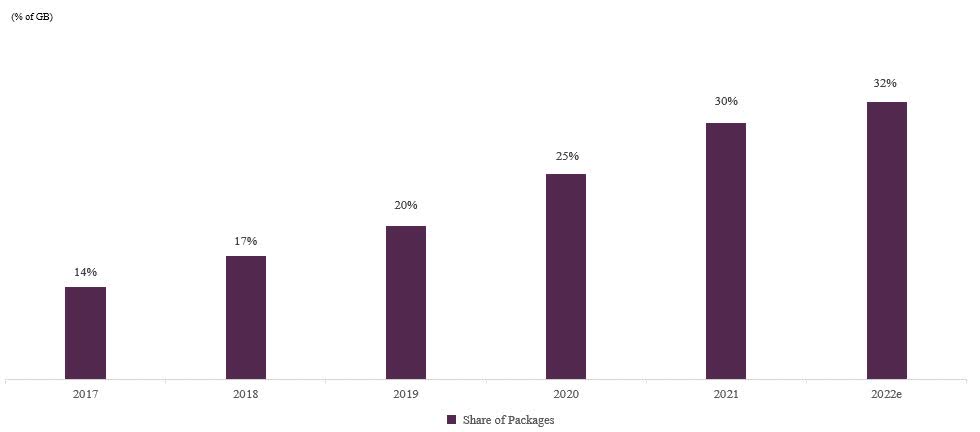
Despegar has grown substantially in product scope since launching as a flights-only travel agency in 1999. Following a decade of successful geographic expansion, the group extended its product offering to include hotels in 2009 and today offers vacation packages, vacation rentals, car rentals, and a variety of destination services. This has positioned Despegar as a true one-stop shop for consumer travel and has been a critical driver of profitability, as hotels and packages have significantly higher commission rates than air travel products. For instance, commission rates on flights are between two to five percent, while hotel commission rates can be up to twenty percent. Of note, Latin American travelers have a unique preference to spend their travel dollars on complete vacation packages, which has become a strategic focus at Despegar and the fastest growing product segment. Besides offering convenience and value to the consumer, bundling multiple products into a package with a single quoted price allows Despegar to opaque underlying fares and access rates that are often unavailable on a stand-alone basis. This dynamic not only increases effective commission rates but also provides travel suppliers with a way to manage slow-moving inventory. Share of packages as a percentage of gross bookings has more than doubled at Despegar since 2017, and margins on package sales have increased significantly. Finally, the inclusion of higher margin hotel products is essential to establishing platform value at Despegar. For example, while limited flexibility is offered by low margin flight products, Despegar can leverage the higher margin hotel product to offer targeted discounts and drive consumer engagement. If a customer booked a flight earlier in the year and is now looking to book a hotel, Despegar can offer that customer an exclusive discount to reward loyalty while still generating profit in the transaction. The same creativity is impossible with low single digit percentage commission rates on flight products. Moreover, platform value can benefit supply partners as well as customers. Despegar’s preferred partners program is a widely accepted tool for hotels to boost sales. Preferred partners invest an additional five to ten percent of their net sales price to participate, and Despegar leverages its demand steering capabilities to generate incremental bookings via: (i) preferred sorting and highlighting, ((ii)) higher awareness through marketing activities, and ((iii)) default selection for packaged products. Data shows that for an additional eight percent investment of net sales price, participating preferred partners increased their total bookings by more than forty percent, or a 200 percent return on capital.
Pasaporte Despegar
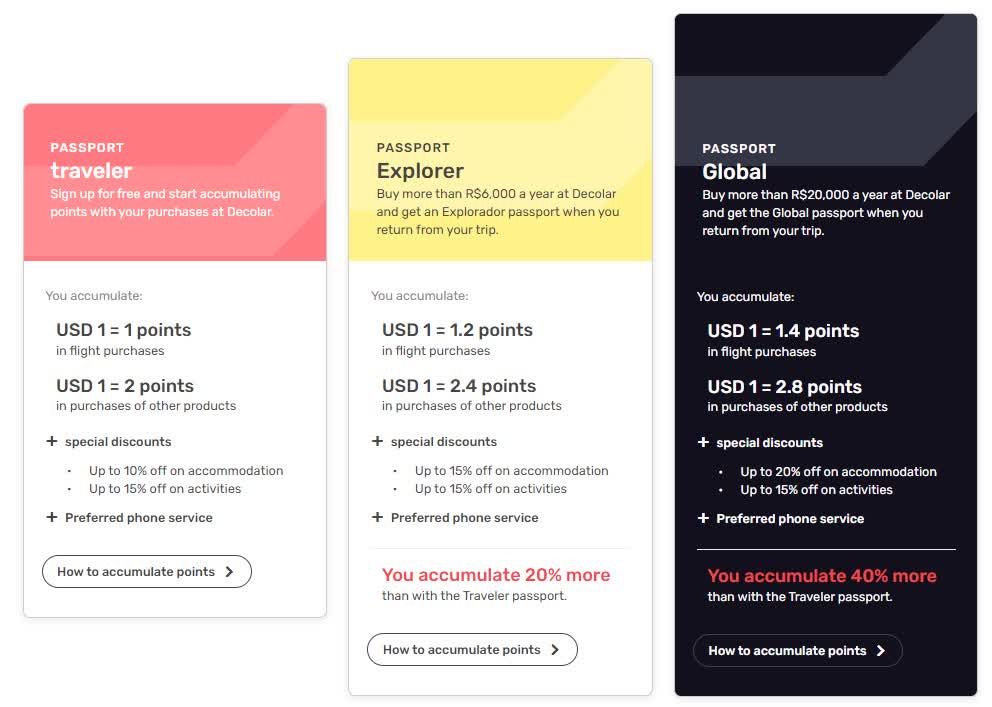
In 2019, Despegar launched its first loyalty program, Pasaporte Despegar. Although Expedia and Booking.com have had loyalty programs for several years, and large airlines and hotel chains for decades before that, there has been a renewed focus across the industry to invigorate loyalty programs to promote enduring customer relationships. Critically, OTA’s strategic position in the travel landscape offers important advantages for developing a comprehensive cross-product program. Reward points earned on hotels can be redeemed for flights and vice versa, points earned on one hotel can be redeemed across thousands of hotels, not only at a specified chain, points earned on flights can be redeemed on any airline, and consumers can often double-dip by earning airline miles on OTA booked flights. Pasaporte Despegar was launched in Brazil in 2019, Argentina in 2020, Mexico in 2021, and most recently Colombia and Ecuador in 2022. While still early days, the program has been a tremendous success as it has features that are tailormade for Latin America and is among the most generous with rewards points. There are three levels of Pasaporte membership: (i) Traveler, ((ii)) Explorer, and ((iii)) Global. All customers who register can immediately access the benefits of the Traveler Passport, which include 1 point for every dollar of flight purchases and 2 points for every dollar of non-flight purchases (i.e., hotels, car rentals, activities, etc.) plus up to ten percent discounts at participating hotels. Customers who spend more than $1,500 in a year are upgraded to the Explorer Passport that rewards 1.2 points for every dollar of flight purchases and 2.4 points for every dollar of non-flight purchases plus up to fifteen percent discounts at participating hotels. Finally, customers who spend more than $5,000 in a year obtain the Global Passport where they earn 1.4 points for every dollar of flight purchases and 2.8 points for every dollar of non-flight purchases plus up to twenty percent discounts a participating hotels. This program structure is significantly more attractive than Booking.com’s loyalty program that offers similar discounts at participating hotel properties but with no points and Expedia’s loyalty program that offers limited hotel discounts and fewer points. Notably, both Despegar’s and Expedia’s reward points have a monetary value of approximately one cent, which is on par with other loyalty programs offered directly by travel suppliers. In addition, there are no blackout dates to consider when redeeming Pasaporte Despegar points, and customers can use any combination of points and cash on any transaction. In tandem, Despegar has entered into strategic partnerships with local banks to launch cobranded credit cards in each market that reward Pasaporte points for everyday purchases and additional points for purchases made at Despegar. Co-branded cards have been launched with Santander (SAN) in Brazil, Banco Invex in Mexico, and ICBC in Argentina. Consumers can earn up to 2.5 points on everyday purchases and an additional 3.5 points on purchases made at Despegar, or an effective six percent reward for dollars spent at Despegar for Global Passport members. As of September 2022, Pasaporte Despegar has 9.3 million members, which is up from 1 million members in September 2021, and in markets where the program is fully deployed Pasaporte members account for seventy-five percent of all purchases.
Strengthening Via Consolidation
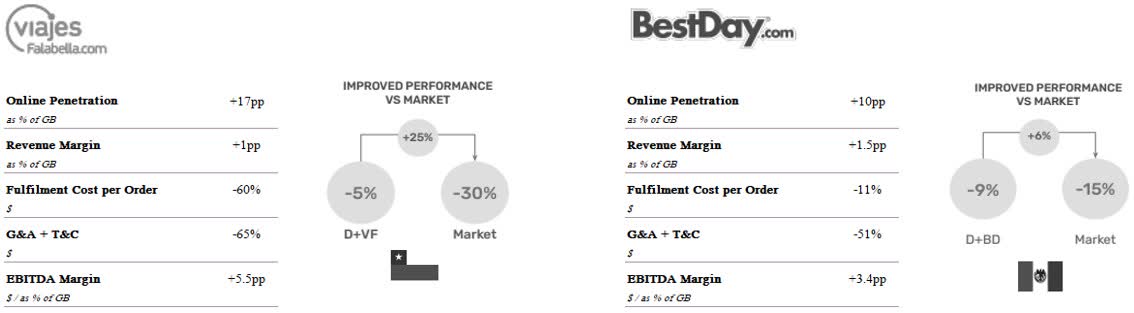
Despegar is a proven consolidator in the Latin American travel market. Over the last five years, the group has successfully acquired three regional travel agencies, a payments technology company, and a vacation rental channel manager. In the genre of competing travel agencies, acquisitions often come with a playbook of highly predictable synergies. For example, at the outset Despegar can merge travel supplier inventory and optimize the commercial agreements of overlapping suppliers. This enhances revenue margin, increases inventory selection, and at times offers an opportunity to cross-sell substantially higher margin hotel inventory into a previously flight-centric travel agency. In addition, Despegar has one of the most sophisticated and scalable technology platforms in the region made possible by over half a billion dollars of research and product development. This provides a unique competitive advantage, particularly in relation to regional acquirers. The group’s platform provides acquired companies with enhanced performance marketing capabilities, increased traffic conversion through data driven UX design, improved payment capabilities and fraud detection, and a lower cost of fulfillment. Furthermore, because Despegar already has local teams in all the countries where it makes acquisitions, substantial overhead costs can be eliminated. The result is an extremely high cashflow conversion per dollar of acquired revenue. For instance, consider Viajes Falabella, a Chilean travel agency that Despegar acquired in 2019 for $27 million. Viajes Falabella generated $50 million in revenue and $3.5 million in EBITDA in 2018, and while exact gross bookings were not disclosed, a twenty percent take rate would imply approximately $250 million in annual gross bookings. Despegar recently disclosed that after a successful integration they have increased the EBITDA margin as a percentage of gross bookings at the acquired company by 5.5 percentage points. In other words, on a base of $250 million of gross bookings and a post-acquisition EBITDA margin of 6.9 percent, Despegar’s adjusted purchase price multiple was less than two times. Similarly, Despegar agreed to acquire BestDay, a leading OTA in Mexico, for $57 million in 2020. BestDay generated $140 million in revenue and $8 million of EBITDA in 2019, and while gross bookings were not disclosed, a twenty percent take rate would imply approximately $700 million in annual gross bookings. Despegar disclosed that they shortened the integration time by a factor of three as compared to Viajes Falabella and that they have increased the EBITDA margin as a percentage of gross bookings at BestDay by 3.4 percentage points. Therefore, on a base of $700 million of gross bookings and a post-acquisition EBITDA margin of 4.5 percent, Despegar’s adjusted purchase price multiple was less than two times. While there is a relatively concise list of remaining regional OTAs Despegar would be interested to acquire, based on historical deal metrics and the group’s current market capitalization of $420 million, each $20 million of deployed capital in acquisitions would accrete more than two percentage points to shareholder free cash flow yield.
Building The B2B Platform
In company with its primary consumer travel business, Despegar has built a scalable B2B platform that is offered to other travel agencies and corporates. This enables the group to enhance monetization of its existing travel content, leverage increased scale to optimize supplier agreements, and collect more data on consumer travel habits. Despegar sells to third-party travel companies in two ways: (i) API connectivity offered to global wholesalers and OTAs, and ((ii)) an HTML solution for small and medium sized physical travel agencies across Latin America. Many of the largest players in global travel have API connectivity agreements with Despegar, including Expedia, Ctrip, Hotelbeds, and Restel. Furthermore, upwards of ten thousand affiliate travel agencies in Latin America access Despegar’s platform via HTML where they procure inventory at pre-negotiated rates. These affiliates generally earn commissions from Despegar, depending on traveler origin and type of product sold. At present, B2B sales to third-party travel companies account for approximately six percent of gross bookings, and Despegar believes this segment can grow to fifteen percent of total gross bookings by 2025. In addition, Despegar offers white label solutions that allow corporates from any industry to offer a travel platform, often for the redemption of loyalty points, while keeping customers in the ecosystem of their own brand. Despegar works with some of the region’s largest financial services firms, retailers, airlines, and hotels, such as Santander, BBVA, Nubank, Visa (V), LATAM Airlines (OTCPK:LTMAY), and Hard Rock Hotels. At present, white labels account for seven percent of gross bookings, and Despegar believes this segment can grow to ten percent of total gross bookings by 2025.
Payment Solutions – Installments
In Latin America, paying in installments has been prevalent for more than thirty years, and as a dominant form of payment it remains critical for retailers that wish to maximize their demographic reach. For context, fifty-four percent of ecommerce purchases in Brazil are paid for using an installment plan. These installments, known as parcelas in Brazil, cuotas in Argentina, and meses in Mexico, are offered “interest free” to consumers who pay off the balance in monthly intervals typically ranging from three to twelve months. They are offered either through a credit card provider or through an alternative financing provider, which can also allow cash a means of payment. For example, if a consumer has a $1,000 credit card limit, they can buy a $500 flight using a portion of their available credit line and spread the purchase over several installments. However, credit card penetration in Latin America is low, and the average credit limit for those who do have credit cards is normally only a few hundred dollars. Consequently, the existence of alternative financing providers allows consumers to pay in installments without a credit card or without using their available credit limit and allows for several methods of payment. For instance, Boleto Bancário is an official Brazilian push payment method regulated by the Central Bank of Brazil that generates 3.7 billion transactions per year, and accounts for nearly twenty percent of all online sales in the country. Consumers can select Boleto as a method of payment at checkout and are given a digital voucher with a barcode and payment details. This voucher can then be printed, enabling consumers to pay the amount owed in cash at thousands of locations across Brazil, such as a supermarket, convenience store, or post office. In addition, Boleto is often offered in an installment option by a financing provider in which consumers can make their scheduled Boleto payments in cash over the course of several months. Each country has its own unique cultural payment preferences, and integrating the broadest assortment of payment options requires extensive negotiating between the merchant and local financial institutions. Despegar offers nearly two hundred payment options on its platform, including a broad portfolio of installments and non-card payment methods. These unique payments capabilities are a meaningful competitive advantage versus global competitors, such as Booking.com, who do not offer installments and whose existing agency sales model would require wholesale change to provide financing solutions as the merchant of record. Crucially, all agreements with local financial institutions allow Despegar to offer installment plans without assuming collection risk from the customer.
Koin
In August 2020, Despegar acquired Koin, a fintech company that offers non-card installment payment solutions in Brazil. Despegar initially acquired eighty-four percent of the business through the capitalization of $4 million of owed receivables and the remaining sixteen percent for a $3.2 million cash payment. Notably, because Koin had operated on Despegar’s platform since early 2019, integration risk was limited.
The acquisition enabled Despegar to combine its best-in-class fraud and errors platform with a proven financing solution to use alternative payments as both a lever for customer acquisition and monetization. Moreover, the platform would combine Koin’s amassed credit underwriting data with Despegar’s information on 24 million travelers across Latin America to increase conversion and reduce NPLs. Over the longer term, Koin offers the potential to scale through three vectors: (i) deepening penetration of Despegar’s gross bookings in Brazil, ((ii)) expanding within Despegar to other geographies across Latin America, and ((iii)) offering payment solutions to third-party merchants. In Brazil, Koin’s conversion rates have improved by seven percentage points since being acquired, and its penetration of Despegar’s gross bookings has doubled to five percent. In addition, customers that purchase through Koin have shown to have higher ASPs, thereby enhancing profit per transaction, and are largely new customers for Despegar, which corroborates an expanding addressable market. Outside of Brazil, Koin announced its first geographic expansion into Colombia in 2022 via a partnership with Movii, the country’s largest digital challenger bank. While it is still early days, Colombia is a market ripe for disruption, and Despegar has secured a first-rate partner. Only fourteen percent of Colombian adults have access to credit and cash still accounts for nearly ninety percent of all transactions. Koin will enable Movii’s more than three million users to increase their purchasing power without being subject to the frictions of the traditional banking system. Finally, more than two hundred third-party merchants across Brazil have integrated Koin’s payment solutions. Third-party transactions now account for twenty-five percent of Koin’s transaction volume and are growing rapidly. Importantly, while this segment provides optionality to scale into a meaningful profit driver over time, the amplified dataset allows Koin to develop better risk engines at a quicker pace. Today, Koin has a run rate transaction volume of approximately $75 million and is expected require an additional $20 million in cash before breaking even in 2024 at substantially higher volume levels. Achieving profitability is principally a function of scale, iterating risk models, and driving repeat business from known customers. On a unit basis, the average Koin installment loan has a duration of four months and carries an additional take rate of sixteen percent, which offers a healthy margin of safety above expected loss rates.
Valuation
As of the third quarter 2022, Despegar showed that on an “as reported” basis its gross bookings had recovered to ninety-five percent of pre-pandemic levels. However, adjusting for BestDay and Viajanet, which were acquired in 2020 and 2022 respectively, it is reasonable to believe that Despegar’s pro forma gross bookings have a further twenty-five percent to increase before reaching actual pre-pandemic volumes. This is validated by industry data which shows that apart from Mexico most markets across Latin America have recovered between seventy-five and eighty-five percent of travel activity. In addition, owing to extensive cost overhauls that were completed during the pandemic, Despegar is exiting this side of the recovery with markedly more efficient and profitable operations. For example, the group was able to eliminate $100 million of annual fixed costs during the pandemic and has expanded its use of automation and other process improvements to maximize its cost structure. As a result, Despegar believes it can attain a level of profitability that is two times higher than its pre-pandemic margins as the industry continues to normalize.
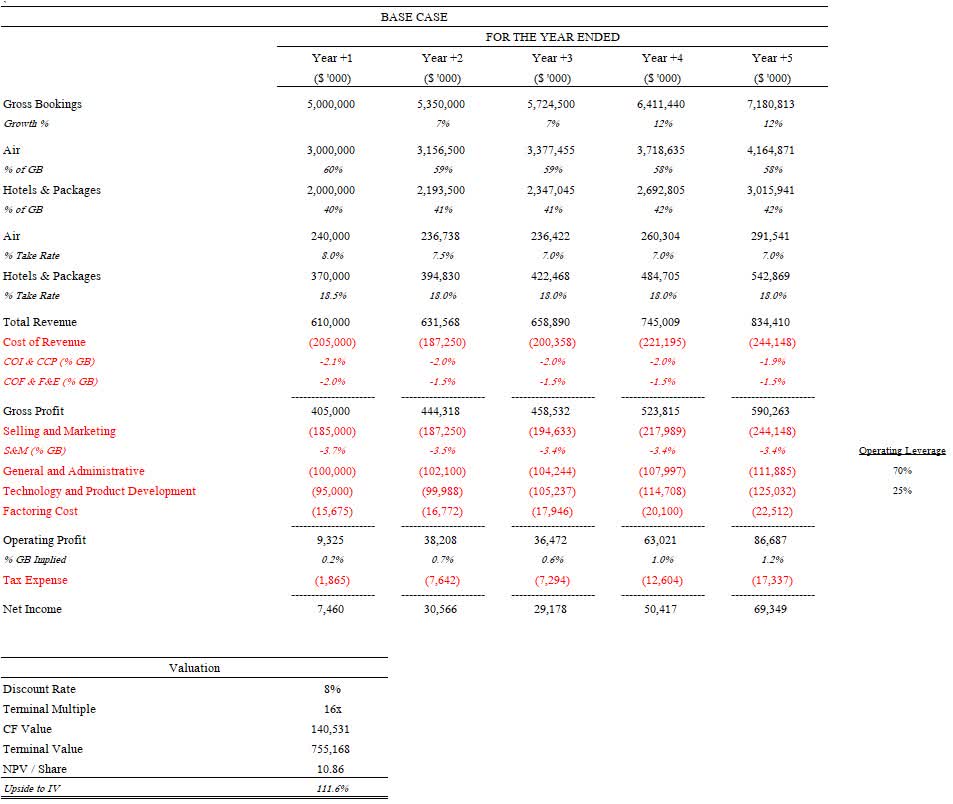
The base case scenario modeled above, though forecasting attractive shareholder outcomes, is conservative and implies that management misses on their stated five year guidance by nearly forty percent. Indeed, considering the year-end share price of $5.13, a figure lower than all but four trading days in 2020, there are several ways investors can win even if results fall short of management’s expectations. It is useful to investigate some examples of opportunities that exist across nearly every line item of the income statement. Within cost of revenue, a large expense is credit card processing fees. As non-card installment solutions, such as Koin, increase in penetration, hefty two percent merchant discount rates are eliminated. Consider that if Despegar can eliminate credit card processing fees on just ten percent of gross bookings, then this could generate an additional $10 million of annual cash flow, or 2.4 percent of the current market capitalization. Within selling and marketing expenses, Despegar’s loyalty program and its ability to migrate more consumers to its mobile app will be key drivers. Transactions that include Pasaporte point redemptions already account for five percent of transactions across the platform, and the share of transactions through Despegar’s mobile app, which reduces direct marketing costs by bypassing search, has roughly doubled from twenty-seven percent to forty-nine percent since 2017. By the numbers, Despegar has historically spent $12 per transaction on direct marketing costs. If loyalty initiatives can drive the per transaction costs lower by ten percent, then this would produce an additional $13.5 million of annual cash flow, or 3.2 percent of the current market capitalization. What is more, sales and marketing costs are expected to decrease even more substantially on a gross bookings basis as ASPs increase with the return of international travel and because one-third of marketing costs are fixed in nature. Finally, Despegar has a substantial base of highly controllable semi-fixed costs in the form of management and product development personnel. The group plans to manage this cost base to a growth of approximately half that of gross bookings. Therefore, Despegar’s current $200 million base of personnel cost is expected to produce an additional $1 million of cash flow for each one percent of growth in gross bookings. In other words, a single year of fifteen percent growth would generate $15 million in additional annual cash flow, or 3.6 percent of the current market capitalization. Of course, in practice I expect that Despegar will execute above our expectations on some of these initiatives, while failing to deliver on others. The company’s strong competitive position earned over decades in an industry marked by structural growth provides a forgiving backdrop. The output of the base case scenario is a share price of $10.86, or 111.6 percent upside to intrinsic value.
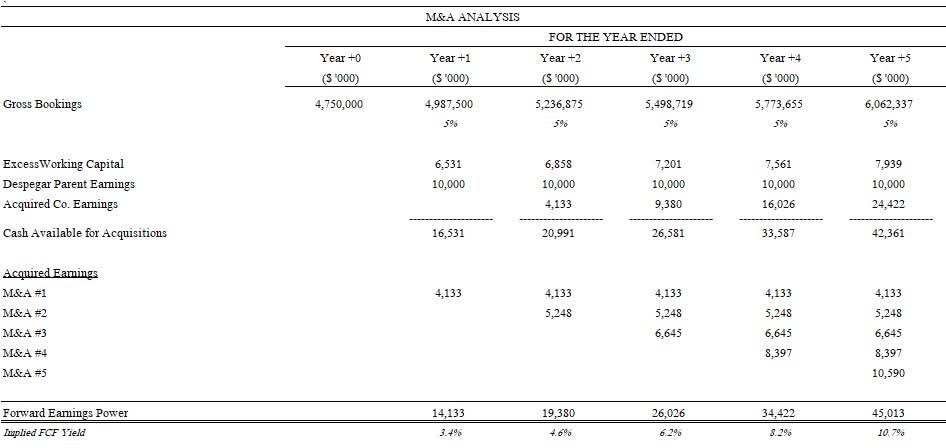
Recall that Despegar’s existing technology infrastructure provides a strategic platform for acquisitions. Although the base case scenario assumes no inorganic growth, even modest acquisition activity could produce significant shareholder value. For example, if Despegar were able to successfully reinvest its first three years of cash flow into acquisitions, economics of previous transactions suggest this could increase profits by thirty percent by 2027. In other words, at a 16x multiple this $60 million of deployed capital would translate into $360 million of incremental equity value. In another way, even if one imagined that Despegar would be limited to its run rate of $10 million in annual profits indefinitely (an unlikely scenario), we could assess the strategic value of the business as simply a platform for bolt-on acquisitions. Despegar maintains a healthy balance sheet, as its $150 million of redeemable preferred shares and roughly $125 million of other liabilities are offset by $263 million in cash. However, one notable qualifier is that Despegar also has a $150 million negative working capital balance. OTAs that operate under a merchant model generally have favorable cash cycle dynamics. For instance, Despegar will collect cash from travel customers at the time of booking but is only required to pay hotel suppliers once the stay occurs, which is often two or three months later. This excess cash provides an interim source of funding that increases as the business grows. Thus, while technically a liability, this working capital balance functions more like an asset, as it is expected to be a source, not use, of future cash. If gross bookings grow from the current base at five percent per annum, Despegar’s working capital balance would produce approximately $7 million in additional cash per year. Consequently, the company would have a base level of $17 million to complete acquisitions that would ramp up quickly over time as acquired earnings could be reinvested. The model below assumes that Despegar acquires target companies at 1x revenue, a premium to prior transactions, and that they are able to achieve a profitability level of three percent of gross bookings, a nearly fifty percent discount to Despegar’s first two acquisitions. The result is that within five years Despegar is able to leverage its platform to acquire $45 million in run rate earnings, or a roughly ten percent yield on the current market capitalization.
Finally, it is worth noting that Despegar would offer significant value to a strategic acquirer. At a market capitalization of $420 million, the company trades at approximately 0.7x revenue. This compares to Expedia, which has historically traded at 2.0x revenue, and Booking.com, which has historically traded at 5.0x revenue. Furthermore, Despegar’s established presence would secure a dominant competitive position for the acquirer in Latin America, offer the option to incorporate an extensive alternative payments infrastructure, and provide opportunities for cost synergy through consolidation. Expedia would be the natural acquirer, as it already owns eleven percent of the company’s common shares.
Conclusion
It is impossible to predict in advance where the burden of Mr. Market’s despair will be laid the heaviest. What we can control is to be a buyer on our own terms. Risk is not a characteristic inherent of all assets; it is relative to the price paid. We will continue to search for businesses that we believe are enduring, conservatively financed, and available for substantially less than intrinsic value. As noted at the outset, history indicates that we should not be surprised if this journey often leads us to unloved areas of the market. As always, I am happy to speak with you at length about any of our companies, and I remain grateful for your trust and partnership.
Appendix A: Realized Investments
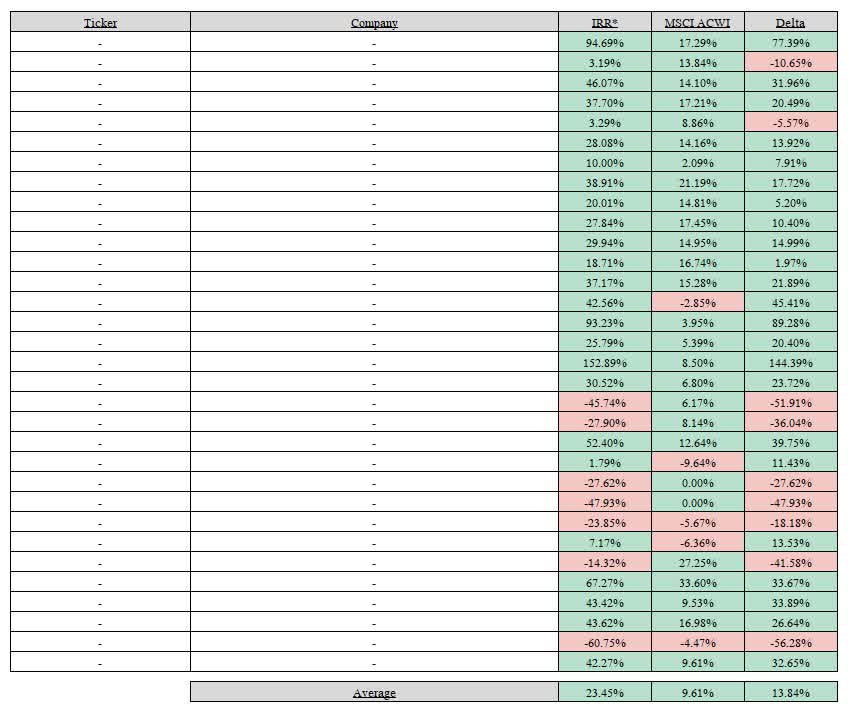
| *Table above reflects the IRR of realized portfolio investments (unannualized if < 1 Year), and the equivalent IRR that would have been achieved had each invested dollar been allocated to MSCI ACWI. *Full Disclosure Available Upon Request |
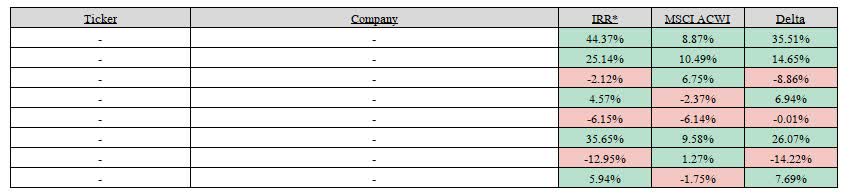
Appendix B: Unrealized Investments
|
*Table above reflects the IRR of unrealized portfolio investments (unannualized if < 1 Year), and the equivalent IRR that would have been achieved to date had each invested dollar been allocated to MSCI ACWI. *Full Disclosure Available Upon Request |
DisclosuresInvestment in Emeth Value Capital are subject to risk, including the risk of permanent loss. Emeth Value Capital’s strategy may experience greater volatility and drawdowns than market indexes. An investment in Emeth Value Capital is not intended to be a complete investment program and is not intended for short term investment. Before investing, potential clients should carefully evaluate their financial situation and their ability to tolerate volatility. Emeth Value Capital, LLC believes the figures, calculations and statistics included in this letter to be correct but provides no warranty against errors in calculation or transcription. Emeth Value Capital, LLC is a Registered Investment Advisor. This communication does not constitute a recommendation to buy, sell, or hold any investment securities. Performance NotesNet performance figures are for a typical client under the standard fee arrangement. Returns for clients’ capital accounts may vary depending on individual fee arrangements. Net performance figures for Emeth Value Capital, LLC are reported net of all trading expenses, management fees, and performance incentive fees. Reported returns prior to January 1st, 2021 reflect the personal account performance of Emeth Value Capital, LLC’s sole managing member, and therefore represent related performance. All performance figures are unaudited and are subject to change. ContactEmeth Value Capital welcomes inquiries from clients and potential clients. Please visit our website at emethvaluecapital.com or contact Andrew Carreon at acarreon@emethvaluecapital.com |
Editor’s Note: The summary bullets for this article were chosen by Seeking Alpha editors.
Editor’s Note: This article discusses one or more securities that do not trade on a major U.S. exchange. Please be aware of the risks associated with these stocks.
Be the first to comment