

Galeanu Mihai
 |
Foreword
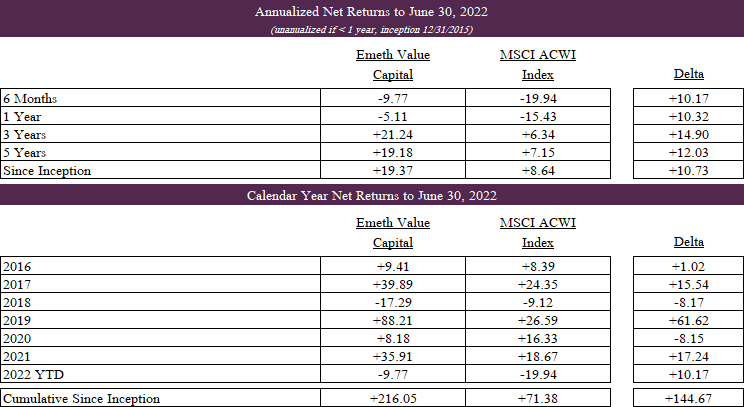
I intend to share the updated results at the outset of each letter. It is worth reiterating that I ascribe little significance to short-term results. I look out many years when making investments for the partnership and believe our results are best weighed using a similar time horizon.
Thinking in Bet [Types]
Dividing one number by another number is mere computation; figuring out what you should divide by what is mathematics. (Jordan Ellenberg)
A paradox in investing exists in that the act of constructing a portfolio literally requires one to “think in bets,” yet the question of how to size a position remains among the most frequently asked and perhaps most challenging problems to answer. It is not for lack of trying that we do not have a quantitative and universal guide to portfolio construction.
In 1956, John Kelly wrote an article in the Bell Systems Technical Journal titled “A New Interpretation of the Information Rate” that applied information theory to solve for how a gambler with inside information should optimally bet. In essence, his findings determined what fraction of their total bankroll a gambler should wager to maximize the growth rate of their wealth given a set of probabilities and payoffs. This formula, commonly referred to as the Kelly Criterion, is depicted below where “W” is the probability of a win, “B” is the profit in the event of a win, and “A” is the potential loss.
 |
It was not long before practical applications of the formula surfaced. In 1962, MIT mathematics professor Ed Thorp published Beat the Dealer, a systematic approach to overcoming the house edge in blackjack by applying the Kelly Criterion. The immense popularity and success of Thorp’s work ultimately forced casinos to modify the structure of twenty-one by including multiple decks and re-shuffling long before the end of the shoe.
More pertinent to this discussion, Ed Thorp would go on to found Princeton Newport Partners, one of the most successful market neutral hedge funds in history that generated a thirty year track record of twenty percent annualized returns without a single down year. Princeton Newport leveraged the Kelly Criterion to allocate assets, primarily in arbitrage and derivatives trading, and placed more than one and a quarter million individual “bets” over this timeframe.
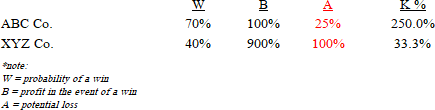
Though implementing the Kelly Criterion comes with challenges, namely that probabilities and payoffs themselves are inherently unknowable, assessing the recommended outputs given a set of theoretical conditions can yield powerful insights. For example, consider two hypothetical investments, ABC Co. and XYZ Co., that have a seventy percent probability of success and a forty percent probability of success, respectively.
Let’s assume that ABC Co. offers the opportunity to double our capital against a possible loss of twenty-five percent, while XYZ Co. offers the opportunity to return ten times our capital against a possible complete loss.
The Kelly Criterion would propose betting 250 percent of our bankroll given the probabilities and payoffs of investment ABC Co. and 33.3 percent of our bankroll given the probabilities and payoffs of investment XYZ Co. In other words for the higher-risk and higher-reward investment in XYZ Co., the optimal bet is to hold two times as much cash as capital at risk; whereas, the Kelly strategy recommends leveraging the bankroll two and a half times given an opportunity to invest in ABC Co.
 |
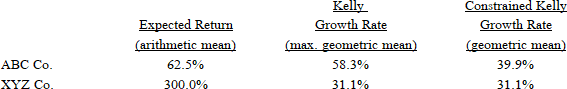
Now, suppose that we are currently placing bets on investments that look identical to ABC Co. and are suddenly offered the opportunity to split a portion of our bankroll and begin making bets on investments identical to XYZ Co. Should we take up this offer? To our amazement, we find that an initial assessment reveals the expected return of investment XYZ Co. is almost five times higher than our current investment in ABC Co. We predict that, given this extreme uplift in expected return, surely it must make sense to have some portion of our bankroll allocated to this higher-risk and higher-reward investment.
Thus, we sharpen our pencils further. We are shocked to find, after some needed assistance from Professor Thorp, that XYZ Co. is a lower quality bet and there is mathematically no way to size an investment that would produce sustainable returns as high as we are currently generating with ABC Co. Indeed, this is even the case had our current betting regime been constrained to operating without leverage.
The analysis shows that our optimal bet size of 250 percent on ABC Co. would, on average, grow our capital by 58.3 percent per bet, while if constrained to a maximum bet size of one hundred percent our capital could be expected to grow by 39.9 percent per bet on average. On the other hand, the optimal bet size of 33.3 percent on XYZ Co. would only produce a growth rate of 31.1 percent per bet on average, despite a vastly higher indicated expected return (i.e., arithmetic mean).
In a brief moment of disbelief, we run the numbers again using higher and lower bet sizes than the recommended 33.3 percent for XYZ Co. and find that every result leads to a growth rate lesser than 31.1 percent per bet. This is precisely because the optimal Kelly bet is found by solving for the maximum expected growth rate of wealth (i.e., geometric mean).
 |
This raises the question, if a newly offered investment were sufficiently attractive, how would one determine what percentage of the aggregate bankroll to allocate? Likewise, if one were able to reallocate the proceeds following each bet and there were numerous available bets to choose from, how would they determine which investments to select and how to optimally weight? Unfortunately, there are few satisfactory answers here.
The math becomes extraordinarily complex when introducing a needed term for co-variance and optimizing across multiple assets. However, we can still derive some insight by reframing the problem. Consider instead that our portfolio is a collection of equally weighted sub-manager portfolios that are tasked with selecting one investment and betting optimally.
Therefore, we know at a minimum the resulting portfolio in aggregate is optimized at the sub-portfolio level. Let’s reflect on how a portfolio would be structured if four sub- portfolios (a-d) contained high conviction investments with moderate downside risk, while one sub-portfolio ((e)) contained a highly asymmetric investment with substantial downside risk.
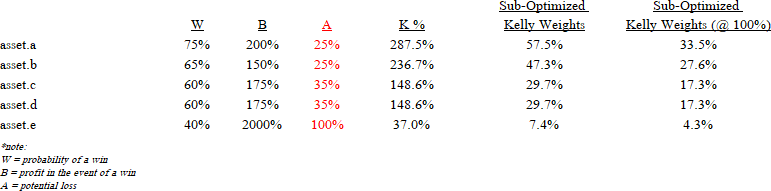 |
In this scenario, modeled in the graphic above, each investment has a sufficiently high expected growth rate to merit inclusion in the aggregate portfolio. For instance, the high-risk and high-reward investment contained in sub-portfolio ((e)) has an average expected growth rate that falls in the middle of the portfolio at 57.4 percent per bet (despite having an expected return that is more than seven times higher than the other portfolio assets).
We find that at the sub-portfolio level the optimal Kelly bet size ranges from 287.5 percent to 37.0 percent, which results in an aggregate sub-optimized portfolio that utilizes seventy percent leverage and contains position sizes ranging from 57.5 percent to 7.4 percent. In practice, we can rescale the portfolio to eliminate leverage, which yields position sizes ranging from 33.5 percent to 4.3 percent. So, what insights can we gather here?
Perhaps the most notable is the exceedingly high threshold for inclusion of a high-risk investment when benchmarked against an incumbent set of attractive, moderate-risk investments. In the scenario above, asset.e has a relatively high odds of success at forty percent and an extreme payoff skew at twenty-to-one, and it still only marginally crosses the threshold return level for inclusion. To illustrate this further, consider that if the probability of success declined to twenty-five percent for asset.e, still a reasonably high figure, a sixty-to-one payoff skew would be required to compete with the other portfolio assets.
A second insight is the proper sizing of a high-risk investment, assuming it does exceed the threshold for inclusion. In our hypothetical scenario above, the optimal position size for asset.e is four times smaller than the next smallest position and more than seven times smaller than the largest position. Furthermore, when the downside is substantial, we find that the upside potential has relatively little impact on the optimal position size.
For example, if the upside potential of asset.e increased tenfold, indicating a two hundred-to- one payoff skew, the optimal position size would only increase by thirty basis points. In closing, while the precise mathematical optimization of an investment portfolio is unrealistic, thinking about the type of bet an investment reflects is an effective way to leverage the insights of the Kelly Criterion for position sizing.
An unprofitable high growth software company operating in a new industry with numerous well-funded competitors is a fundamentally different investment (i.e., bet) than a triple net lease REIT with fifteen years of contractual cash flows. The temptation to overbet is at its peak when the prospects for sensational growth are greatest. However, we find that framing such an investment through the lens of the Kelly Criterion often underscores the timeless advice of Warren Buffett, “Rule No.1: Never lose money. Rule No.2: Never forget rule No.1.”
Diversified Energy Company Plc (OTCQX:DECPF)
Overview
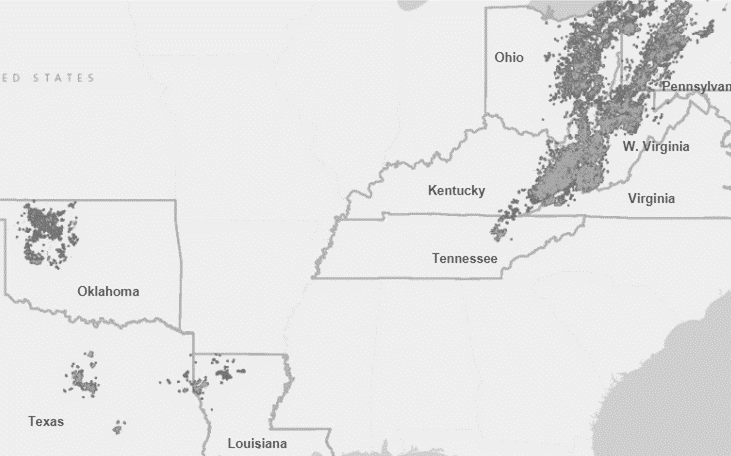
Diversified Energy is the largest owner of natural gas wells in the United States with approximately seventy thousand conventional and unconventional wells across the Appalachia, East Texas, Fort Worth, and Anadarko basins. The company is led by Rusty Hutson, Jr., who founded the business in 2001 and remains one of the largest shareholders of the group. Over the past two decades, Diversified has executed a consistent acquisition strategy by investing more than $2.5 billion in mature, long-life, and low-decline properties.
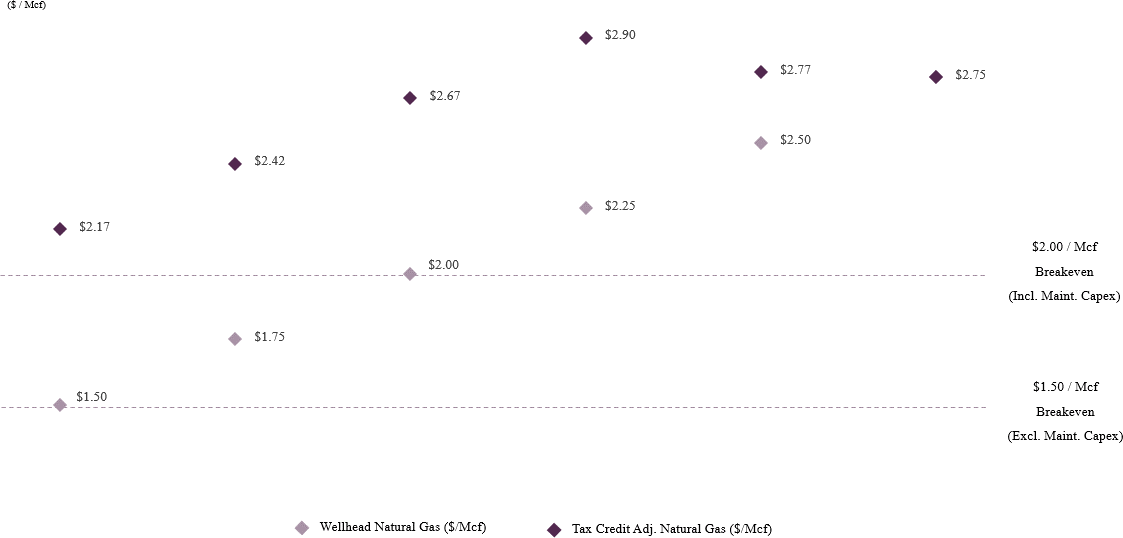
The group has a demonstrated track record of implementing its operational know-how to moderate decline rates post acquisition and has achieved significant reductions in operating costs per unit through building regional scale. Diversified is among the only publicly traded PDP acquirers in the energy space and possesses breakeven costs of less than $2.0 per Mcf.
Corporate History
Over the last century, more than four million oil and gas wells have been drilled in the United States. While less than half of those locations remain actively producing today, time has shown that attractively located properties can produce for multiple decades when operated efficiently. Even so, oil and gas field operations have been pushed to the wayside in the shale era. Unlike conventional drilling programs, horizontal wells that target deep, high pressure formations often produce seventy percent or more of expected ultimate recoveries within the first few years of production.
As a result, recent well vintages dominate an operator’s production base, leaving mature assets that have declined to a fraction of initial production starved for attention. In concert, the proverbial land grab for unconventional leaseholds intensified the desire for E&Ps to divest their legacy conventional properties beginning in the 2010s. Of critical importance to E&Ps, beyond price, was that buyers of their conventional assets were themselves proven and competent operators.
This was primarily because the drilling rights in deeper shale formations retained by the selling operator were preserved by continuous production of the legacy shallow formation assets. As a homegrown competitor with more than a decade of acquisition experience, Diversified soon became a consolidator of choice. The group began with a dedicated focus on the Appalachian basin, the oldest hydrocarbon producing basin in the United States, by bootstrapping more than $50 million of acquisitions of legacy conventional properties.
In 2017, Diversified went public on the London Stock Exchange and raised over $1 billion in equity to fund acquisition targets over the subsequent five years. More recently, Diversified extended its focus beyond the Appalachia basin to the Central Region, which comprises the East Texas, Fort Worth, Anadarko, and Arkmoa basins. This new region provides access to favorable Gulf Coast commodity pricing and an acquisition landscape of several hundred thousand gas-weighted wells. To date, Diversified has completed twenty-six acquisitions at an average purchase multiple of 3.1x cash flow.
 |
Smarter Asset Management (SAM)
Diversified Energy has developed rigorous field management programs to optimize production and reduce unit operating costs at acquired properties. These activities, known internally as Smarter Asset Management, are culturally embedded at Diversified and are important to offsetting or reducing natural well declines. Because the properties acquired are often non-core to the seller’s portfolio, and in some cases are outright neglected, acquisitions often provide Diversified with predictable targets for operational improvement.
Among other things, these optimization opportunities include returning idle wells to production, managing well pressures through compression adjustments, removing excess well fluids through plunger lift or swabbing techniques, reconfiguring the wellhead setup, modifying well additives, and improving the efficiencies of corresponding midstream systems. The daily implementation of these actions, while small in isolation, add up to substantial gains across Diversified’s expansive footprint.
For example, for a well that produces 20 Mcf of natural gas per day and declines at an average rate of five percent per year, the annual decline on this single well is 1 Mcf. If there is an opportunity to improve its production profile to 40, 70, or even 100 Mcf per day – this low cost workover activity has the effect of offsetting the natural decline of twenty, fifty, or eighty equivalent wells, respectively.
Nevertheless, for an E&P devoting hundreds of millions of dollars per year to drilling new wells, a project that can produce an extra thirty thousand dollars of cash flow per annum is unlikely to make it to the drawing board – irrespective of the return on capital.
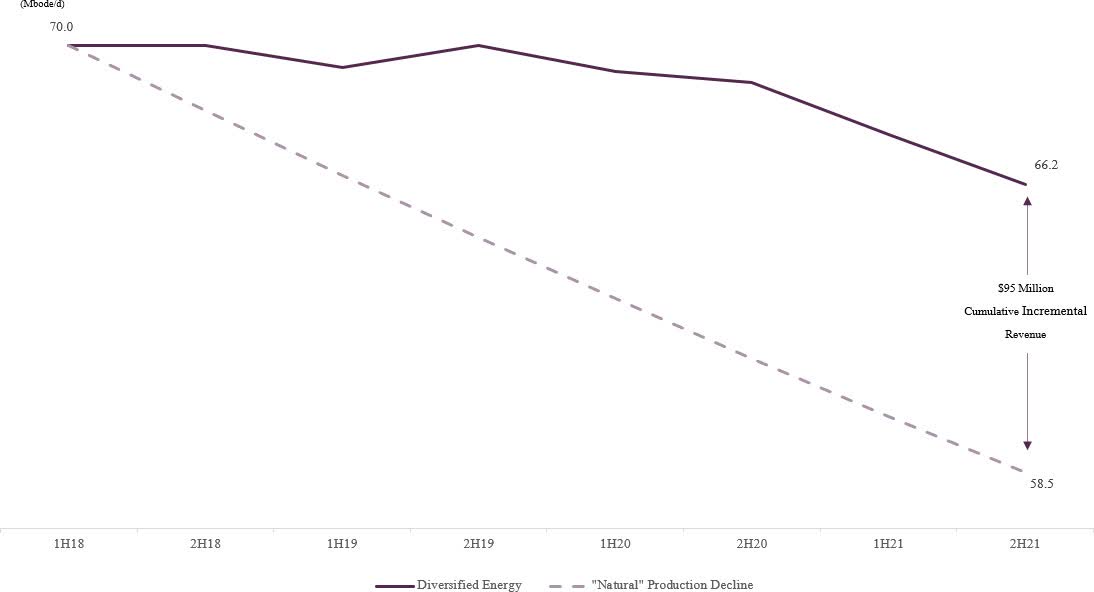
Diversified has a continuous pipeline of such projects where the dollar values are small, but the payback is measured in days. The value of the group’s SAM processes is evidenced in its conventional Appalachia assets, which since mid-2018 have been held to less than a two percent annual decline. This flattening of the natural decline has produced $95 million in excess revenue versus the engineered five percent decline curve on $901 million of acquisitions.
Furthermore, because these improvements are lasting step changes in well productivity, reverting to the engineered five percent decline would produce more than $700 million in cumulative excess revenue over the remaining economic life of the assets. Finally, Diversified does not underwrite acquisition targets with contribution expectations from SAM, but rather these improvements provide upside to purchases based on normal engineered decline curves.
 |
Capital Shortage
Capital cycle analysis, as it originally evolved at Marathon, looked to invest in companies from sectors where capital was being withdrawn and to avoid companies in industries where assets were increasing rapidly. (Marathon Asset Management)
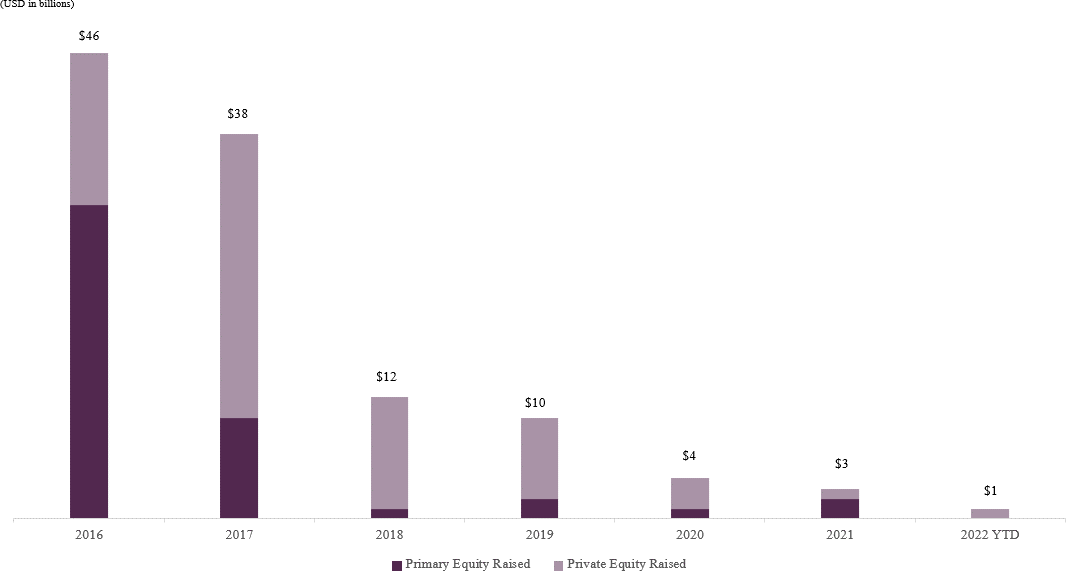
Over the last several years, the exodus of capital from the traditional energy sector, driven primarily by immense ESG pressure facing institutional capital pools, has created an attractive market dynamic for consolidation. Simply put, there are many more sellers than willing buyers of oil and gas assets. According to Enverus, capital raised by energy-dedicated private equity funds and upstream domestic public companies fell from more than forty billion pre-2018 to the low single digit billions over the past several years.
This historically low equity capital formation, along with an increasing supply of oil and gas assets for sale, has created a unique opportunity for buyers who remain at the deal table. The source of attractive target opportunities is diverse: private equity owners with prescribed holding periods are forced to seek liquidity, practically at any price, by LPs who no longer want energy exposure on their hands, Majors are divesting assets at the behest of environmental activist groups, and subscale E&Ps seeking a natural exit opportunity face Hobson’s choice.
As a result, Diversified now is able to acquire assets that have historically priced at valuations near PV10 for PV20 or greater with no value assigned to undeveloped acreage. Indeed, the two most recent transactions announced by Diversified were acquired at PV40 and PV27. From another perspective, non-fundamental selling pressures aside, Diversified’s acquisition strategy has also proven to work across commodity price environments. In low commodity price environments, non-core asset sales provide a needed source of capital for operators to moderate leverage and create liquidity.
Likewise, deal flow from distressed or bankrupt operators increases significantly. In high commodity price environments, non-core asset sales provide an attractive source of capital for operators seeking to increase the pace of development on their core leasehold. Consider that while operators may receive a relatively low multiple for selling PDP heavy assets, new drills on tier one acreage (e.g., Marcellus, Haynesville, etc.) can produce triple digit rates of return in a high commodity price environment.
 |
Oaktree Capital Partnership
In October 2020, Diversified Energy entered into a definitive participation agreement with Oaktree Capital Management, L.P., a $160 billion global alternative investment firm led by Howard Marks. The funding agreement provides $1 billion to jointly pursue large scale PDP acquisitions. The group and Oaktree each fund fifty percent of an agreed transaction in exchange for proportionate working interests of 51.25 percent and 48.75 percent, respectively. Diversified’s greater share reflects their upfront promote of 2.5 percent.
In addition, upon Oaktree achieving a ten percent unlevered IRR on its investment by acquisition tranche, Oaktree will convey a back-end promote to Diversified, which will increase the group’s working interest to sixty percent. To date, $427 million of the $1 billion commitment has been deployed across four transactions. These transactions were completed at a weighted average 1.94x multiple, some at valuations as low as PV40, and were predominantly underwritten when the long-term futures curve was substantially lower than current pricing.
Therefore, it is possible that the back-end promote will materialize within the first five years across several of these transactions, providing Diversified with enhanced economics for the decades of remaining life of the assets. Finally, for each transaction Diversified has both a right of first offer when Oaktree decides to divest, as well as a right to participate in any sale to a third-party at comparable terms. Because Oaktree’s own investment management vehicles have limited duration dates, each transaction completed today can be thought of as an inventory of future acquisition opportunities for Diversified in the future.
Diversified Midstream
Diversified Energy owns seventeen thousand miles of strategic midstream infrastructure that provides flow assurance, market destination flexibility, insulation from external transportation cost increases, and predictable third-party revenue. The infrastructure constitutes a vast majority of the gathering pipeline located in Kentucky and Southern West Virginia and transports half of the company’s aggregate Appalachia volumes.
When compared to third-party gathering and transportation costs typical in the Appalachian basin, Diversified’s owned midstream assets provide $35 million of cost saving per annum. For example, the group would incur $75 million of gathering and transportation costs to bring to market the 100 Bcf of gas it moves through its owned infrastructure at the market rate of $0.75 per Mcf.
On the other hand, the cash operating costs, including maintenance capex, for Diversified’s midstream assets are approximately $80 million per year, which are offset by $32 million in third-party gathering revenue, and $8 million of revenue uplift from re-directing volumes to higher priced end-markets. This amounts to a savings of nearly fifty percent for volumes processed on its own midstream infrastructure. From another perspective, Diversified’s midstream assets would be valued at several hundred million dollars on a standalone basis using conservative multiples.
Finally, Diversified’s midstream segment provides additional opportunities to implement its smarter asset management program to add value to acquired assets. Following the acquisition of Carbon Energy in 2020 for $107 million, Diversified identified an opportunity to construct a seven mile pipeline from a compression facility acquired in the transaction to the East Tennessee Natural Gas (ETNG) transmission pipeline. Unlike other regional gas markets in the Northeast that have experienced wide basis differentials, ETNG has historically priced at a premium to Henry Hub.
The project allowed Diversified to move an additional 9 Bcf of gas per year away from significantly negative basis differential markets to a positive basis differential market and resulted in a less than eighteen month payback on a total project cost of $4 million. In addition, earlier this year Diversified announced a two mile extension pipeline project that will increase its total gas routed to ETNG by fifty percent. As a result, nearly thirty percent of Diversified’s Appalachia volumes will be sold either to premium priced end-markets, or to industrial end-users and local distribution companies directly from the group’s midstream system.
Undeveloped Acreage
Owing to the extreme buyer’s market that has existed over the last several years, Diversified has been able to acquire a significant land bank of undeveloped acreage, principally consisting of conventional development opportunities, at effectively zero cost. The company’s extensive leasehold, which covers 8.2 million net acres, is held by production and provides a material opportunity for organic growth. These conventional development opportunities target shallow formations and as a result are inexpensive and quick to drill.
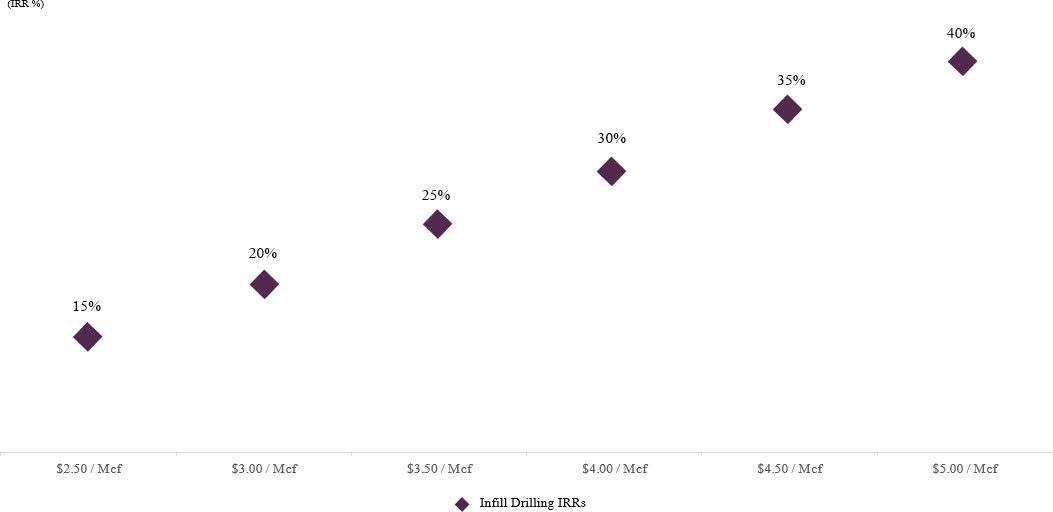
Diversified believes that, based on historic production data and its own experience developing over one hundred conventional wells, infill drilling can generate a thirty percent rate of return at $4.00 Mcf natural gas. However, while returns on new development become increasingly compelling in a high commodity price environment, Diversified has prioritized the vast inorganic opportunity set, which has offered higher returns on capital with less risk.
In either case, the group’s expansive leasehold provides strategic optionality in the event that acquisition markets become overheated, commodity markets enter a structurally higher price environment, or technological advancements offer new methods of recovering reserves. In addition, beyond infill drilling, Diversified’s substantial in place infrastructure of seventy thousand wellbores provides upside optionality. The stratigraphic columns in both the Appalachian and Central regions where Diversified’s properties are located often have numerous sedimentary formations stacked atop one another.
Many times, the group’s existing properties have additional productive formations up-hole from the producing formation, which allow Diversified to access completion opportunities without drilling a new well. These recompletion opportunities are low-risk, extremely capital efficient, and can provide outstanding rates of return in high commodity price environments.
 |
Too Small To Fail
In 2004, The American Jobs Creation Act was signed into law by President George W. Bush, which established, among other things, the marginal well tax credit. This countercyclical credit was implemented to provide a safety net of support for low production oil and gas wells in times of depressed commodity prices, like those witnessed in 1998 and 1999, thereby incentivizing operators to keep domestic production online. A marginal well, as defined in Section 451(C)(3), is one with an average production of less than fifteen barrel of oil equivalents per day, or ninety Mcf per day of natural gas production.
As it relates to natural gas production, the code provides up to a $0.50 per Mcf tax credit, adjusted for inflation, for the first eighteen Mcf of daily natural gas production from a marginal well. The full credit amount is available when the producer price index for natural gas at the wellhead averages below $1.67 per Mcf, adjusted for inflation, and is reduced proportionately until being entirely phased out at natural gas prices above $2.00 per Mcf, adjusted for inflation.
In 2021, the inflation adjustment factor is 1.3402, therefore a maximum tax credit of $0.67 per Mcf is available if average natural gas prices are below $2.24 per Mcf, and the credit is reduced proportionately until it is entirely phased out at average natural gas prices above $2.68 per Mcf. Notably, because all figures are inflation adjusted, both the maximum tax credit and upper limit natural gas price increase with time.
Because Diversified’s model centers around acquiring mature, low-decline assets, more than 120 Bcf of the group’s annual production, or roughly forty percent of aggregate volumes, qualifies for protection under the marginal well tax credit. In general, these credits carry back five years and carry forward twenty years. As of yearend 2021, Diversified has $183 million of deferred marginal well tax credits that expire between 2037 and 2041.
In other words, at a twenty-one percent tax rate, Diversified will not pay federal taxes on the next $871 million of profits – a substantial economic benefit for a $1.1 billion market cap company. In addition, once Diversified utilizes its tax credits and becomes a growing taxpayer, a substantial portion of the company’s volumes will be naturally hedged via prospective marginal well tax credits that could be applied retroactively five years.
 |
CSaaA – Capital Structure as an Asset
Upstream oil and gas companies often rely on reserve based lending (RBL) to finance their exploration and production operations. An RBL is a revolving credit facility that is secured by the value of an E&P’s oil and gas reserves. While RBLs provide low cost financing relative to other sources of capital like unsecured bonds, an RBL is exposed to increasing interest rates and is subject to redetermination risk. In particular, the borrowing base of an RBL is re-determined twice per year and is based upon the estimated future production and costs of the company’s proved reserves and the lender’s price outlook.
Accordingly, during periods of lower commodity prices where the underlying future value of the loan collateral (i.e., proved reserves) falls, the RBL simultaneously contracts, potentially when it is most needed. This procyclical dynamic wreaked havoc on independent oil and gas producers during 2019 and 2020. In contrast, Diversified has taken an innovative approach to structuring the liability side of its balance sheet. In 2019, Diversified pioneered the first asset backed securitization note (ABS) collateralized by hedged PDP assets.
Under this financing structure, Diversified transfers certain property interests into a bankruptcy remote special purpose vehicle that issues fixed-rate, long-dated notes collateralized by the assets of the SPV. These structures are generally eight to ten years in duration, amortize over the life of the note, and have fixed rates between five and six percent. Over the last four years, Diversified has completed six ABS financings, which resulted in the entirety of the group’s debt being free from redetermination risk, fixed-rate, long-term, and non-recourse to the parent.
As of mid-2022, Diversified had $1.4 billion in total gross debt with a weighted average remaining maturity of eight years and a weighted average interest rate of 5.4 percent. In addition, because this debt is solely collateralized by the group’s Appalachia and Barnett shale assets, Diversified retains an untapped $300 million RBL facility secured by the group’s remaining central region assets. To highlight the power of these structured financings, consider Diversified’s ABS IV. In July 2021, Diversified acquired assets in the Barnett shale from Blackbeard Operating for $166 million.
The assets were purchased at a 3.5x multiple, which would indicate an unlevered IRR in the mid-teens at strip pricing. In February 2022, Diversified completed ABS IV, which was wholly collateralized by the Blackbeard assets and generated
$160 million in cash proceeds with a 4.95 percent interest rate fixed for over eight years. In other words, for this particular transaction, Diversified was able to create a near risk-free investment by retaining all the upside from the underlying assets and refinancing out the entirety of the purchase price into a non-recourse structure.
Valuation
At current strip pricing, Diversified’s low-decline assets could be expected to produce $18 billion in revenue, inclusive of hedges, and $11.4 billion of field level cash flow in a wind-down scenario over the next few decades. Of this, approximately $1.8 billion would go towards scheduled debt repayments over the next nine years, and $4 billion would be used to fund general and administrative expenses, capital expenditures, and taxes over the economic life of the assets.
This results in more than $5.6 billion in remaining after-tax cash flow that would be used to satisfy asset retirement obligations and pay distributions to shareholders. If Diversified set aside one-third of its cash flow each year in a reserve account earning interest approximating investment grade corporate credit, then this capital, in addition to its $200 million of on balance sheet cash, would be sufficient to plug and abandon all of the group’s wells with a more than $1 billion surplus remaining at end of life.
The result for shareholders would be a payback of less than five years, a 4.3x multiple on capital, and a seventeen percent IRR. As an alternative, consider that Diversified could distribute its entire $1.1 billion market cap to shareholders between its $200 million in on balance sheet cash and the first two years of cash flow in a liquidation, which are ninety percent hedged and seventy percent hedged, respectively. This would give shareholders a free option on several billion dollars of cash flow across decades of remaining economic production.
However, as is the case with any attractive business, Diversified as an operating company is worth substantially more than liquidation value. There are hundreds of thousands of mature producing wells in Diversified’s target regions, few natural buyers, and the future target inventory is growing each year with twenty to twenty-five thousand new wells drilled annually across onshore U.S. Diversified has just begun to scratch the surface of the opportunity set within mature unconventional wells, which in terminal decline have similarly predictable production profiles and maintenance requirements but substantially greater production per wellbore.
In addition, because these wells are located geographically within Diversified’s existing footprint, the group is able to add this incremental production with very little incremental costs.
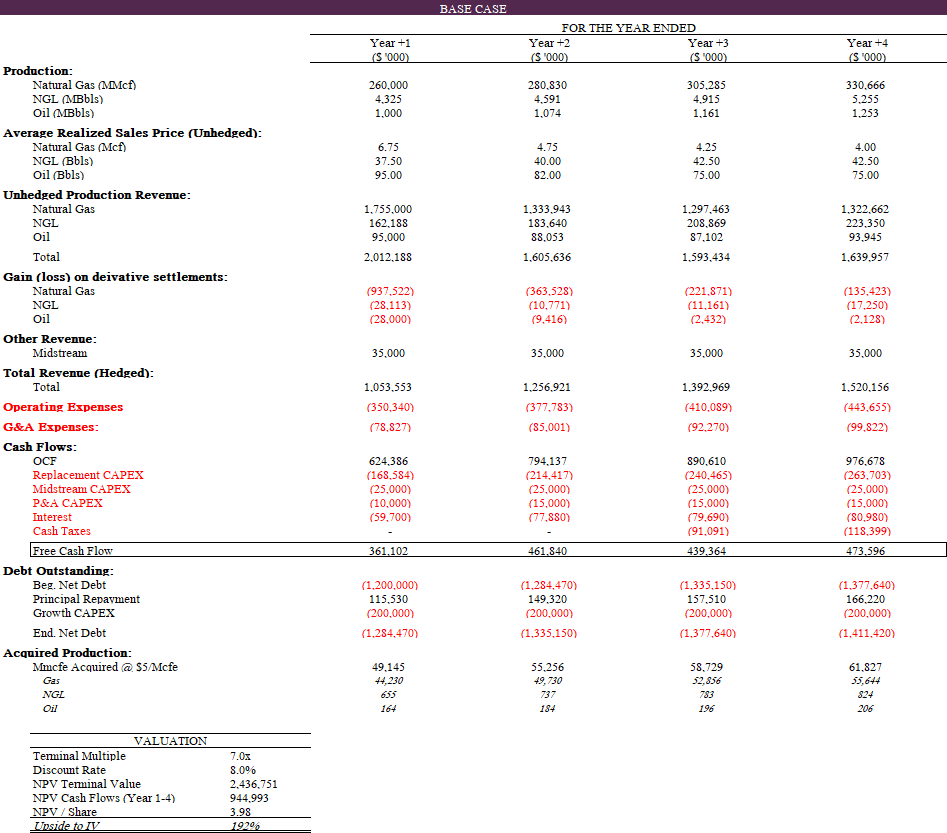 |
The base case scenario modeled above highlights a conservative estimation of Diversified’s intrinsic value. It assumes average realized sales prices at a discount to the current strip, zero additional operating leverage in base lease operating expenses and central expenses, and it ascribes no value to the Oaktree reversion promote, which alone could be $100 million to $200 million of value.
In addition, the model assumes Diversified replaces production and grows by acquiring new assets with a nine percent average annual decline at 3x cash flow underwritten at a flat $5/Mcfe strip price – terms which represent a premium to recently acquired properties. In aggregate, Diversified completes $1.7 billion in acquisitions over the four year modeled period, which is less than it completed over the prior four years, and deleverages from 2.0x to 1.5x EBITDA. Finally, an eight percent discount rate and a seven times terminal multiple is applied. The result is a USD share price of $3.98, or 192 percent upside to intrinsic value.
Asset Retirement Obligations
A subject that has continuously given investors pause is Diversified’s asset retirement obligations. As a large owner of mature wells, the company has substantial liabilities associated with safely plugging and abandoning (P&A) its existing infrastructure at end of life. The scarcity of transparent public data on decommissioning costs and the widely varying cost of retirement predicated on asset profile further contribute to investor anxiety.
For example, the cost to decommission a complex offshore oil and gas platform can be $10 million or more, while a shallow conventional gas well can be as low as $10 thousand to retire. In addition, publicly reported data on retirement costs often are collected from state plugging programs with grossly inefficient operations, which can have the effect of misrepresenting private operator plugging costs by multiples. The vast majority of Diversified’s well count consists of shallow conventional wells in Appalachia, which across the group’s nearly four hundred wells plugged to date have a demonstrated average cost to retire of $25 thousand per well.
As discussed previously, Diversified’s existing asset base provides significantly more cash flow than needed to fulfill its plugging obligations, even when considering highly punitive cost inflation expectations. However, consistent with its approach to its upstream and midstream operations, Diversified is actively working to attack costs in this segment. In early 2021, Diversified established its first internal plugging team in West Virginia to gain operational control over the retirement process and eliminate third-party contractor costs. In this pilot, Diversified’s plugging team was able to achieve a thirty percent cost savings compared with third-party service providers.
Following on this success, Diversified acquired two plugging businesses in the Appalachian basin, which expanded its internal well retirement team to nine crews and advanced on the group’s goal of establishing twelve in-house crews by 2023. Importantly, not only does this give Diversified the ability to meet its own near-term plugging commitments in a cost effective manner, but it positions the company to offer P&A services to other operators and state agencies as a revenue generating business line.
To highlight one notable opportunity, in 2021 President Biden signed into law the Infrastructure Investment and Jobs Act, which earmarked $4.7 billion of funds for states to properly identify, plug, and abandon orphaned oil and gas wells. Diversified already retires more wells than any operator in the Appalachian basin, and given that eighty percent of the cost of plugging a well is time-based, Diversified has a distinct competitive advantage in bidding on plugging jobs that are located geographically near its owned footprint and maintaining high uptime across its crews.
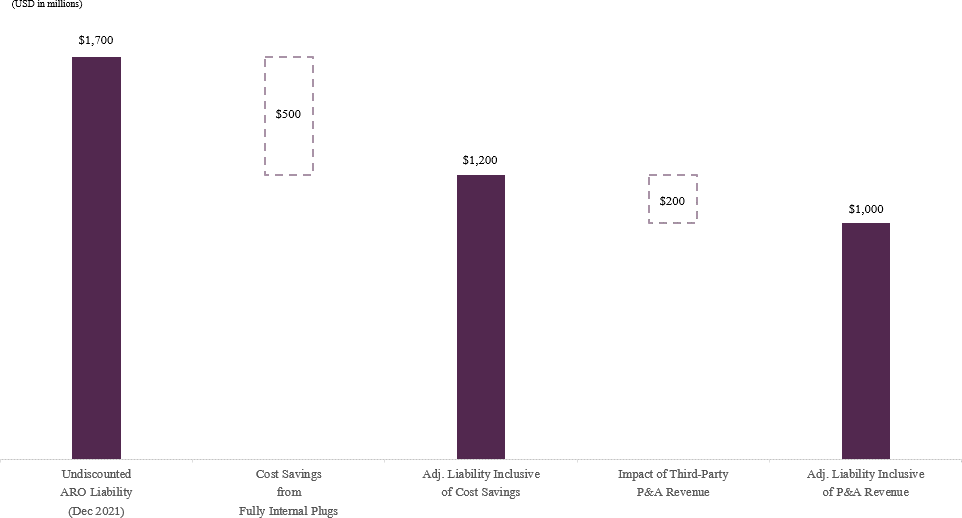
As of yearend 2021, the group had an undiscounted asset retirement liability of $1.7 billion. Therefore, the cost efficiencies gained from vertically integrating the plugging operations and the ability to offset retirement costs with third-party P&A revenue have the potential to drive hundreds of millions of dollars of long-term expense reduction, which flows directly into increased distributions for shareholders.
 |
ESG
Diversified is an ESG business hiding in plain sight. Beyond the company’s emerging P&A services, which support eliminating emissions from orphaned oil and gas wells, Diversified makes needed investments in its people and infrastructure to reduce emissions at acquired properties. These investments frequently go ignored by incumbent operators, and as a consequence mature infrastructure can sometimes fall into disrepair. By making non-core assets core again, Diversified’s model of stewardship restores long-term accountability for asset integrity.
Every month, Diversified’s well tenders visit over one hundred thousand well sites and proactively monitor for methane leaks using FLIR GT-44 handheld detection devices. These sensors are capable of detecting leaks as low as one part per million, or several hundred times smaller than the defined EPA threshold. In most cases, identified leaks can be repaired immediately and costs are limited to the labor expense. In addition, Diversified utilizes aerial LiDAR surveys to detect and repair leaks in its midstream infrastructure.
To point out the obvious, every leak that goes unrepaired is lost revenue for Diversified because natural gas is seventy to ninety percent methane. Therefore, continuously monitoring its infrastructure to ensure that as many molecules reach the sales meter as possible is simply good business. In 2021, Diversified reported an NGSI methane emissions intensity of 0.28 percent for its production assets (i.e., methane emission from natural gas ÷ methane content of natural gas throughput).
There are a plethora of environmentally focused media reports claiming that old wells are leaking a majority of their produced natural gas into the atmosphere. At a rate less than a third of one percent of production, inclusive of properly actuating pneumatics and venting, this could not be more false for Diversified’s portfolio.
Conclusion
To paraphrase Seth Klarman, risk often moves to the forefront of investor consciousness only when things are already going badly.
In good times, the euphoria of speculation buys up, in a very practical way, the rationality of those involved. No one wishes to believe that success is fortuitous or undeserved. However, when the music stops, losing money is generally the thing that makes investors worry about losing money. As a matter of course, our partnership focuses intensely on downside protection and stresses what we believe are realistic worst case fundamental outcomes across our portfolio. Many of our portfolio holdings have highly visible or contracted earnings streams and significant tangible assets.
As always, I am happy to speak with you at length about any of our companies, and I remain grateful for your trust and partnership.
Andrew Carreon | acarreon@emethvaluecapital.com
Emeth Value Capital | emethvaluecapital.com
Appendix A: Realized Investments
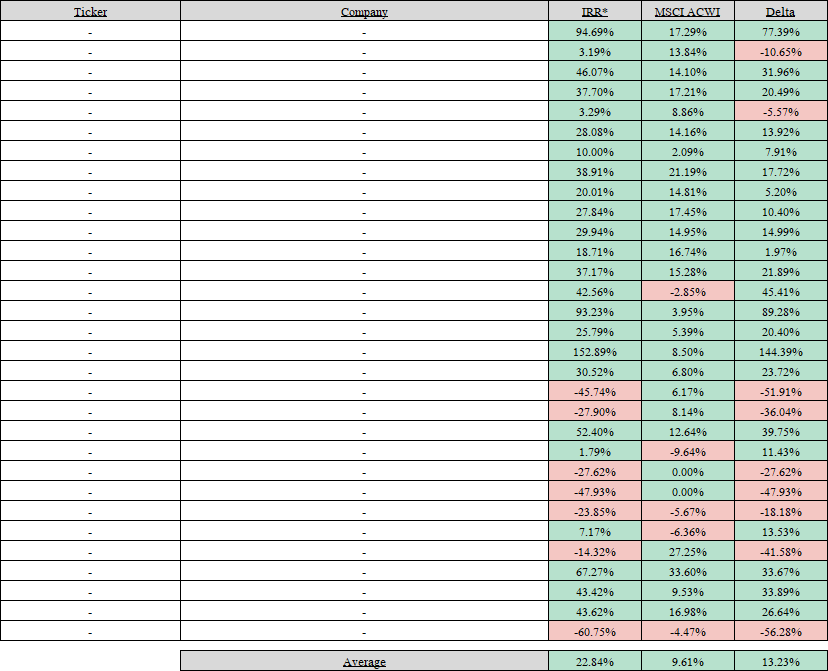 |
*Table above reflects the IRR of realized portfolio investments (unannualized if < 1 Year), and the equivalent IRR that would have been achieved had each invested dollar been allocated to MSCI ACWI.
**Full Disclosure Available Upon Request
Appendix B: Unrealized Investments
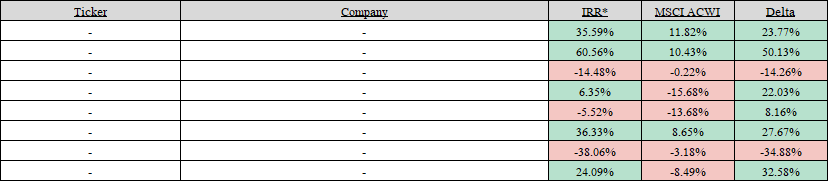 |
*Table above reflects the IRR of unrealized portfolio investments (unannualized if < 1 Year), and the equivalent IRR that would have been achieved to date had each invested dollar been allocated to MSCI ACWI.
**Full Disclosure Available Upon Request
Editor’s Note: The summary bullets for this article were chosen by Seeking Alpha editors.
Be the first to comment