

joebelanger
Introduction
The Vancouver-based Eldorado Gold Corporation (NYSE:EGO) released its second quarter 2022 results on July 28, 2022.
Note: This article is an update of my article published on July 18, 2022. I have been following EGO’s quarterly results on Seeking Alpha since January 2015.
EGO Map Presentation (Eldorado Gold)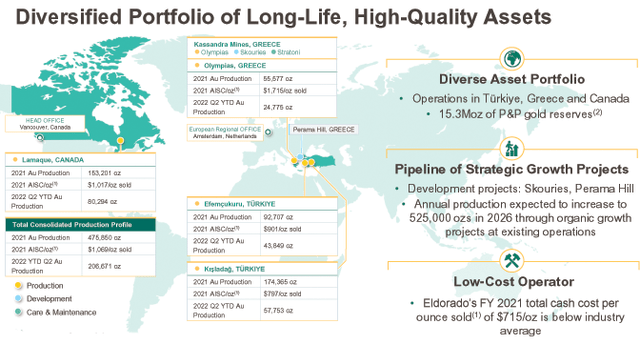
1 – 2Q22 Results Snapshot
Gold production came in at 113,462 Oz, down from 116,066 ounces produced in 2Q21 and up from 93,209 Oz delivered the preceding quarter.
The revenue for the second quarter of 2022 was $213.447 million on gold sales of 107,631 ounces. Net Income was a loss of $22.72 million in 2Q21, with cash operating costs of $789 per ounce sold.
Lamaque production returned to a healthy level this quarter, as shown in the chart below:
EGO Quarterly gold production per mine 1Q22 versus 2Q22 (Fun Trading)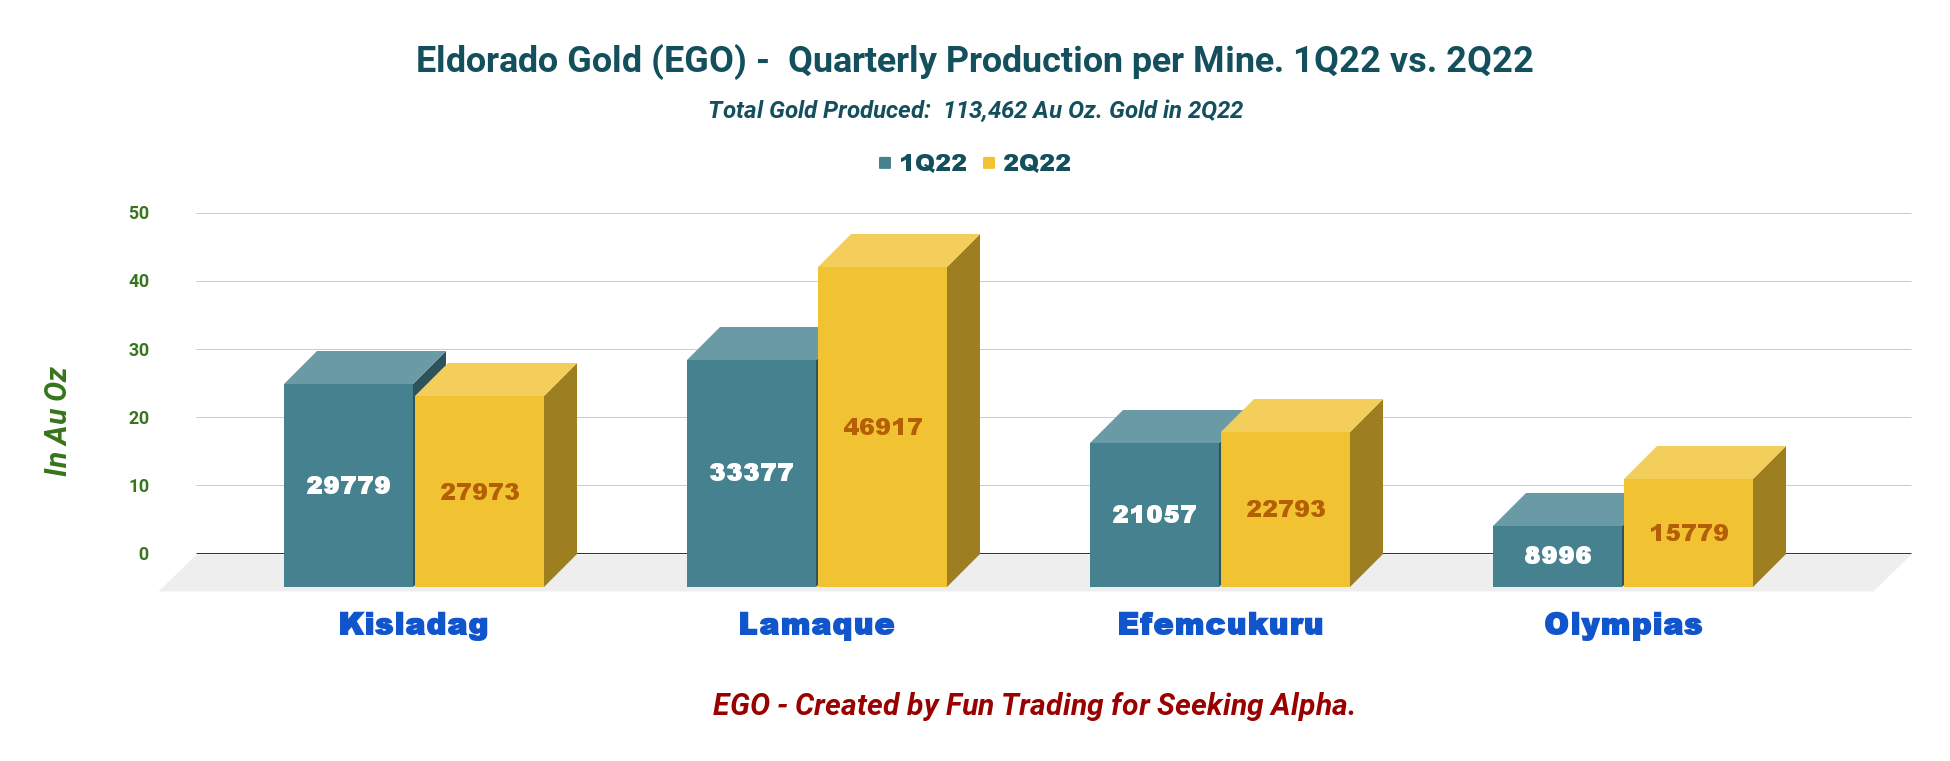
CEO, Georges Burns, said in the conference call:
Our team has worked hard in the face of several challenges at the start of the year. And I’m pleased to report that our performance improved in the second quarter. We had strong operating results from Lamaque and Efemcukuru this quarter, with improvements seen at Olympias. In the second quarter, ounces placed to the leach pad at Kisladag increased significantly, which would positively impact gold production in the third quarter. We maintained our original 2022 production guidance range of 460,000 to 490,000 ounces, and are tracking towards the lower end of that range.
2 – Investment Thesis
The investment thesis continues to be a challenging exercise for this gold miner. However, I believe the stock has sufficiently retraced and is attractive at or below $6.10.
On positive is that despite some issues, Eldorado Gold expects first-half production to be lower than second-half production but maintained the 2022 production guidance range of 460k to 490k ounces while raising AISC and Cash costs due to inflationary pressure.
EGO is about to develop Skouries after financing is secured, and it will be a strong catalyst.
EGO Main focus (Eldorado Gold)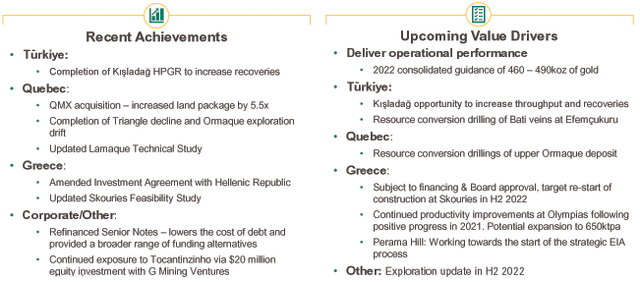
CEO Georges Burns said in the conference call:
Recently, we completed a purchase order for the tailings filter press, one of our long lead equipment items, which is in line with the feasibility study cost estimate. This reiterates our confidence in the initial capital estimate of $845 million to bring the Skouries project in the commercial production. Our Skouries financing discussions continue to advance.
We are evaluating all available options including joint venture equity partners, projects and debt financing through EU and Greek lenders as well as the EU Recovery and Resiliency Fund and metal streams. Our focus in selecting a financing package will continue to be driven by value optimization and de-risking for the future. We look forward to updating the market as we continue to work towards financing and board approval for the restart of construction at Skouries in the second half of 2022.
Thus, I believe it is an excellent time to take advantage of the low stock price and start a slow long-term accumulation. But, because a highly volatile environment characterizes the gold sector, short-term trading using the LIFO method is required to make this investment worthwhile.
The solution is to trade EGO short-term LIFO using at least 40% of your entire position, while keeping a core long-term position. This two-level strategy has prevailed in my marketplace, “The Gold And Oil Corner,” and I believe it is the most rewarding. However, only US investors can use LIFO. Please read my note at the end of this article.
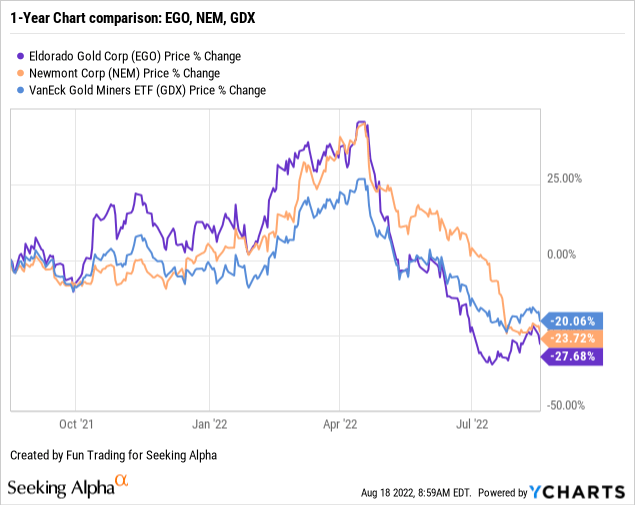
3 – Stock Performance
The stock has underperformed the VanEck Vectors Gold Miners ETF (GDX) and Newmont Corp. (NEM) and is now up 28% on a one-year basis. After early April, the entire sector dropped precipitously when the Fed started to hike interest.
Eldorado Gold – 2Q22 Balance Sheet And Gold Production: The Raw Numbers
| Eldorado Gold | 2Q21 | 3Q21 | 4Q21 | 1Q22 | 2Q22 |
| Total Revenues (metals sales) In $ Million | 233.22 | 238.44 | 244.64 | 194.67 | 213.45 |
| Net Income in $ Million | -55.74 | -52.22 | -43.1 | -316.82 | -22.72 |
| EBITDA $ Million | 2.24 | 106.81 | 107.82 | -319.26 | 74.91 |
| EPS diluted in $/share | -0.31 | -0.29 | -0.22 | -1.74 | -0.12 |
| Cash from Operating Activities in $ Million | 37.05 | 105.80 | 113.17 | 35.24 | 26.94 |
| Capital Expenditure in $ Million | 74.16 | 64.44 | 82.5 | 52.00 | 83.18 |
| Free Cash Flow in $ Million | -37.11 | 41.36 | 31.11 | -16.75 | -56.25 |
| Total Cash $ Million | 410.73 | 461.20 | 481.49 | 434.87 | 370.11 |
| Long-term Debt in $ Million | 426.31 | 497.73 | 497.87 | 497.92 | 497.98 |
| Shares outstanding (diluted) in Million | 181.60 | 183.95 | 182.52 | 182.36 | 183.78 |
| Eldorado Gold Production Au Oz | 2Q21 | 3Q21 | 4Q21 | 1Q22 | 2Q22 |
| Production gold Au Oz | 116,066 | 125,459 | 122,582 | 93,209 | 113,462 |
| AISC in $/ounce sold | 1,074 | 1,133 | 1,077 | 1,347 | 1,270 |
| Gold Price in $/ounce sold | 1,835 | 1,769 | 1,776 | 1,889 | 1,849 |
Source: Company filing and Fun Trading files.
* Revenues include “Gain on revaluation of derivatives in trade receivables in gold and other metals,” and total revenues from metals sales were $216.50 million.
Note: More data are available to subscribers only.
Part I – Balance Sheet And Production Discussion
1 – Revenues for 2Q22 were $213.447 million
EGO Quarterly Revenues history (Fun Trading)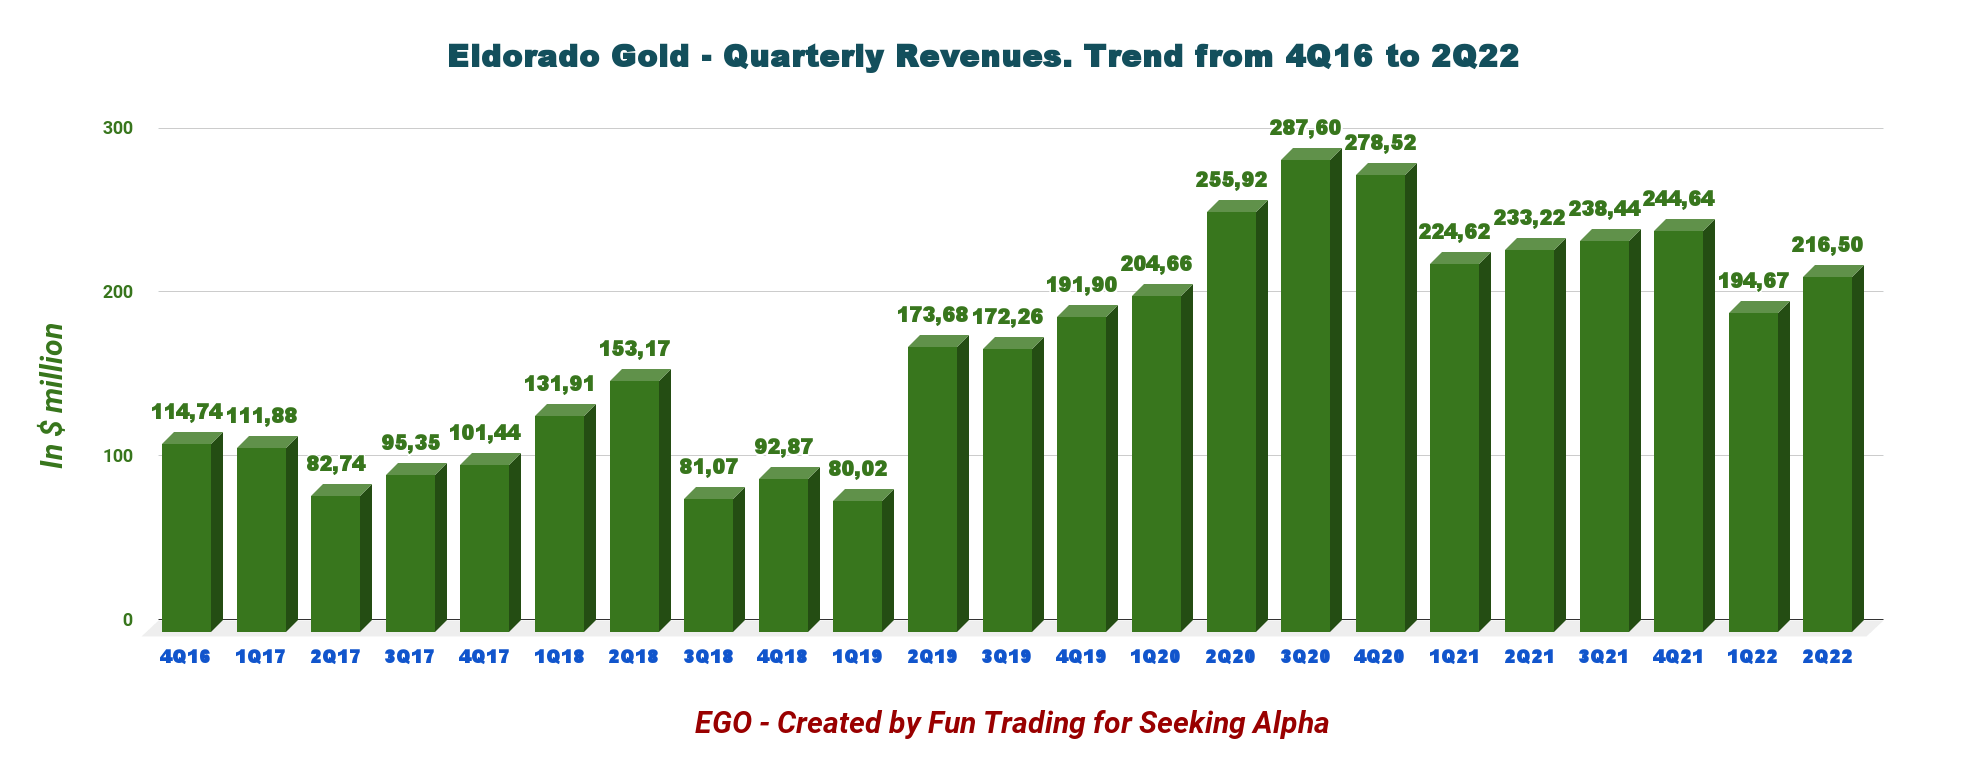
Revenues were $213.45 million, down from $233.22 million the same quarter a year earlier and up 8.8% QoQ.
The company recorded a net loss to shareholders in the second quarter of $22.72 million, or $0.12 per diluted share.
Gold sold this quarter was 107,631 Au ounces. The company sold its gold at $1,849 per ounce. The adjusted net earnings for the quarter were $13.8 million, or $0.08 per share.
EGO Quarterly Gold price realized history (Fun Trading)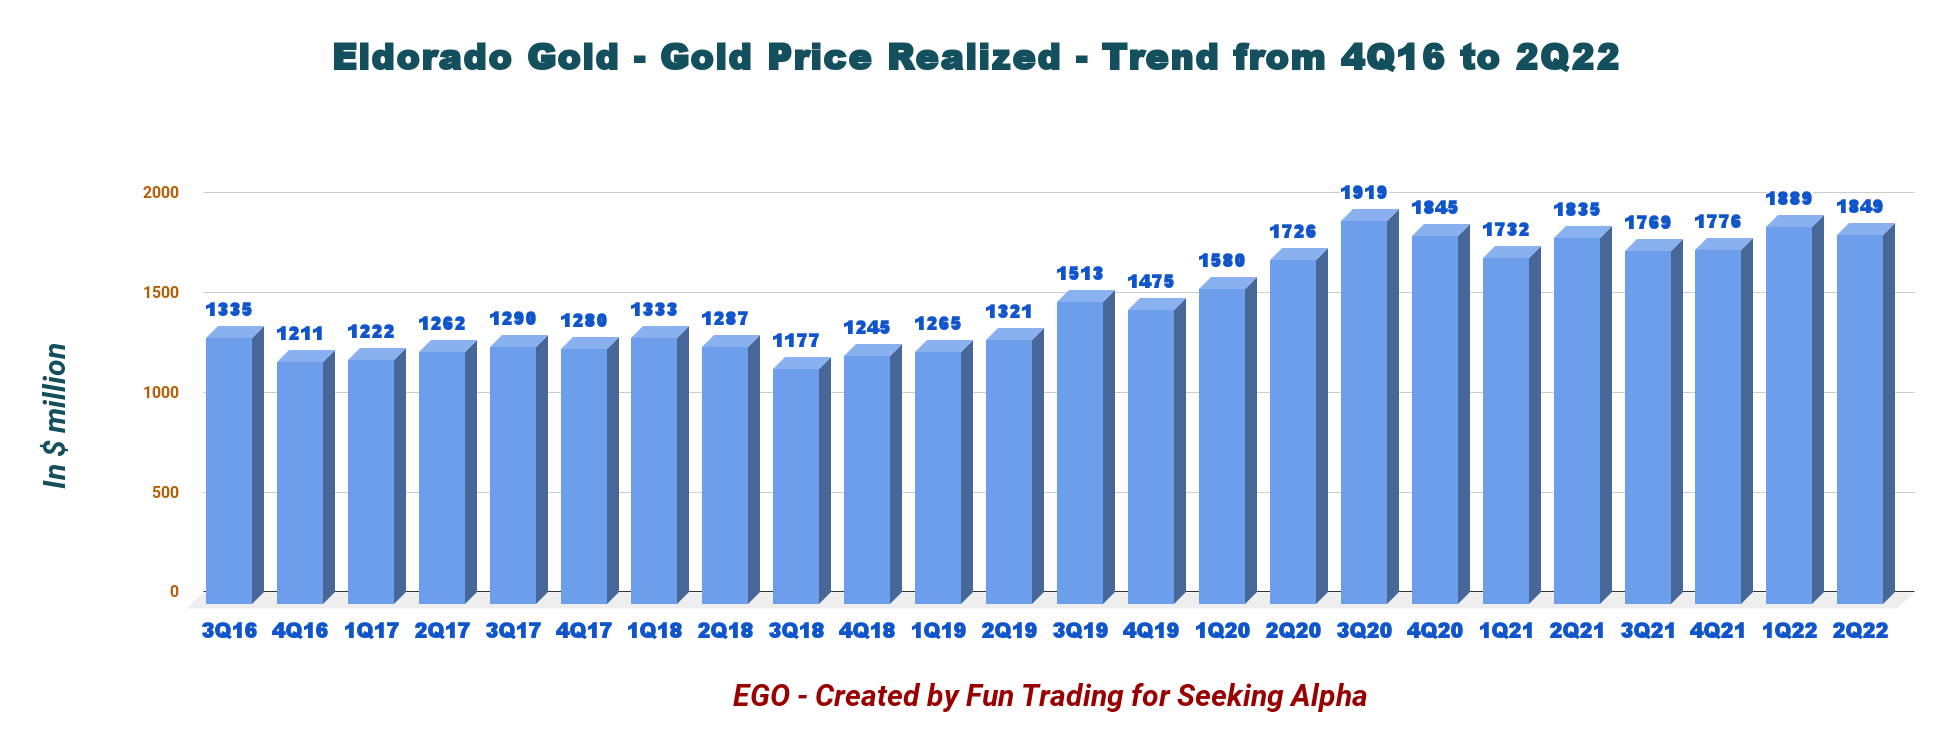
2 – Eldorado Gold’s net debt is $127.87 million in 2Q22
EGO Quarterly Cash versus Debt history (Fun Trading)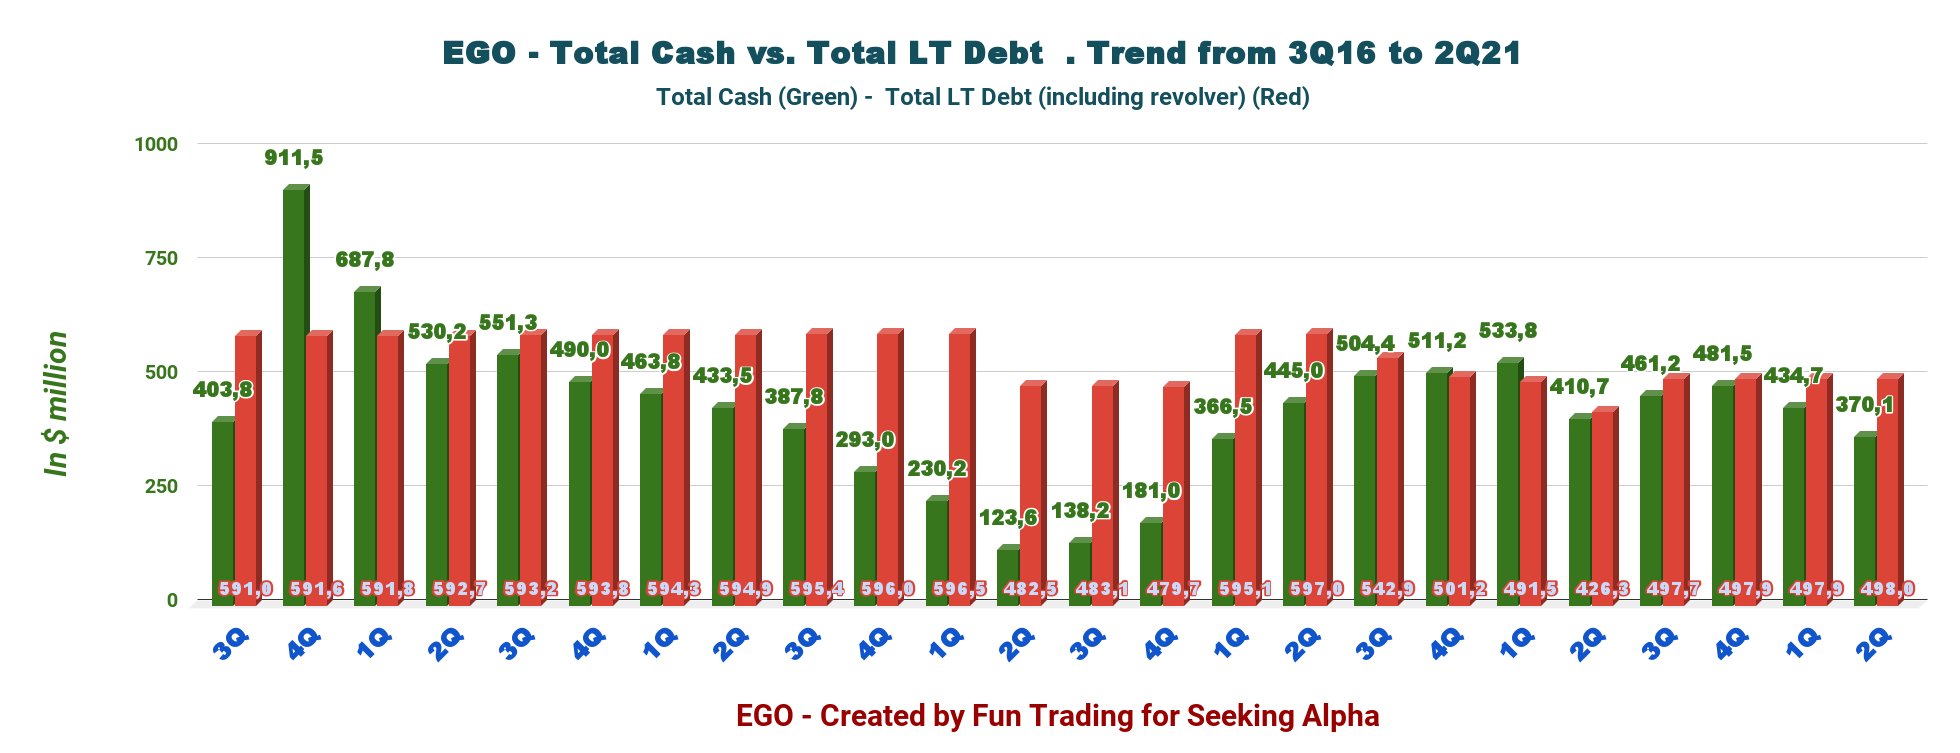
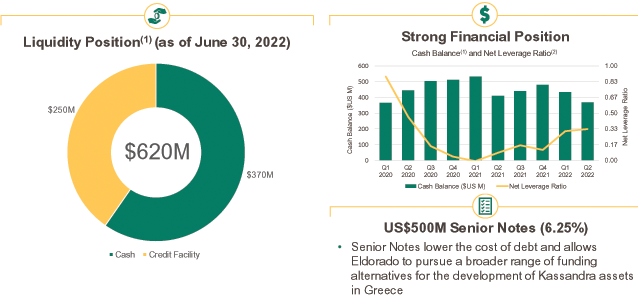
Total cash this quarter stands at $370.11 million, down from $434.87 million in the previous quarter. Total debt, including current, stands at $497.98 million. Total liquidity is $620 million.
Total cash is climbing again.
EGO Quarterly Cash history (Fun Trading) Below is a balance sheet presentation as of June 30, 2022: EGO Balance sheet presentation (Eldorado Gold)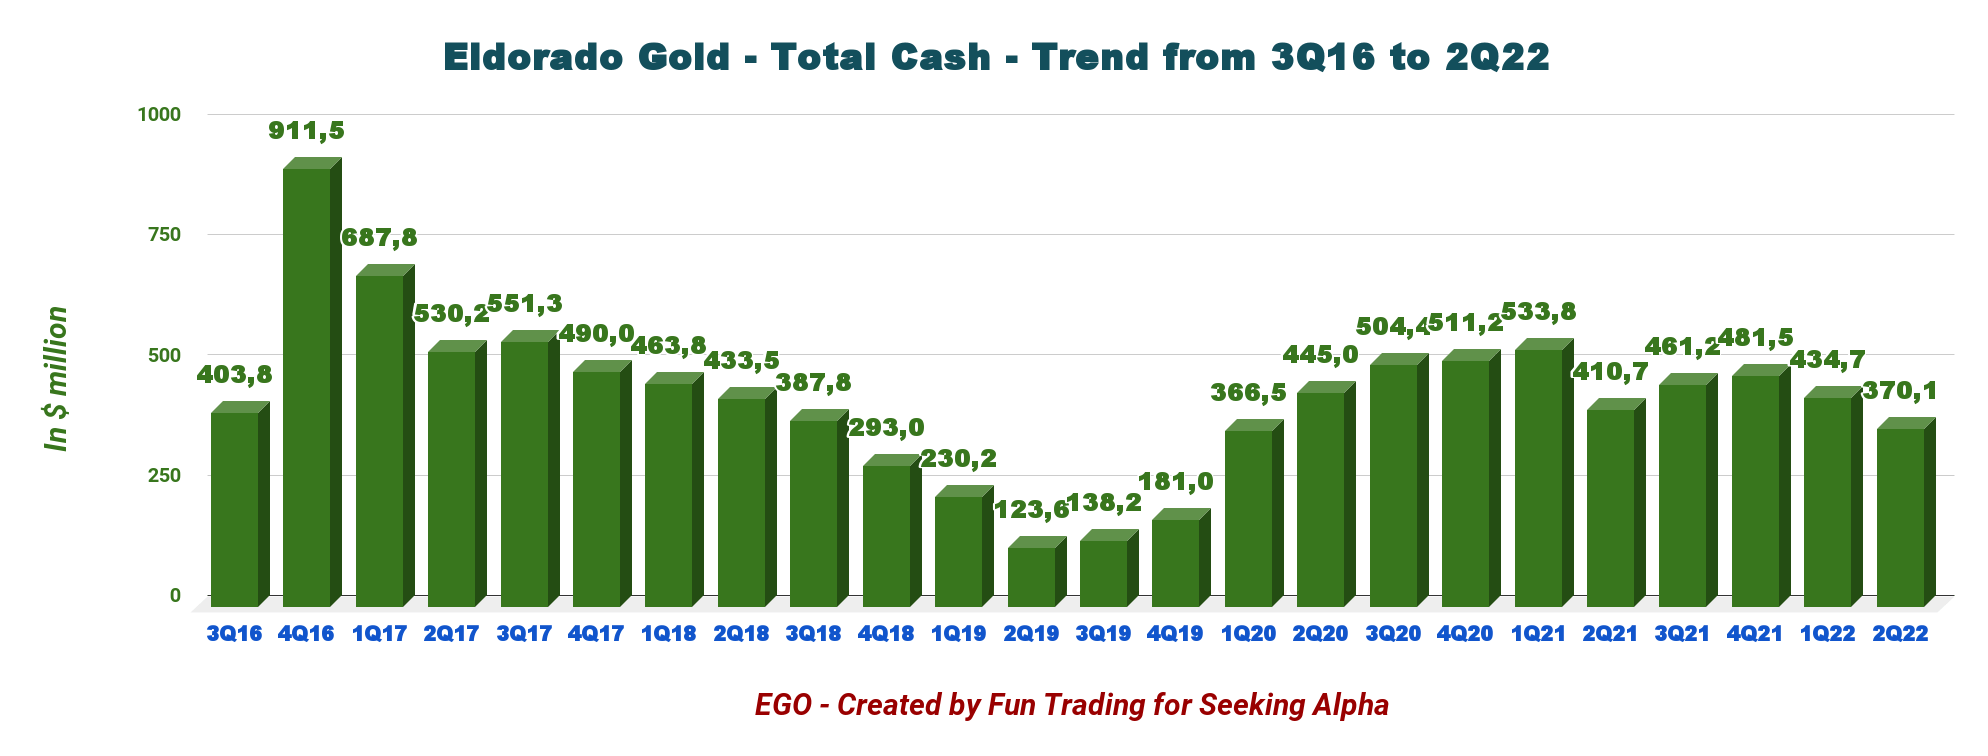
3 – The free cash flow was a loss of $56.25 million for the second quarter of 2021
EGO Quarterly Free cash flow history (Fub Trading)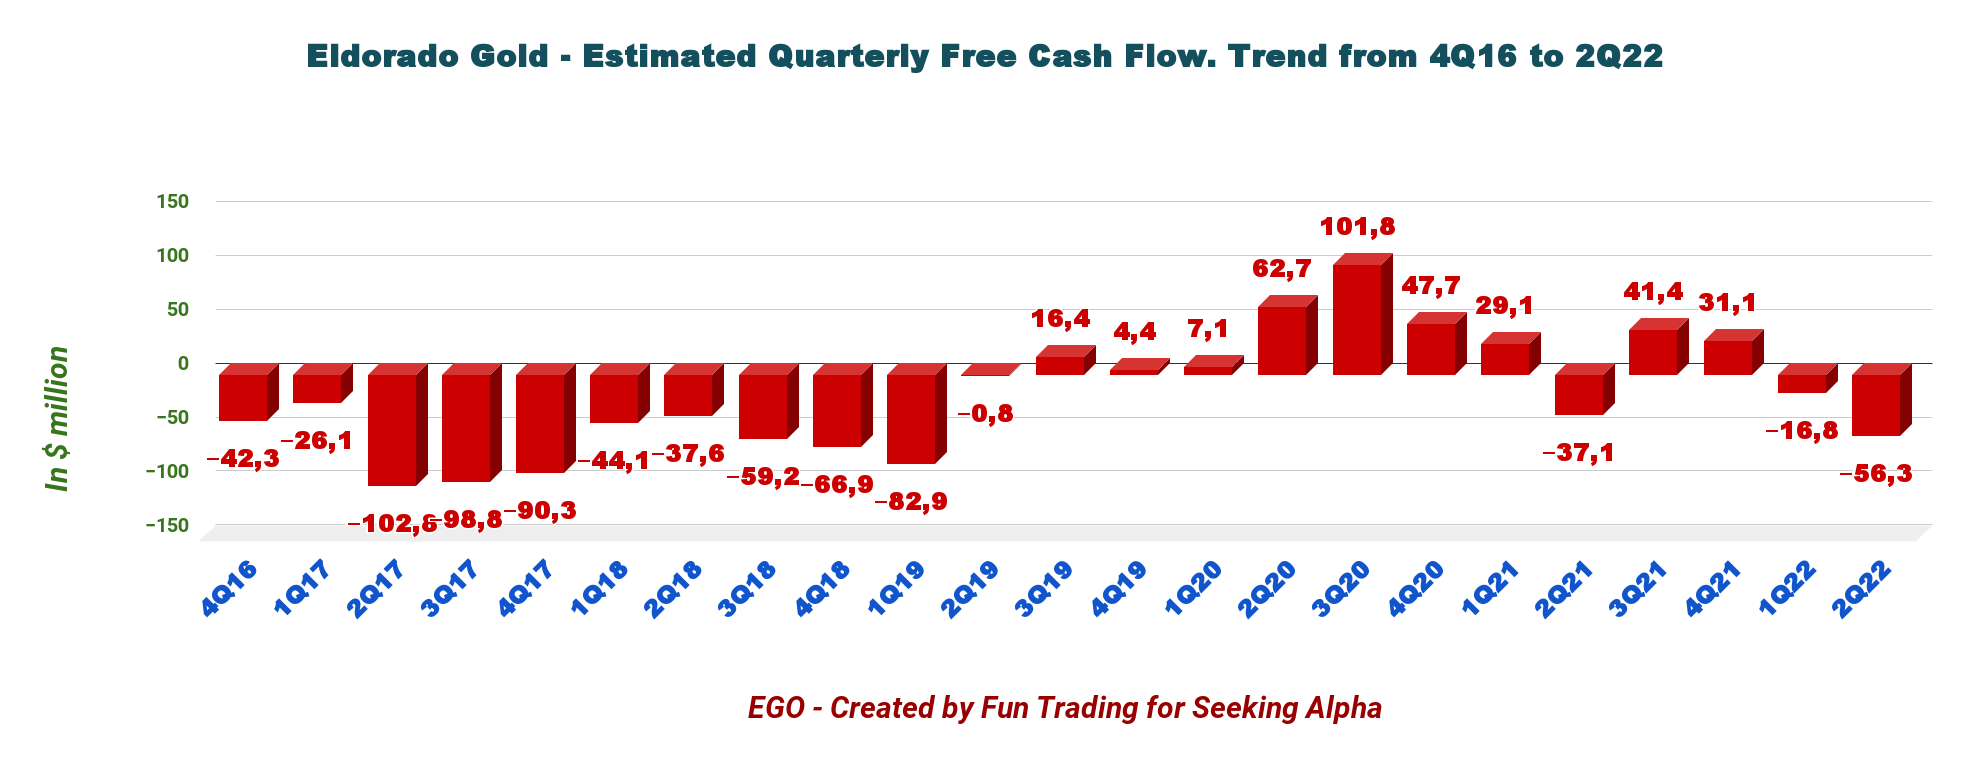
EGO shows a trailing 12-month free cash flow loss of $0.53 million, with a loss of $56.25 million for the second quarter of 2022.
Part II – Gold Production Details For 2Q22
This part is an update of my preceding article about gold production.
EGO Quarterly Gold Production history (Fun Trading)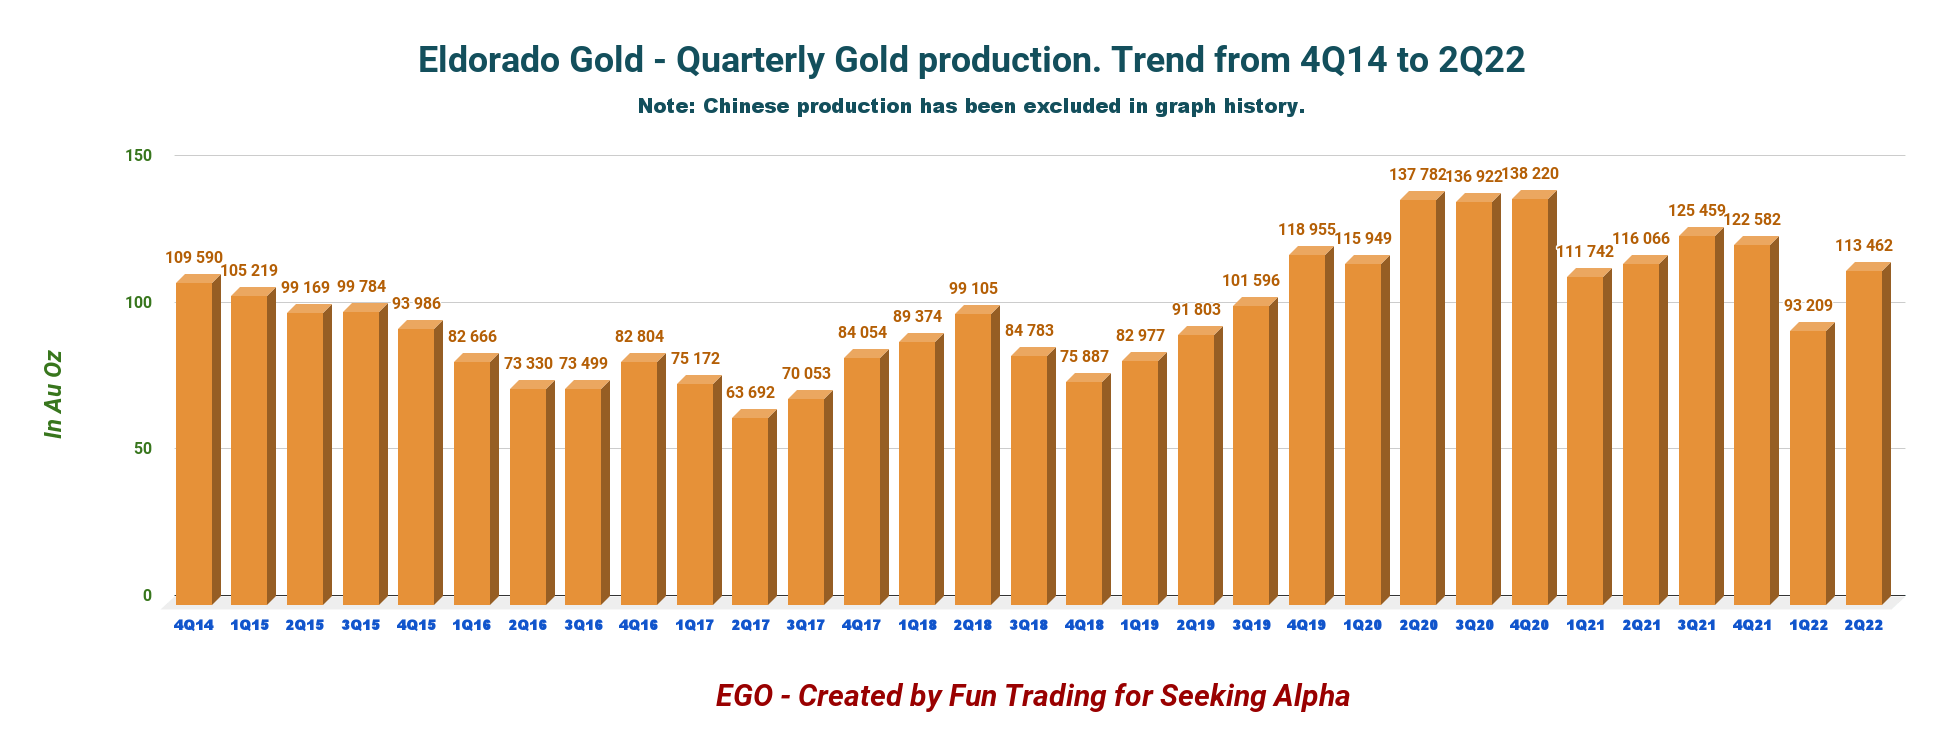
The second quarter of 2022 production came in at 113,462 Au Oz, down slightly year-over-year and up 21.7% QoQ.
Production during January and February was impacted considerably by higher-than-anticipated absenteeism related to the surge of the COVID-19 Omicron variant. Production was expected to recover significantly from the preceding quarter. The company said it maintains its full-year 2022 consolidated production guidance of 460K to 490K ounces.
1 – Olympias Mine
Olympias mine experienced impressive productivity improvements and enhanced control of gold grades in the second quarter. Gold output jumped from 12,934 ounces in 2Q21 to 15,779 ounces in 2Q22. The production increased as a result of processing ore stockpiles.
Production came at 15,779 ounces compared to 8,996 ounces produced in 1Q22 and 12,934 ounces in 2Q21.
EGO Olympias (Fun Trading)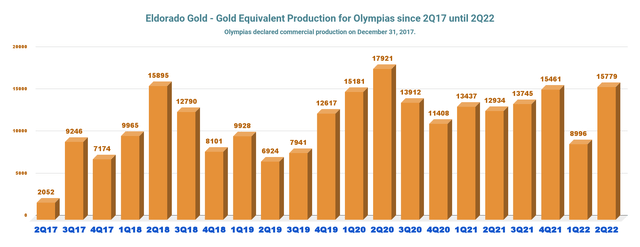
2 – Lamaque Mine
Mine and mill optimization efforts helped the company to achieve positive results this quarter after a very weak production in 1Q22. Underground development of high-grade stopes progressed well, and gold production was higher than planned due to higher throughput and grades.
Additionally, resource conversion drilling commenced on the Lamaque deposit during the quarter.
Production came in at 46,917 ounces, up from 35,643 ounces in 2Q21 and up 39.7% sequentially.
EGO Lamaque production history (Fun Trading)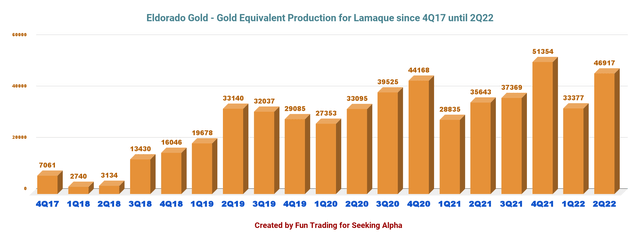
3 – Kisladag Mine
Gold production in 2Q22 was below plan due to the effects of lower tonnes placed on the leach pad in 1Q22. Optimization of the high-pressure grinding roll (“HPGR”) and debottlenecking of the belt agglomeration circuit continued in the second quarter. The HPGR is performing according to plan.
The company said a notable increase in tonnes was placed on the leach pad with a higher average grade. Thus, the company expects higher gold production in 3Q22, with production weighted to H2 2022.
Production came in at 27,973 ounces, down from 44,016 ounces in 2Q21 and 29,779 ounces produced in 1Q22.
EGO Kisladag production history (Fun Trading)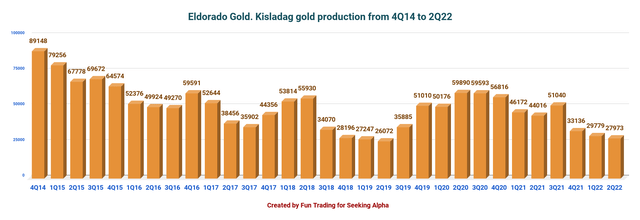
4 – Efemcukuru Mine
Production was in line with expectations. Gold production was 22,793 ounces compared to 23,473 ounces in the same quarter last year.
Gold production, throughput, and average gold grade aligned with expectations.
EGO Efemcukuru Production history (Fun Trading)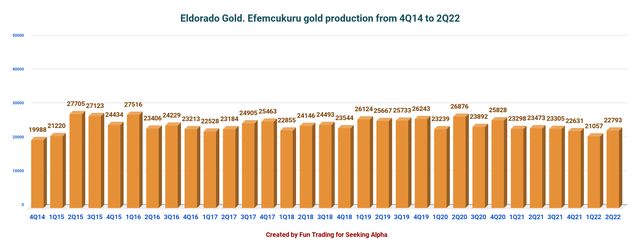
5 – AISC is now $1,270 per ounce. Significantly dropping sequentially with higher gold production sold
EGO Quarterly AISC history (Fun Trading)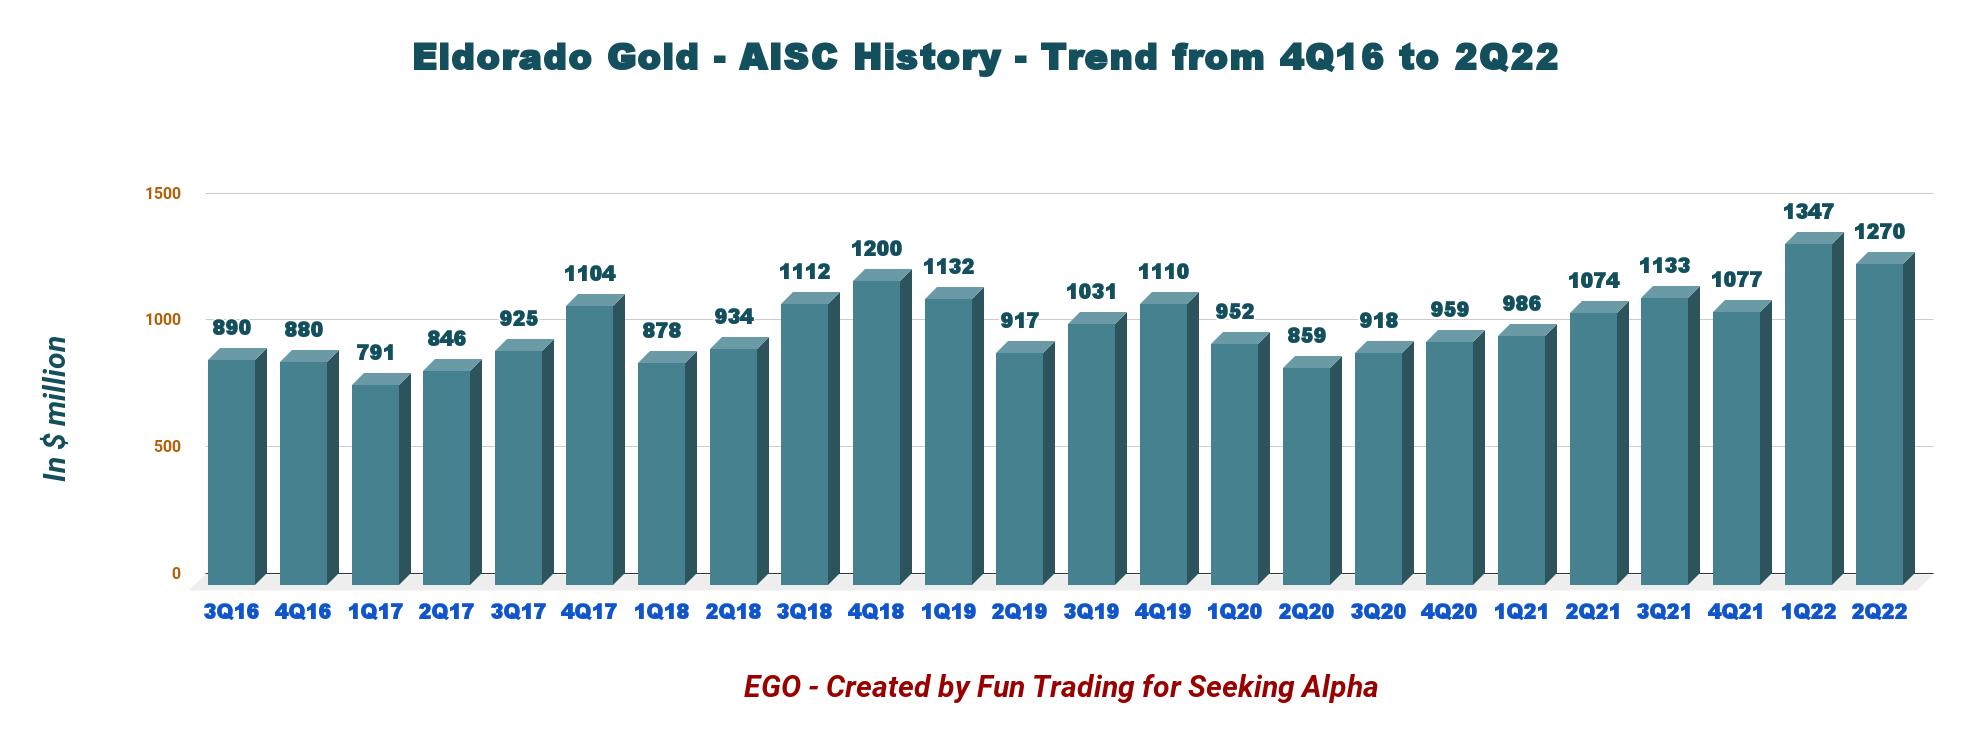
6 – Eldorado Gold maintained full-year consolidated production guidance of 460K to 490K ounces and increased AISC to $1,180 to $1,280 per ounce sold
However, EGO is updating 2022 guidance for consolidated cash operating costs to $700 to $750 per ounce sold, total cash costs to $790 to $840 per ounce sold, and AISC to $1,180 to $1,280 per ounce sold.
EGO 2022 and beyond Guidance (Eldorado Gold)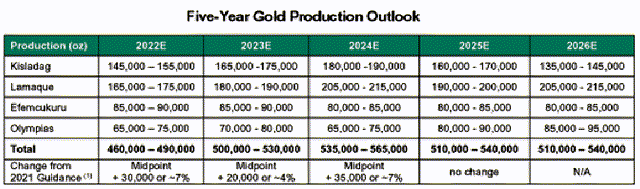
Technical Analysis And Commentary
EGO TA Chart Short-term (Fun Trading)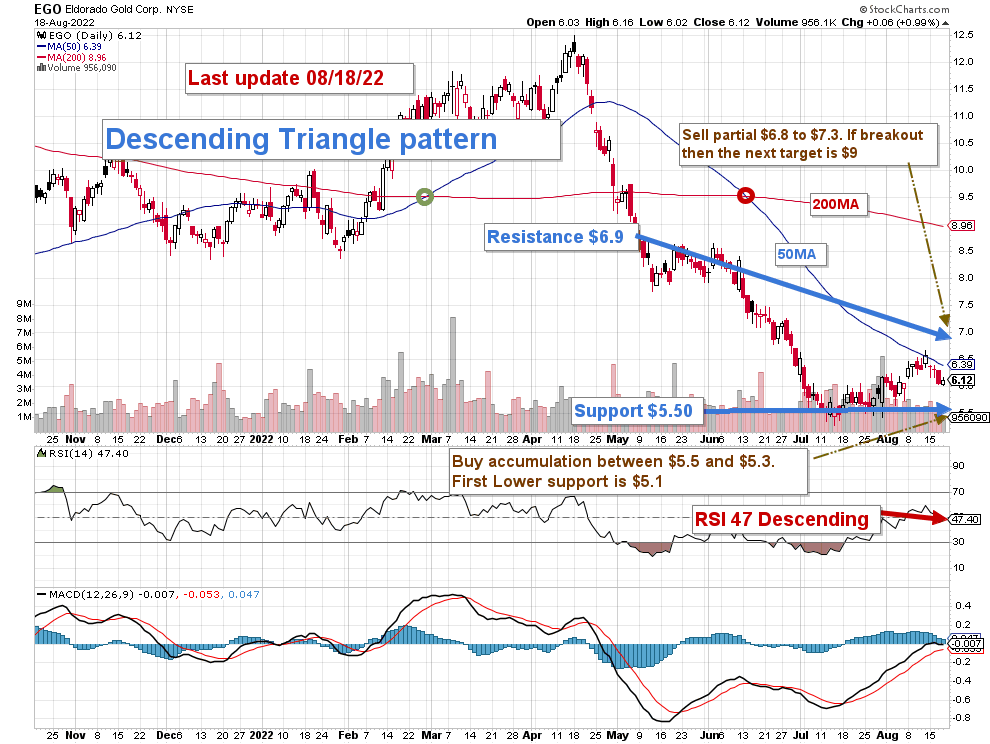
EGO forms a descending triangle pattern with resistance at $6.9 and support at $5.5.
The short-term trading strategy is to sell between $6.8 and $7.3, about 40% of your position, and buy between $5.5 and $5.3 with potential lower support at $5.1. I believe EGO is now attractive below $5.75.
The gold mining sector has experienced a significant drop triggered by the Fed’s action against inflation. The risk of recession later this year due to rampant inflation negatively affects the gold miners. However, if the FED is not successful in taming inflation, the gold price could rally significantly later this year, and gold miners could follow.
Watch the gold price and the Fed like a hawk.
Note: The LIFO method is prohibited under International Financial Reporting Standards (IFRS), though it is permitted in the United States by Generally Accepted Accounting Principles (GAAP). Therefore, only US traders can apply this method. Those who cannot trade LIFO can use an alternative by setting two different accounts for the same stock, one for the long term and one for short-term trading.
Warning: The TA chart must be updated frequently to be relevant. It is what I am doing in my stock tracker. The chart above has a possible validity of about a week. Remember, the TA chart is a tool only to help you adopt the right strategy. It is not a way to foresee the future. No one and nothing can.
Author’s note: If you find value in this article and would like to encourage such continued efforts, please click the “Like” button below as a vote of support. Thanks.
Be the first to comment