With rates climbing and many more hikes in the Fed Funds rate planned for 2022 and 2023, many fixed income investors are turning to Floating/Variable rate funds to minimize the damage done to such investments when rates go up. One statistic an investor can use to gauge the possible price erosion from a rate increase is duration. I pulled the definitions for three versions from the Corporate Finance Institute website:
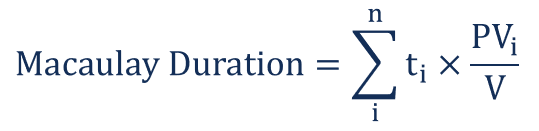
Macaulay duration is a weighted average of the times until the cash flows of a fixed-income instrument are received. It is a measure of the time required for an investor to be repaid the bond’s price by the bond’s total cash flows. The Macaulay duration is measured in units of time (e.g., years). The Macaulay duration for coupon-paying bonds is always lower than the bond’s time to maturity. For zero-coupon bonds, the duration equals the time to maturity.
corporatefinanceinstitute.com Durations
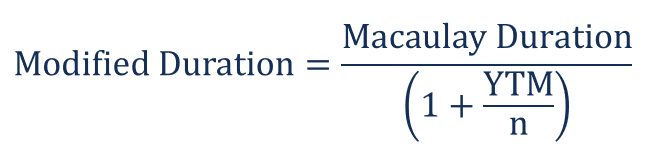
Relative to the Macaulay duration, the modified duration metric is a more precise measure of price sensitivity. The modified duration figure indicates the percentage change in the bond’s value given an X% interest rate change. Unlike the Macaulay duration, modified duration is measured in percentages. The modified duration is often considered as an extension of the Macaulay duration. It is supported by the following mathematical formula:
corporatefinanceinstitute.com Durations
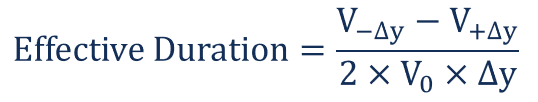
Effective duration is a measure of the duration for bonds with embedded options (e.g., callable bonds). Unlike the modified duration and Macaulay duration, effective duration considers fluctuations in the bond’s price movements relative to the changes in the bond’s yield to maturity (YTM). In other words, the measure takes into account possible fluctuations in the expected cash flows of a bond.
The effective duration is calculated using the following formula:
corporatefinanceinstitute.com Durations
I listed all three as funds report any one or more of the durations; some don’t report any measure if too many of the assets do not mature. Many of these funds have done better than ones that concentrate on fixed-rate assets, since fall’21, when inflation exploded and expectations about Fed rate moves accelerated.
spglobal.com indices
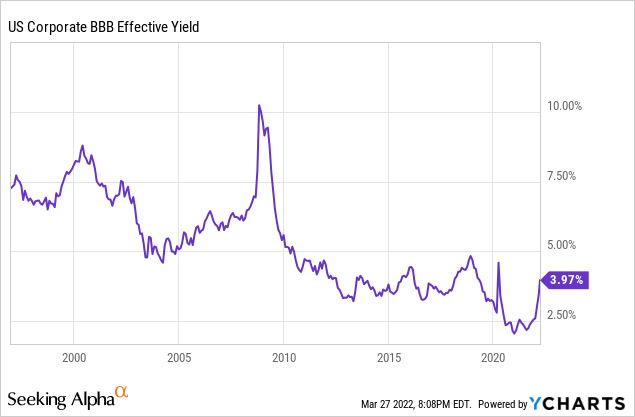
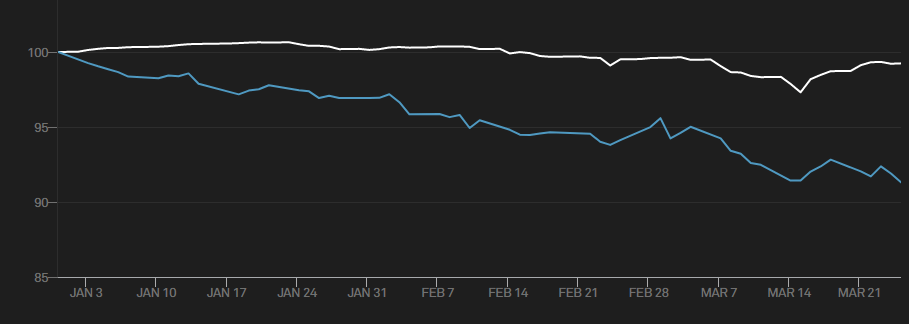
While the index benchmarked by the Eaton Vance CEFs covered here is down 74bps YTD, that is almost 800bps ahead of the S&P Bond BBB Corp Index (-869bps) since 2022 started.
Understanding the Floating-Rate Market
Each quarter, Eaton Vance posts a Floating-Rate Loan Market Monitor report. The following information and charts come from that document, starting with defining the floating-rate asset class:
Corporate debt issued by below-investment-grade borrowers
Most issuers are significant in size and scale – and many are familiar household names
Companies undertake loans for recapitalizations, acquisitions and refinancings
Coupon income from floating-rate loans resets regularly to maintain a fixed spread over a variable base rate, usually LIBOR (and in the future likely to be SOFR)
Loans are often referred to as “senior and secured”: They typically have the highest priority of claims in an issuer’s capital structure and are secured by specific collateral
Other common monikers: bank loans, leveraged loans, senior loans (all are synonymous)
The next chart show where floating-rate loans sit in the capital structure; they are the first in line.
funds.eatonvance.com Market review
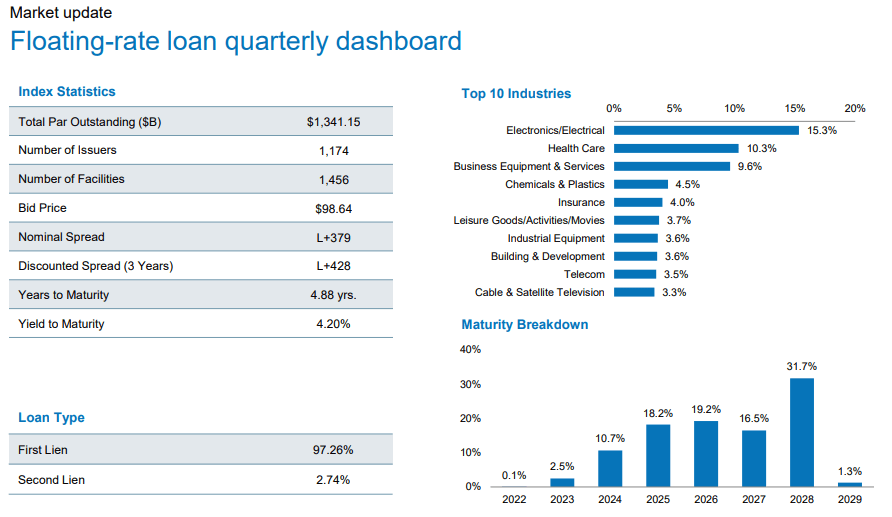
The next set of data is based on the Index used by both the CEFs covered here. It shows the sectors that use such loans, the maturity schedule and basic data points. One very important one is 97.26% of these loans are First Liens, giving them first claim on any assets of the issuer.
funds.eatonvance.com Market review
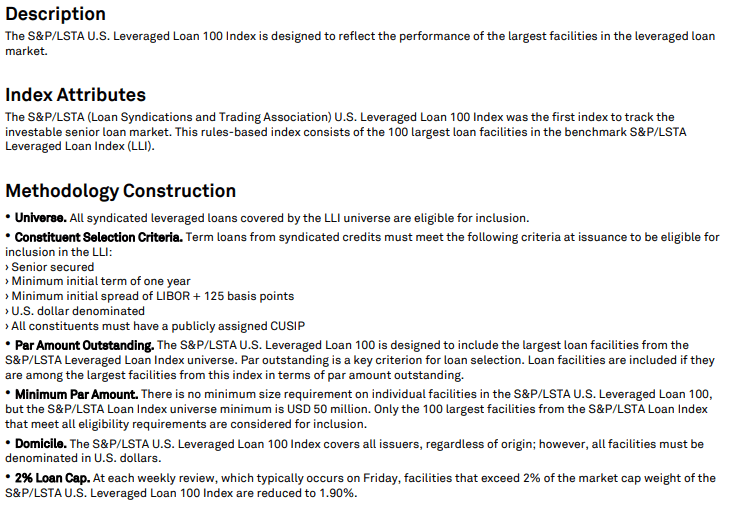
Understanding the S&P/LSTA Leveraged Loan Index
While neither CEF invests based on its underlying index, the S&P/LSTA Leveraged Loan Index, a brief review should add insight into the strategy used by Eaton Vance for their CEFs. The following points were pulled from the Index Factsheet.
spglobal.com
Understanding the Eaton Vance Senior Floating-Rate Trust
Eaton Vance Senior Floating-Rate Trust is a closed-ended fixed income mutual fund launched and managed by Eaton Vance Management. The fund invests in the fixed income markets of the United States. It primarily invests in senior, secured floating rate loans. It benchmarks the performance of its portfolio against the S&P/LSTA Leveraged Loan Index. The investment objective is to provide a high level of current income, with a secondary objective of capital preservation. Under normal market conditions, a duration of less than one year is expected. It pursues its objectives by investing primarily in Senior Loans. EFT started in 2003.
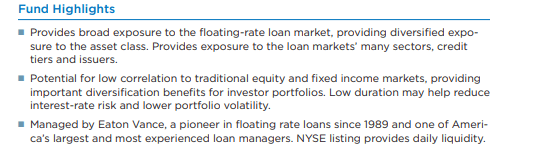
EFR has $378m in AUM and yields 7.3%. The managers charge 179bps in fees, with 46bps related to the 33.5% leverage ratio. Eaton Vance posts these benefits of their fund:
funds.eaton vance.com
EFR Holdings Review
The asset mix is: 93.1% Floating-rate loans; 3.8% Asset-backed securities; .9% Corporate debt; 2.3 Other. 78% of the assets are from the United States, with Canada (2.65%) the second largest country exposure. Since the benchmarks is restricted to USD assets, EFR probably does too.
cefconnect.com EFR
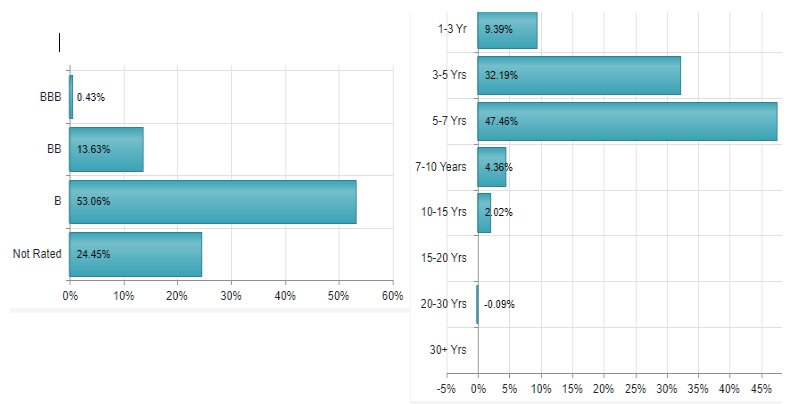
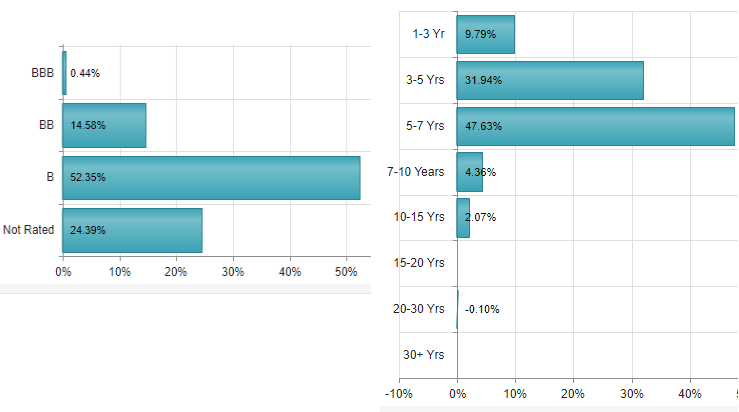
The left chart shows the bond ratings of the portfolio. Basically, its non-investment-grade or not-rated as BBB is the only investment-grade held. The right chart shows the maturity schedule in years, with the average being 4.84 years and duration of only .12 years. EFR currently own 524 assets with an average coupon of 4.45%.
seekingalpha.com EFR
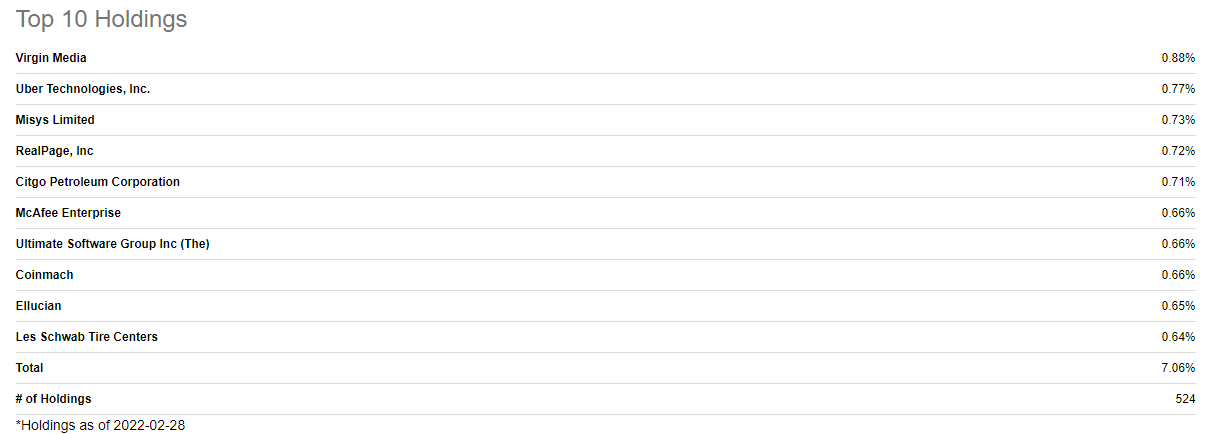
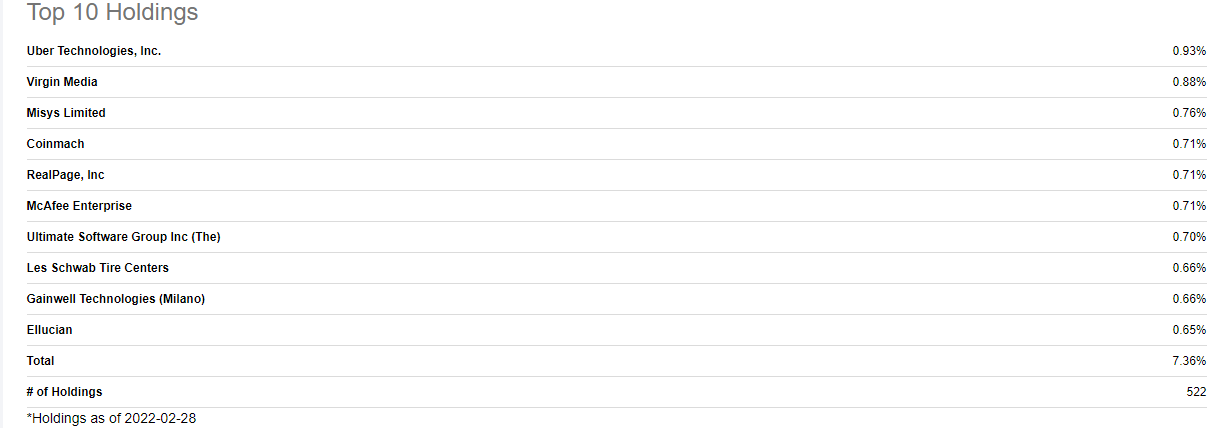
EFR is well diversified as the Top 10 are only 7% of the portfolio and no one issue is above 1% of the assets. This differs from earlier in 2022 when all the Top 10 were above 1%.
EFR Distribution Review
seekingalpha.com EFR DVDs
While EFT does not have a managed distribution policy as many CEFs do, their Prospectus does provide a policy statement:
The Trust intends to make monthly distributions of net investment income to Common Shareholders, after payment of any dividends on any outstanding APS. The amount of each monthly distribution will vary depending on a number of factors, including dividends payable on the Trust’s preferred shares or other costs of financial leverage. As portfolio and market conditions change, the rate of dividends on the Common Shares and the Trust’s dividend policy could change. Over time, the Trust will distribute all of its net investment income (after it pays accrued dividends on any outstanding preferred shares) or other costs of financial leverage. In addition, at least annually, the Trust intends to distribute all or substantially all of its net realized capital gains.
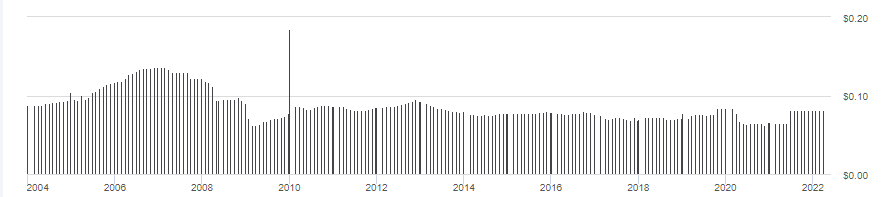
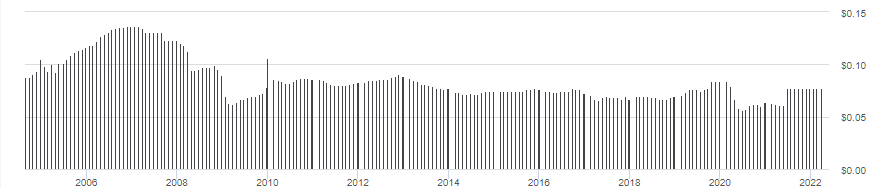
EFR raise the monthly payout last June from $.065 to $.0813, where it remains. This is the highest level since COVID-19 hit.
Price Review
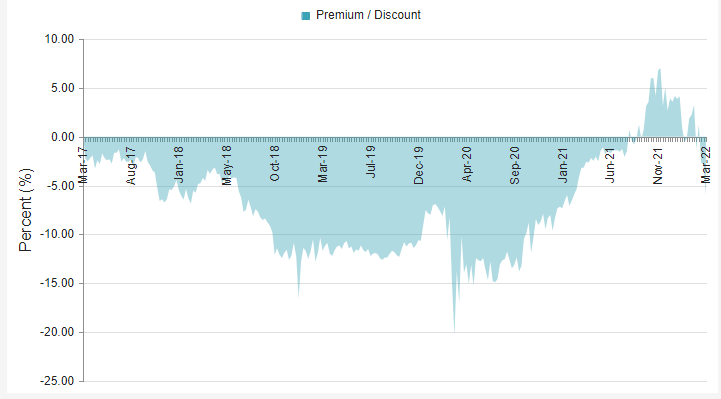
An extra due diligence step when evaluating CEFs is checking the current relationship between the price an investor would buy/sell at and the value of the underlying assets, or Net Asset Value (NAV).
CefConnect.com EFR
After selling at a premium since last summer, EFR recently re-entered discount territory and stands at a 6% discount as of this writing. The unknown is will it get deeper as it was for most of the last few years.
Understanding the Eaton Vance Floating-Rate Income Trust
Eaton Vance Floating-Rate Income Trust is a closed-ended fixed income mutual fund launched and managed by Eaton Vance Management. The fund invests in fixed income markets of the United States. It invests in fixed income securities operating across diversified sectors. The fund primarily invests in senior, secured floating rate loans. It benchmarks the performance of its portfolio against the S&P/LSTA Leveraged Loan Index.
The first objective is to provide a high level of current income. The second objective is to seek preservation of capital to the extent consistent with the primary goal. Under normal market conditions, it is expected to maintain duration of less than one year (including the effect of anticipated leverage). The primary investments are Senior Loans that are made to corporations, partnerships and other business entities, which operate in various industries and geographical regions. EFT started in 2004.
EFT has $367m in AUM and yields 7%. The managers charge 224bps in fees, with 91bps related to the 35.2% leverage. The much higher leverage cost basically accounts for ETF having 45bps more in fees. The same Fund Highlights are provided as were for EFR.
EFT Holdings Review
The asset mix is: 93.1% Floating-rate loans; 3.8% Asset-backed securities; .9% Corporate debt; 2.3 Other. 78% of the assets are from the United States, with Canada (2.65%) the second largest country exposure. These all match the values EFR reported.
CefConnect.com
Both charts are almost carbon-copies of the data shown for EFR, though the WAM for EFT is 5.3, almost .5 years longer. Its duration is close at .15 years.
seekingalpha.com EFT
Total holdings (522) and Top 10 weight, again closely match EFR. That said, the order is slightly different and Gainwell Tech replaces Citgo Petroleum in the listings.
EFT Distribution Review
seekingalpha.com EFT DVDs
EFT follows the same payout rules as EFR and this is evident in the similar movement over time of the amount distributed. Last June, EFT also raised its payout: $.061 to $.0775.
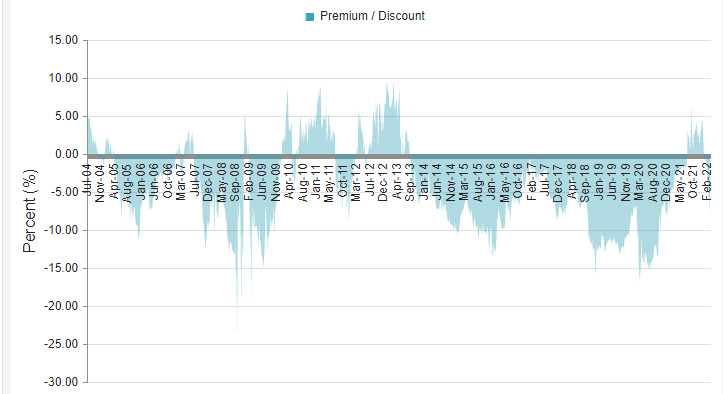
EFT Price Review
CefConnect.com EFT
EFT show more time in Premium territory than EFR has, but currently it also now trades as a discount: 8.07% of as this writing, 2% deeper than its counterpart.
EFR or EFT: Which One to Hold?
With EFR and EFT following the same index, it is not surprising most of their metrices are close. EFR has a lead in yield (32bps) while EFT’s WAM is 6 months longer and its WAC is ahead by 2bps. Currently EFT offers a deeper discount and more history above “Par”. One big difference is in fees: EFT charges 45bps higher fee; most related to its higher leverage costs.
So the deciding factor probably comes down to return and risk measurements.
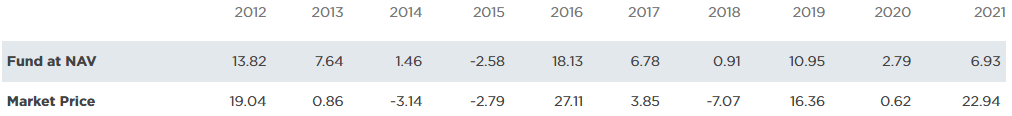
EFR Annual Returns (funds.eatonvance.com)
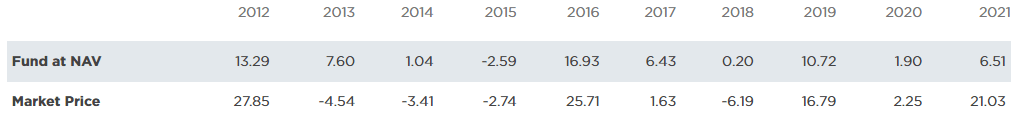
EFT Annual Returns (funds.eatonvance.com)
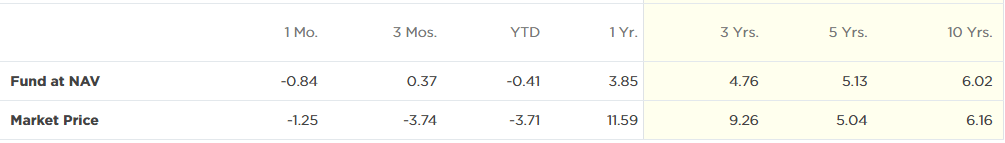
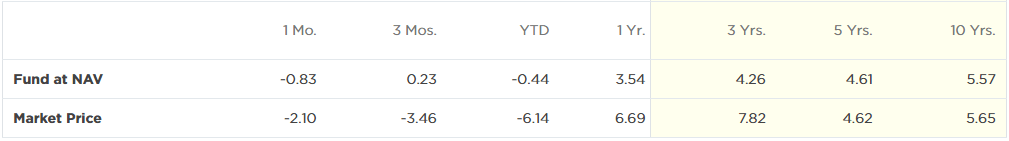
While most years were close, there are exceptions: 2014, 2016, 2020 stand out. Looking at returns by time periods, we see EFR having better price total returns in every period except for the 3-mo timeframe.
EFR Periodic Returns (funds.eatonvance.com)
EFT Periodic Returns (funds.eatonvance.com)
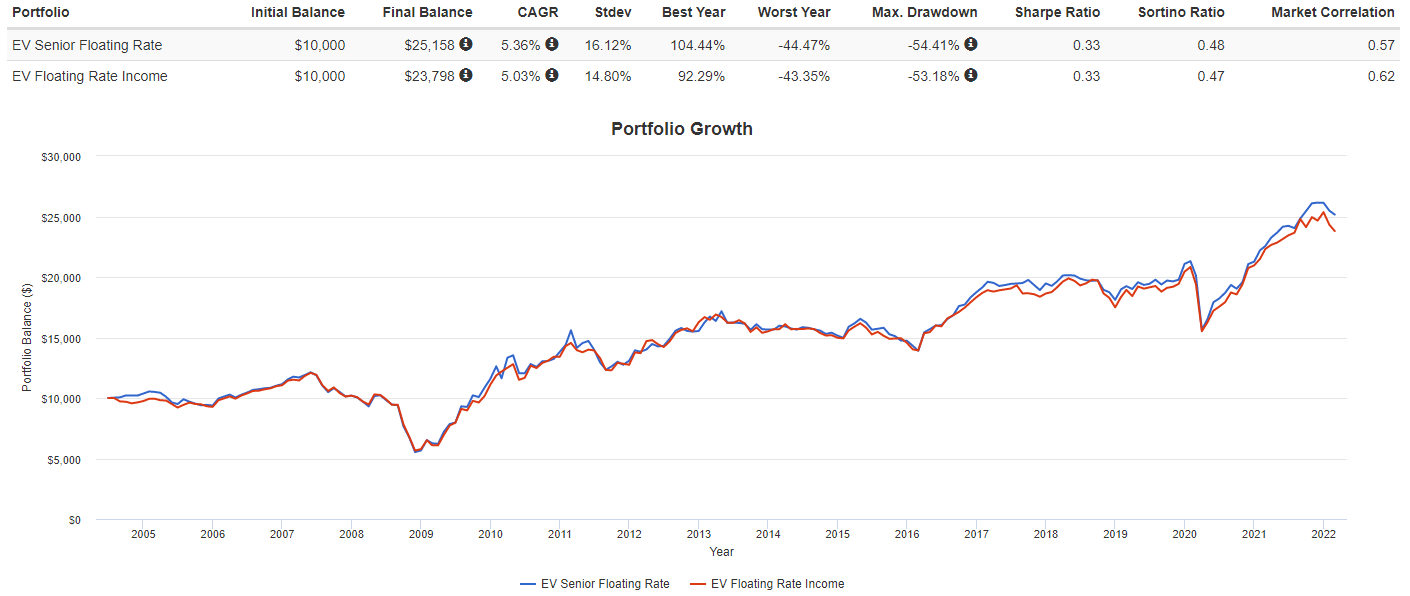
PortolfolioVisualizer.com
Going back to 2004 when EFT started, EFR is still ahead in CAGR but EFT has better results for StdDev, Worse year, and Max drawdown. The Sharpe and Sortino ratios are not much help as the difference in one is 1bps.
Conclusion: While I would not sell EFT to buy EFR, especially in a taxable account, my preference would be to own EFR.
Portfolio Strategy
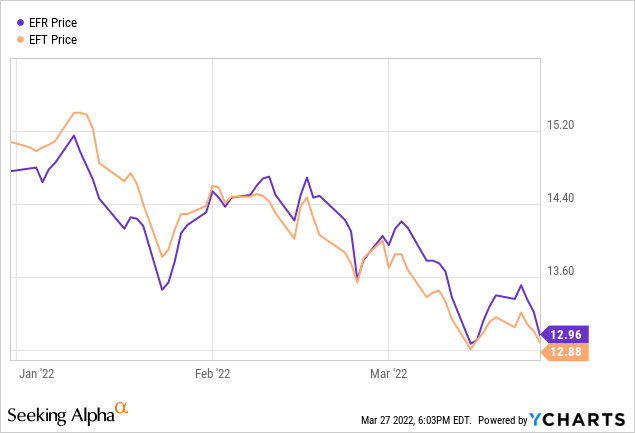
Since it appears to be a toss up between these two floating-rate funds, the question might be: “Is it time to buy or is more weakness coming?”.
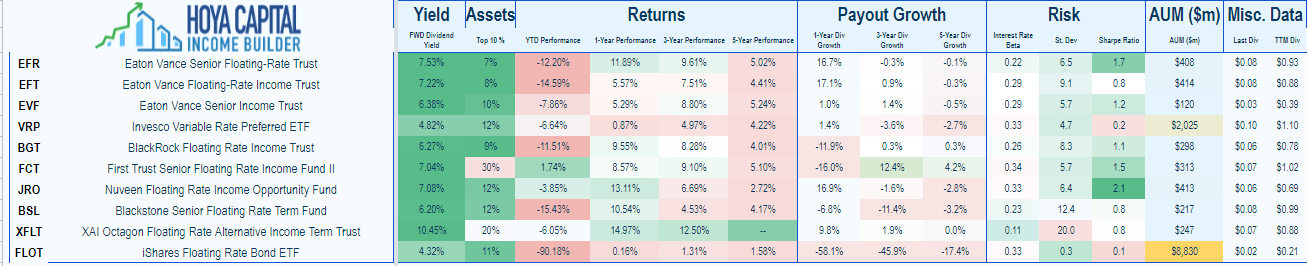
The YTD chart does not seem to indicate that the price decline has ended as last week started to test the early March lows. Of course, there are many funds in the floating-rate space. Here is just some of those regularly covered on Seeking Alpha.
Hoya Capital Income Builder
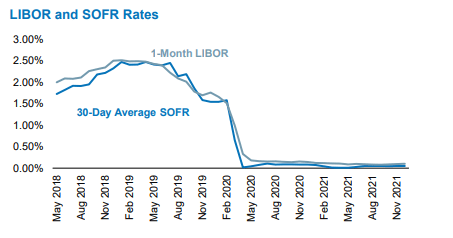
Final Thought – LIBOR to SOFR
Due to controversy over how LIBOR rates were set, it is being phased out. My understanding is US issuers must pick a new rate index by the end of June 2023. In 2017, the Alternative Reference Rate Committee (ARRC), a panel convened by the U.S. Federal Reserve, selected the Secured Overnight Financing Rate (SOFR) as a replacement for U.S. LIBOR. SOFR reflects a broad universe of overnight U.S. Treasury repo activity based on more than $800 billion in daily transactions.
funds.eatonvance.com
Experts believe loans that are LIBOR+ will need to be SOFR++ as LIBOR included higher risk premiums than SOFR will as loans that mature past the deadline are assigned a new rate index. Managers are allowed to another index too.
Please note that foreign exchange and other leveraged trading involves significant risk of loss. It is not suitable for all investors and you should make sure you understand the risks involved, seeking independent advice if necessary.


Be the first to comment