

sankai
By Mark Barnes, PhD; Marlies van Boven, PhD; and Christine Haggerty, Global Investment Research
Global equity markets went into a protective crouch last quarter, and factor performance followed suit. Yield, Low Volatility and Value factors held their lead over Quality in most developed markets as investors rushed into steadier, less cyclically sensitive stocks and fled pricier growth stocks. In stark contrast, nearly all EM factors lagged except (small) Size. Regional return dispersion was greatest within Size, which ended the quarter as a top performer in Japan but was the biggest laggard in the UK.
Regional factor returns relative to benchmark – Q2 2022 (TR, LC %)
FTSE Russell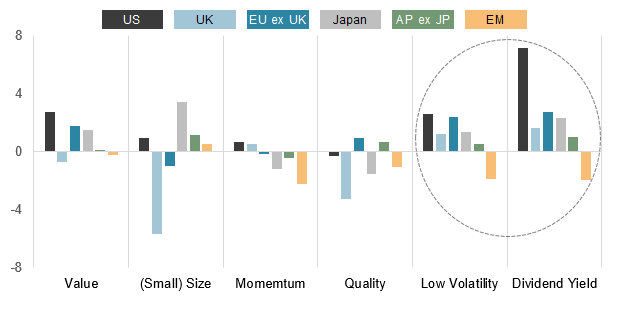
Data as of June 30, 2022. Results shown for regional factor returns represent hypothetical, historical performance, at Tilt 1, based on FTSE Global Equity Index Series and the FTSE Global Factor Index Series. Past performance is no guarantee to future results. Please see the end for important disclosures.
As we highlight in our latest Equity Factor Insights report, the continued outperformance of the Low Volatility factor in all but EM is unsurprising given the extreme turbulence plaguing markets this year. As the chart below illustrates, annualized one-month volatility spiked across equity markets in Q2, after markedly easing in the previous quarter, especially in the US.
Benchmark annualized 1-month volatility (LC %)
FTSE Russell/ Refinitiv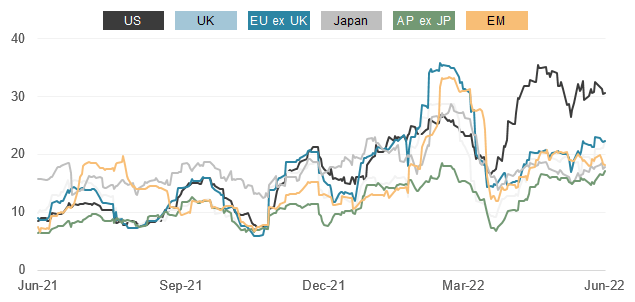
Data as of June 30, 2022. Past performance is no guarantee of future results. Please see the end for important legal disclosures.
Value rotation falters
Though still a source of outperformance in most markets through the first half, the rotation into Value from Quality lost steam in the final weeks of the quarter in all but the UK. (Both factors underperformed in the UK, but Quality more so.)
Regional Value returns relative to Quality (rebased)
FTSE Russell/Refinitiv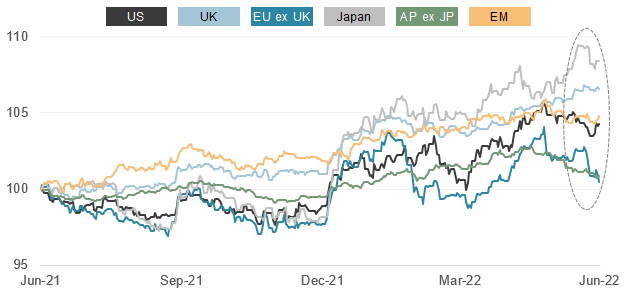
Data as of June 30, 2022. Past performance is no guarantee of future results. Please see the end for important legal disclosures.
The rotation’s slowdown coincided with rising investor fears of recession, as telegraphed by the continued bear flattening of the US yield curve – even as the real yield (dark blue line) had finally risen above zero (chart below). The 2yr/10yr yield curve has since inverted.
Select US Treasury bond yields (%)
FTSE Russell/Refinitiv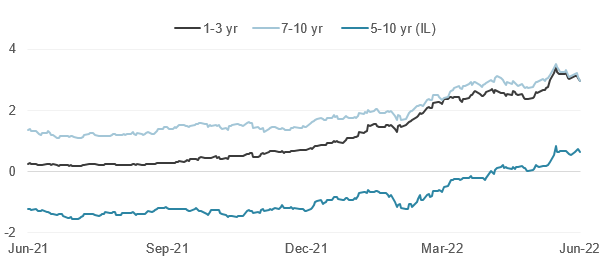
Data as of June 30, 2022. Past performance is no guarantee of future results. Please see the end for important legal disclosures.
Exposures to growth-stock selloff a key swing factor
The collapse in Consumer Discretionary and/or Technology stocks was a dominant driver of global factor performance in Q2. Yield, Low Vol and Value benefited from their underweights to these industries across developed markets (with the exception of UK Value), while overweights in the same two groups generally detracted from Quality returns.
Unlike elsewhere, Yield and Low Vol were major laggards in Emerging markets, in part because Consumer Discretionary stocks there actually rose in Q2. (Negative stock selection in Technology also hurt.) In fact, all but EM Size lagged in the quarter, a stark reversal from the wholesale outperformance of EM factors in the previous two quarters.
Quality/Value premium returns to normal
Forward P/Es across factors continued to contract from their pandemic-crisis peaks, and most are now below 10-year averages in both absolute and relative terms. Value and Yield are the least expensive factors globally, while the strong rotation into Value from Quality has significantly narrowed the valuation gap between the two. By our analysis, the Quality premium versus Value has returned to its long-term averages in most markets and has nearly vanished in the UK.
Forward 12-month factor P/E ratios, average of six regions*
FTSE Russell/Refinitiv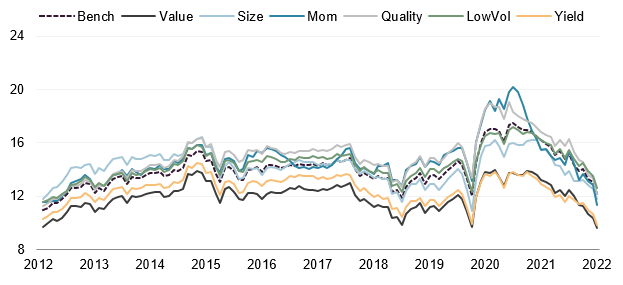
*Combined average of factor performance across FTSE USA, FTSE UK, FTSE Europe ex UK, FTSE Japan, FTSE Asia Pacific ex Japan and FTSE Emerging regional indexes. All data as of June 30, 2022. Past performance is no guarantee of future results. Please see the end for important legal disclosures.
© 2022 London Stock Exchange Group plc and its applicable group undertakings (the “LSE Group”). The LSE Group includes (1) FTSE International Limited (“FTSE”), (2) Frank Russell Company (“Russell”), (3) FTSE Global Debt Capital Markets Inc. and FTSE Global Debt Capital Markets Limited (together, “FTSE Canada”), (4) FTSE Fixed Income Europe Limited (“FTSE FI Europe”), (5) FTSE Fixed Income LLC (“FTSE FI”), (6) The Yield Book Inc (“YB”) and (7) Beyond Ratings S.A.S. (“BR”). All rights reserved.
FTSE Russell® is a trading name of FTSE, Russell, FTSE Canada, FTSE FI, FTSE FI Europe, YB and BR. “FTSE®”, “Russell®”, “FTSE Russell®”, “FTSE4Good®”, “ICB®”, “The Yield Book®”, “Beyond Ratings®” and all other trademarks and service marks used herein (whether registered or unregistered) are trademarks and/or service marks owned or licensed by the applicable member of the LSE Group or their respective licensors and are owned, or used under licence, by FTSE, Russell, FTSE Canada, FTSE FI, FTSE FI Europe, YB or BR. FTSE International Limited is authorised and regulated by the Financial Conduct Authority as a benchmark administrator.
All information is provided for information purposes only. All information and data contained in this publication is obtained by the LSE Group, from sources believed by it to be accurate and reliable. Because of the possibility of human and mechanical error as well as other factors, however, such information and data is provided “as is” without warranty of any kind. No member of the LSE Group nor their respective directors, officers, employees, partners or licensors make any claim, prediction, warranty or representation whatsoever, expressly or impliedly, either as to the accuracy, timeliness, completeness, merchantability of any information or of results to be obtained from the use of FTSE Russell products, including but not limited to indexes, data and analytics, or the fitness or suitability of the FTSE Russell products for any particular purpose to which they might be put. Any representation of historical data accessible through FTSE Russell products is provided for information purposes only and is not a reliable indicator of future performance.
No responsibility or liability can be accepted by any member of the LSE Group nor their respective directors, officers, employees, partners or licensors for (A) any loss or damage in whole or in part caused by, resulting from, or relating to any error (negligent or otherwise) or other circumstance involved in procuring, collecting, compiling, interpreting, analysing, editing, transcribing, transmitting, communicating or delivering any such information or data or from use of this document or links to this document or (B) any direct, indirect, special, consequential or incidental damages whatsoever, even if any member of the LSE Group is advised in advance of the possibility of such damages, resulting from the use of, or inability to use, such information.
No member of the LSE Group nor their respective directors, officers, employees, partners or licensors provide investment advice and nothing in this document should be taken as constituting financial or investment advice. No member of the LSE Group nor their respective directors, officers, employees, partners or licensors make any representation regarding the advisability of investing in any asset or whether such investment creates any legal or compliance risks for the investor. A decision to invest in any such asset should not be made in reliance on any information herein. Indexes cannot be invested in directly. Inclusion of an asset in an index is not a recommendation to buy, sell or hold that asset nor confirmation that any particular investor may lawfully buy, sell or hold the asset or an index containing the asset. The general information contained in this publication should not be acted upon without obtaining specific legal, tax, and investment advice from a licensed professional.
Past performance is no guarantee of future results. Charts and graphs are provided for illustrative purposes only. Index returns shown may not represent the results of the actual trading of investable assets. Certain returns shown may reflect back-tested performance. All performance presented prior to the index inception date is back-tested performance. Back-tested performance is not actual performance, but is hypothetical. The back-test calculations are based on the same methodology that was in effect when the index was officially launched. However, back-tested data may reflect the application of the index methodology with the benefit of hindsight, and the historic calculations of an index may change from month to month based on revisions to the underlying economic data used in the calculation of the index.
This document may contain forward-looking assessments. These are based upon a number of assumptions concerning future conditions that ultimately may prove to be inaccurate. Such forward-looking assessments are subject to risks and uncertainties and may be affected by various factors that may cause actual results to differ materially. No member of the LSE Group nor their licensors assume any duty to and do not undertake to update forward-looking assessments.
No part of this information may be reproduced, stored in a retrieval system or transmitted in any form or by any means, electronic, mechanical, photocopying, recording or otherwise, without prior written permission of the applicable member of the LSE Group. Use and distribution of the LSE Group data requires a licence from FTSE, Russell, FTSE Canada, FTSE FI, FTSE FI Europe, YB, BR and/or their respective licensors.
Editor’s Note: The summary bullets for this article were chosen by Seeking Alpha editors.
Be the first to comment