

1joe/E+ via Getty Images
Most of our content at iREIT on Alpha is focused on REITs, but we also provide a balanced diet of BDC, MLP, and dividend growth coverage. I recently added BASF to my retirement portfolio thanks to this excellent article coproduced with Dividend Sensei.
The S&P 500 recently finished a remarkable 11% gain in 11 days.
Twitter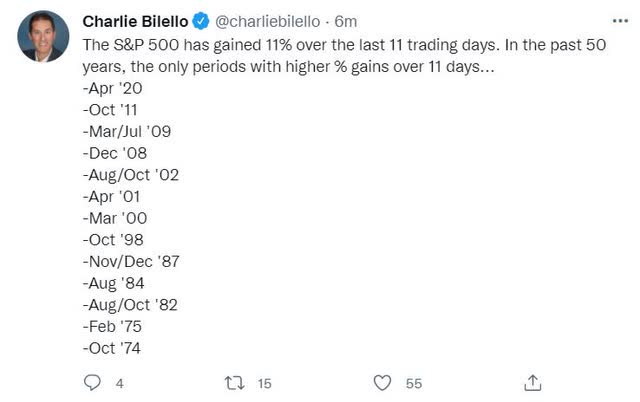
Apple (AAPL) just had a 12-day winning streak, the longest since 2003, in which it gained 18%.
Twitter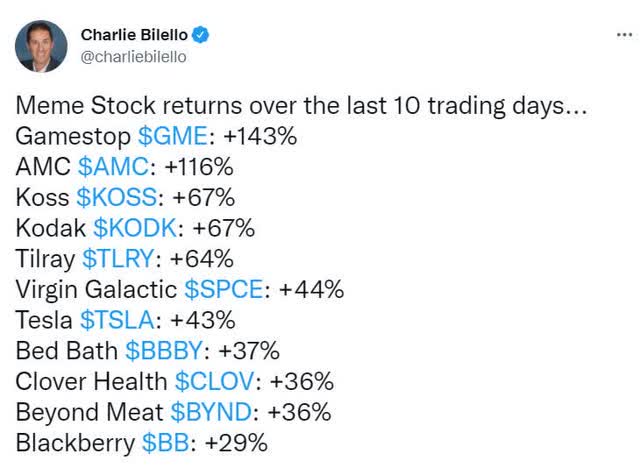
And meme stocks that had been crushed in recent months, have soared as much as 143% in two weeks.
Does this seem rational to you?
To me it’s evidence that, as Ben Graham pointed out, in the short term the market can be highly irrational, or even stupid.
But that doesn’t mean that there aren’t incredible blue-chip bargains available for smart income investors like you.
Let me show you why Dividend Sensei recently bought BASF (OTCQX:BASFY) for his retirement portfolio.
Not only does BASF offer a safe 6.5% yield that’s nearly 7X more than the market, but it’s also an outrageously attractive blue-chip bargain that could potentially triple in the next five years.
Reason One: A 6.5% Yield You Can Trust
The Dividend Kings’ overall quality scores are based on a 241-point model that includes:
-
dividend safety
-
balance sheet strength
-
credit ratings
-
credit default swap medium-term bankruptcy risk data
-
short and long-term bankruptcy risk
-
accounting and corporate fraud risk
-
profitability and business model
-
growth consensus estimates
-
management growth guidance
-
historical earnings growth rates
-
historical cash flow growth rates
-
historical dividend growth rates
-
historical sales growth rates
-
cost of capital
-
long-term risk-management scores from MSCI, Morningstar, FactSet, S&P, Reuters’/Refinitiv, and Just Capital
-
management quality
-
dividend friendly corporate culture/income dependability
-
long-term total returns (a Ben Graham sign of quality)
-
analyst consensus long-term return potential
In fact, it includes more than 1,000 fundamental metrics including the 12 rating agencies we use to assess fundamental risk.
How do we know that our safety and quality model works well?
During the two worst recessions in 75 years, our safety model 87% of blue-chip dividend cuts, the ultimate baptism by fire for any dividend safety model.
How does BASF score on one of the world’s most accurate safety models?
BASF Dividend Safety
|
Rating |
Dividend Kings Safety Score (151 Point Safety Model) |
Approximate Dividend Cut Risk (Average Recession) |
Approximate Dividend Cut Risk In Pandemic Level Recession |
|
1 – unsafe |
0% to 20% |
over 4% |
16+% |
|
2- below average |
21% to 40% |
over 2% |
8% to 16% |
|
3 – average |
41% to 60% |
2% |
4% to 8% |
|
4 – safe |
61% to 80% |
1% |
2% to 4% |
|
5- very safe |
81% to 100% |
0.5% |
1% to 2% |
|
BASFY |
74% |
1.00% |
2.60% |
|
Risk Rating |
Low Risk (70th industry percentile consensus) |
A stable outlook credit rating 0.66% 30-year bankruptcy risk |
7.5% OR LESS Max Risk Cap Recommendation |
Long-Term Dependability
|
Company |
DK Long-Term Dependability Score |
Interpretation |
Points |
|
Non-Dependable Companies |
21% or below |
Poor Dependability |
1 |
|
Low Dependability Companies |
22% to 60% |
Below-Average Dependability |
2 |
|
S&P 500/Industry Average |
61% (58% to 70% range) |
Average Dependability |
3 |
|
Above-Average |
71% to 80% |
Very Dependable |
4 |
|
Very Good |
81% or higher |
Exceptional Dependability |
5 |
|
BASFY |
75% |
Very Dependable |
4 |
Overall Quality
|
BASFY |
Final Score |
Rating |
|
Safety |
74% |
4/5 safe |
|
Business Model |
100% |
2/3 above-average |
|
Dependability |
75% |
4/5 very dependable |
|
Total |
76% |
10/13 Blue-Chip |
|
Risk Rating |
3/3 low Risk |
|
|
7.5% OR LESS Max Risk Cap Rec |
20% Margin of Safety For A Potentially Good Buy |
BASF: 306th Highest Quality Master List Company (Out of 507) = 40th Percentile
40th percentile might now sound impressive but remember the DK Master List is one of the highest quality collections of companies on earth.
The DK 500 Master List includes the world’s highest quality companies including:
-
All dividend champions
-
All dividend aristocrats
-
All dividend kings
-
All global aristocrats (such as BTI, ENB, and NVS)
-
All 13/13 Ultra Swans (as close to perfect quality as exists on Wall Street)
-
48 of the world’s best growth stocks
BASF’s 76% quality score means its similar in quality to such blue-chips as
-
Mondelez (MDLZ)
-
Dollar General (DG)
-
Hasbro (HAS)
-
Bank of Montreal (BMO)
-
Northrop Grumman (NOC)
-
National Retail Properties (NNN) – dividend champion
-
Dolby (DLB)
-
Brookfield Infrastructure Corp (BIPC)
-
Roper Technologies (ROP) – dividend aristocrat
-
Prologis (PLD)
-
United Parcel Service (UPS)
-
Texas Instruments (TXN)
Basically, BASF is one of the world’s best companies, and a 6.5% yield retirees can trust.
Why I Trust BASF With My Hard-Earned Savings
BASF was founded in 1865 in Germany and has endured and prospered through
-
dozens of recessions
-
several depressions
-
WWI and WWII
-
the cold war
-
several energy crises
-
dozens of bear markets and corrections
-
hyper-inflation
-
interest rates as high as 20%
This is a company that’s built to last and will probably outlive us all.
BASF is the world’s largest chemical company, highly diversified, by industry, and geography, with 111,000 employees operating all over the world.
-
25% of sales from the US
-
24% from Europe (ex Germany)
-
16% Germany
-
35% from the rest of the world
“BASF is the world’s largest chemical company, competing in almost every major chemical category. Given its German roots, around half of sales are generated in Europe, but investments are largely focused on higher-growth emerging markets, particularly China.
End markets are widely diversified between industrial uses, energy, and transportation, but also less cyclical areas such as consumer goods and agriculture. The company was built on the production of basic commodities such as petrochemicals.
However, its current strategy targets a shift toward specialty chemicals and customized solutions. We view this as a wise endeavor, given the increased pricing power and lower cyclicality typically associated with specialty chemicals.” – Morningstar (emphasis added)
BASF is very committed to its dividend, prioritizing it above almost everything else.
A Very Dividend Friendly Corporate Culture
“The balance sheet is sound. BASF has medium business risk. However, given the company’s size, diversity, and relatively conservative debt, BASF maintains an A-level credit rating.
The company has been very active in recent years in reshaping its business portfolio through acquisitions and divestments…
Organic investment is focused on building a fully owned Verbund chemical park in China…We think this makes sense as China will be driving most of the growth in chemicals for the foreseeable future. It will be several years before we can judge execution as the build-out will likely occur over a decade. We generally view BASF as strong for operational executions.
BASF is entirely focused on the dividend and essentially never buys back shares. This intense commitment to the dividend has amplified shareholder expectations for a steady payout, which may be unrealistic given BASF’s cyclical nature. The payout ratio has steadily been creeping upward, and we expect it to be in the 70% range for the next few years. Consequently, we view shareholder distributions as somewhat high.” – Morningstar
The elevated payout ratio that’s expected for several years is why analysts expect a modest 2% to 3% dividend growth while the company waits for its major investments in China to bear fruit.
-
2026’s 40% EPS growth consensus is primarily due to major Chinese projects coming online
Management’s goals are to grow faster than its industry (6% per year), and raise the dividend every year, whenever possible.
“For 2021, we will propose a dividend of 3.40 Euros per share to the Annual Shareholders’ Meeting, thus delivering on our progressive dividend policy….
Our solid balance sheet and strong free cash flow support this progressive dividend policy. ” – CEO,CFO Q4 conference call
A progressive dividend policy is what most American companies pursue.
-
dividends go up at the rate of cash flow over time
-
typically every year
-
but in tough times dividends are frozen but not cut
How much does BASF love its progressive dividend policy?
During the Q4 conference call, it mentioned the dividend no less than 17 times.
-
management understands that BASF’s core investor base primarily owns BASF for the dividend
-
and will avoid cutting it unless the worst-case scenario plays out for several years (see risk section)
BASF also strives to manage its long-term risks effectively, including the green energy transition.
-
see the risk section to see why rating agencies believe BASF is doing a good job managing its risk profile
-
70th industry percentile
Managing its risk profile and goals, including raising its dividend every year, requires managing its portfolio of businesses, which includes prudent asset sales, acquisitions, and joint ventures.
Management has a good track record of achieving its objectives, which is why Dividend Sensei and I own this high-yield blue-chip in our retirement portfolio.
Management is able to leverage the best economies of scale in the industry to manage costs, while still investing in growth, as seen by its recently completed multi-year excellence program, which boosted EBITDA by $2.3 billion.
-
25% increase compared to pre-pandemic levels
BASF is planning on spending $28.6 billion on capex through 2026, most of which is focused on growth.
-
primarily on Chinese growth projects and battery material production capacity
BASF’s capital allocation plan is reasonable and prudent.
-
organic growth via that $28.6 billion growth plan
-
the dividend, with a goal of increasing the dividend every year if possible, but avoiding cuts during tough times
-
strengthening the portfolio through strategic M&A and asset sales
-
buybacks, opportunistic, up to $3.3 billion in buybacks authorized through 2023
BASF’s $3.3 billion buyback authorization has been in place since 2008, and thus far it’s only spent 14% of that money buying back about 0.7% of shares.
Dividends, not buybacks are the priority.
For 2022 BASF is focused on five main priorities.
-
raising prices to cover its increased energy costs
-
maintaining margins (to maximize free cash flow and keep the dividend safe)
-
keep investing in growth opportunities focused on China specifically, Asia in general, and increasing battery capacity
-
minimizing costs, through leveraging the industry’s best economies of scale
-
continue its long-term green energy transition plan
BASF Credit Ratings
|
Rating Agency |
Credit Rating |
30-Year Default/Bankruptcy Risk |
Chance of Losing 100% Of Your Investment 1 In |
|
S&P |
A stable |
0.66% |
151.5 |
|
Fitch |
A stable |
0.66% |
151.5 |
|
Moody’s |
A3 (A- equivalent) Stable |
2.50% |
40.0 |
|
Consensus |
A stable |
1.27% |
78.5 |
(Source: S&P, Fitch, Moody’s)
Rating agencies estimate a 1 in 79 chance that investors buying BASF today will suffer a total loss over the next 30 years.
S&P just completed its annual review of BASF including factoring in:
-
Business model risk: strong – meaning relatively low risk
-
country risk: low
-
industry risk: intermediate (cyclical industry)
-
competitive position: strong
-
financial risk: intermediate
-
cash flow/leverage: intermediate
-
diversification: neutral
-
capital structure: neutral
-
financial policy (including dividends): neutral
-
liquidity: adequate
-
management/governance: strong
-
ratings vs peers: positive
Strengthened credit metrics and Solenis divestiture with expected gross proceeds of around €1.2 billion give BASF the flexibility at the A3 rating level” – Moody’s
Basically, rating agencies are not worried about BASF’s ability to execute on its long-term financial goals, while paying its generous and steadily growing dividend and potentially buying back up to $3.3 billion worth of stock.
BASF Leverage Consensus Forecast
|
Year |
Debt/EBITDA |
Net Debt/EBITDA (3.0 Or Less Safe According To Credit Rating Agencies) |
Interest Coverage (8+ Safe) |
|
2020 |
2.60 |
1.99 |
6.85 |
|
2021 |
1.48 |
1.27 |
16.36 |
|
2022 |
1.87 |
1.58 |
13.55 |
|
2023 |
1.87 |
1.53 |
13.57 |
|
2024 |
1.68 |
1.62 |
14.04 |
|
2025 |
1.67 |
NA |
NA |
|
2026 |
1.36 |
NA |
NA |
|
2027 |
1.32 |
NA |
NA |
|
Annualized Change |
-9.19% |
-5.01% |
19.66% |
(Source: FactSet Research Terminal)
BASF took on a lot of debt during the pandemic to ensure sufficient liquidity (so did many companies).
Its leverage ratios are expected to recover rapidly and its interest coverage is expected to be about 2X the rating agency’s safety guideline.
BASF Balance Sheet Consensus Forecast
|
Year |
Total Debt (Millions) |
Cash |
Net Debt (Millions) |
Interest Cost (Millions) |
EBITDA (Millions) |
Operating Income (Millions) |
Average Interest Rate |
|
2020 |
$23,322 |
$5,490 |
$17,815 |
$631 |
$8,968 |
$4,321 |
2.71% |
|
2021 |
$18,891 |
$3,113 |
$16,140 |
$534 |
$12,751 |
$8,736 |
2.83% |
|
2022 |
$21,655 |
$2,383 |
$18,325 |
$547 |
$11,590 |
$7,412 |
2.53% |
|
2023 |
$22,586 |
$2,588 |
$18,565 |
$574 |
$12,102 |
$7,788 |
2.54% |
|
2024 |
$21,592 |
$1,181 |
$20,759 |
$591 |
$12,835 |
$8,298 |
2.74% |
|
2025 |
$23,039 |
NA |
NA |
NA |
$13,818 |
$9,407 |
NA |
|
2026 |
$23,039 |
NA |
NA |
NA |
$16,947 |
$11,728 |
NA |
|
2027 |
$23,039 |
NA |
NA |
NA |
$17,402 |
$11,862 |
NA |
|
Annualized Growth |
-0.17% |
-31.90% |
3.90% |
-1.62% |
9.93% |
15.52% |
0.29% |
(Source: FactSet Research Terminal)
Debt is expected to remain stable over time while cash flow and operating income that services debt grows at 10% to 16% per year.
BASF’s 2.7% average interest cost vs 7.3% cash return on invested capital, is expected to remain stable over time.
Bond Profile: A Strong Balance Sheet To Defend The Dividend
-
$21.9 billion in liquidity
-
100% unsecured bonds (maximum financial flexibility)
-
well-staggered bond maturities (no trouble refinancing debt)
-
2.7% average borrowing cost vs bond market’s 2.2% long-term inflation forecast
-
BASF’s effective real interest rate is 0.5% vs 7.3% cash return on invested capital
-
returns on investment are 15X its real borrowing cost
-
The bond market is so confident in BASF’s business plans its willing to lend to it for nearly 16 years at 2.3% (0.1% real interest rate)
Credit Default SWAPs: Real-Time Fundamental Risk Estimates From The Bond Market
Source: FactSet Research Terminal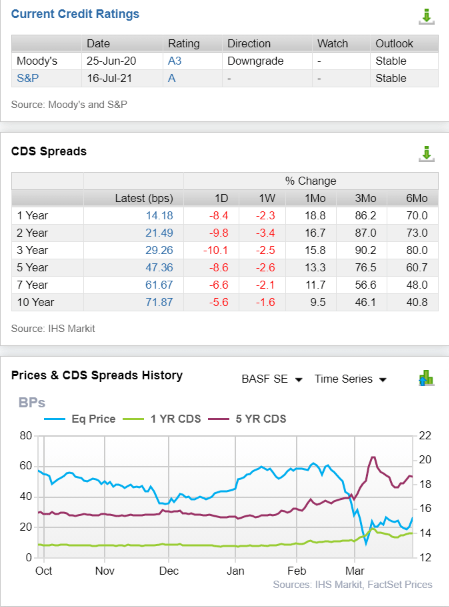
Credit default SWAPs are insurance bond investors take out against bankruptcies and defaults.
They represent a real-time fundamental risk estimate and are affected by things like breaking news, earnings updates, etc.
-
BASF’s price may rise or fall but its fundamental risk is far less volatile
-
the bond market is estimating a 2.16% default risk of 30 years
-
treating BASF as an A-rated positive outlook company
-
analysts, rating agencies, the bond market, and management all agree the investment thesis is intact
BASF Profitability: Wall Street’s Favorite Quality Proxy
BASF historically has profitability in the top 30% of its peers.
This is due to the largest economies of scale in the industry.
BASF Trailing 12-Month Profitability Vs Peers
|
Metric |
Industry Percentile |
Major Chemical Companies More Profitable Than BASF (Out Of 1,436) |
|
Operating Margin |
51.42 |
698 |
|
Net Margin |
49.15 |
730 |
|
Return On Equity |
64.32 |
512 |
|
Return On Assets |
55.36 |
641 |
|
Return On Capital |
65.36 |
497 |
|
Average |
57.12 |
616 |
(Source: GuruFocus Premium)
Profitability has temporarily declined due to BASF taking on a lot of debt during the pandemic to keep investing in its ambitious growth plan during the crisis.
-
soaring energy costs in Europe have also impacted profitability (see risk section)
Accounting for the natural cyclicality of this industry, BASF’s profitability is relatively stable for the last 20 years, confirming a narrow and stable moat.
BASF Profit Margin Consensus Forecast
|
Year |
FCF Margin |
EBITDA Margin |
EBIT (Operating) Margin |
Net Margin |
Return On Capital Expansion |
Return On Capital Forecast |
|
2020 |
3.8% |
12.5% |
6.0% |
-1.8% |
1.10 |
|
|
2021 |
4.4% |
14.4% |
9.9% |
7.0% |
TTM ROC |
23.54% |
|
2022 |
4.7% |
13.1% |
8.4% |
6.1% |
Latest ROC |
16.35% |
|
2023 |
5.3% |
13.5% |
8.7% |
6.2% |
2027 ROC |
25.79% |
|
2024 |
4.5% |
14.0% |
9.0% |
6.5% |
2027 ROC |
17.91% |
|
2025 |
7.1% |
14.5% |
9.9% |
7.3% |
Average |
21.85% |
|
2026 |
7.3% |
16.1% |
11.2% |
8.0% |
Industry Median |
16.70% |
|
2027 |
7.0% |
15.9% |
10.8% |
7.8% |
BASF/Industry Median |
1.31 |
|
Annualized Growth |
8.99% |
3.50% |
8.75% |
NA |
Vs S&P |
1.50 |
|
Annualized Growth (Ignoring Pandemic) |
8.11% |
1.62% |
1.53% |
1.67% |
(Source: FactSet Research Terminal)
Analysts expect very strong growth in free cash flow margins, and steady growth in EBTIDA, operating margins, and net margins as well.
Returns on capital or ROC is Joel Greenblatt’s gold standard proxy for quality and moatiness. ROC = pre-tax profit/operating capital (the money it takes to run the business).
This is a capital-intensive industry with median ROC of 16%, while BASF consistently delivers about 30% higher, or 22% return on capital.
-
for every $1 it takes to run the business, BASF historically generates $0.21 in annual pre-tax profit
-
18.5% 13-year median
-
average BASF investment pays for itself in about five years
-
S&P 500’s average in 2021 was 14.6% (average investment pays for itself in seven years)
-
according to one of the greatest investors in history, BASF is about 50% higher quality than the S&P 500
-
and about 30% higher quality than its median peer
For two decades BASF’s ROC has been relatively stable or trending higher.
-
further confirmation of its narrow and stable moat
BASF Dividend Growth Consensus Forecast
|
Year |
Dividend Consensus |
EPS/Share Consensus |
Payout Ratio |
Retained (Post-Dividend) Earnings |
Buyback Potential |
Debt Repayment Potential |
|
2021 |
$0.95 |
$1.90 |
50.0% |
$3,490 |
6.22% |
18.5% |
|
2022 |
$0.97 |
$1.58 |
61.4% |
$2,241 |
4.00% |
11.9% |
|
2023 |
$0.98 |
$1.68 |
58.3% |
$2,572 |
4.59% |
11.9% |
|
2024 |
$1.01 |
$1.80 |
56.1% |
$2,902 |
5.18% |
12.9% |
|
2025 |
$1.08 |
$1.88 |
57.4% |
$2,939 |
5.24% |
13.6% |
|
2026 |
$1.12 |
$2.63 |
42.6% |
$5,548 |
9.89% |
24.1% |
|
2027 |
$1.14 |
$2.66 |
42.9% |
$5,584 |
9.96% |
24.2% |
|
Total 2021 Through 2027 |
$7.25 |
$14.13 |
51.3% |
$25,277.12 |
45.07% |
133.81% |
|
Annualized Rate |
3.09% |
5.77% |
-2.54% |
8.15% |
8.15% |
4.63% |
(Source: FactSet Research Terminal)
-
rating agencies consider 60% a safe payout ratio for this industry
-
BASF’s payout ratio is expected to get steadily safer over time
-
falling to 43% by 2027
-
allowing it to retain over $25 billion in earnings (to help fund that $29 billion growth plan)
-
that’s enough to pay off 134% of its current debt (if management wanted)
-
or buyback nearly 50% of its stock (if BASF prioritized buybacks) at current valuations
BASF Buyback Consensus Forecast
|
Year |
Consensus Buybacks ($ Millions) |
% Of Shares (At Current Valuations) |
Market Cap |
|
2022 |
$388.0 |
0.8% |
$48,891 |
|
2023 |
$292.0 |
0.6% |
$48,891 |
|
2024 |
$375.0 |
0.8% |
$48,891 |
|
Total 2022-2024 |
$1,055.00 |
2.2% |
$48,891 |
|
Annualized Rate |
0.74% |
Average Annual Buybacks |
$351.67 |
(Source: FactSet Research Terminal)
Analysts expect over $1 billion in buybacks over the next three years or about 2% of shares at current valuations.
-
BASF’s consensus future annual buybacks are nearly equal to its total buybacks since 2008
0.74% annual repurchases might not sound like a lot, but it’s more than 2X what BASF has spent on buybacks since 2008, potentially in just the next three years.
|
Time Frame (Years) |
Net Buyback Rate |
Shares Remaining |
Net Shares Repurchased |
|
5 |
0.7% |
96.35% |
3.65% |
|
10 |
0.7% |
92.84% |
7.16% |
|
15 |
0.7% |
89.46% |
10.54% |
|
20 |
0.7% |
86.20% |
13.80% |
|
25 |
0.7% |
83.05% |
16.95% |
|
30 |
0.7% |
80.03% |
19.97% |
(Source: DK Research Terminal, FactSet Research Terminal)
If BASF were to buy back stock at the rate analysts expect it could reduce the share count by 20% over the next 30 years.
-
and increase the value of your shares by 20% not counting future earnings, cash flow, or dividend growth
But a safe 6.5% yield is just the first reason we bought BASF and you might want to consider doing the same.
Reason Two: Strong Growth Potential For Many Years To Come
We’ve already seen how BASF is a company built to last, and one that’s planning on a nearly $30 billion growth plan in the next five years.
-
and it has $22 billion in liquidity and $25 billion in expected retained earnings with which to pull that off
What kind of growth do analysts expect this to deliver to BASF investors?
BASF Medium-Term Growth Consensus Forecast
|
Year |
Sales |
Free Cash Flow |
EBITDA |
EBIT (Operating Income) |
Net Income |
|
2020 |
$71,795 |
$2,753 |
$8,968 |
$4,321 |
-$1,287 |
|
2021 |
$88,387 |
$3,878 |
$12,751 |
$8,736 |
$6,211 |
|
2022 |
$88,480 |
$4,189 |
$11,590 |
$7,412 |
$5,410 |
|
2023 |
$89,538 |
$4,710 |
$12,102 |
$7,788 |
$5,593 |
|
2024 |
$91,915 |
$4,142 |
$12,835 |
$8,298 |
$6,001 |
|
2025 |
$95,088 |
$6,705 |
$13,818 |
$9,407 |
$6,962 |
|
2026 |
$104,974 |
$7,619 |
$16,947 |
$11,728 |
$8,411 |
|
2027 |
$109,535 |
$7,673 |
$17,402 |
$11,862 |
$8,500 |
|
Annualized Growth |
6.22% |
15.77% |
9.93% |
15.52% |
NA |
|
Annualized Growth (Ignoring Pandemic |
3.64% |
12.05% |
5.32% |
5.23% |
5.37% |
(Source: FactSet Research Terminal)
BASF’s top line is expected to grow at a steady rate of about 4%, with higher margins driving 5% bottom growth.
Free cash flow, which funds the dividend, is expected to grow at 12% annually, even factoring out the pandemic pop.
|
Metric |
2022 Growth Consensus |
2023 Growth Consensus |
2024 Growth Consensus (Bond Market Recession Forecast) |
2025 Growth Consensus |
2026 Growth Consensus |
2027 Growth Consensus |
|
Sales |
-7% |
1% |
2% |
4% |
10% |
4% |
|
Dividend |
2% |
2% |
2% |
8% |
2% |
3% |
|
EPS |
-16% |
1% |
7% |
4% |
40% |
1% |
|
Operating Cash Flow |
6% |
7% |
-1% |
NA |
NA |
NA |
|
Free Cash Flow |
7% |
2% |
-9% |
NA |
NA |
NA |
|
EBITDA |
-9% |
4% |
4% |
NA |
NA |
NA |
|
EBIT (Operating Income) |
-9% |
2% |
7% |
NA |
NA |
NA |
(Source: FAST Graphs, FactSet Research)
BASF is expected to gradually grow its dividend every year and in 2026 the completion of its large China growth project is expected to result in a significant increase in earnings and cash flow.
And what about the long-term growth outlook?
BASF Long-Term Growth Outlook
-
analyst growth consensus range from -2% to 32.7% CAGR
-
11.0% CAGR median growth consensus
-
actual growth 11.5% CAGR growth since 1997
This is a very cyclical industry and so historical analyst margins of error are very wide.
Smoothing for outliers historical analyst margins of error are 25% to the downside and 15% to the upside.
-
8% to 13% CAGR margin-of-error adjusted growth consensus range
BASF’s historical growth rates range from -1% to 95% CAGR depending on the time frame and state of the economy.
-
since 1997 its averaged 11.5%
-
10.8% CAGR growth over the last 18 years
-
similar to what analysts expect in the future
Reason Three: An Outrageously Attractive 6.5% Blue-Chip Bargain
In a 21% market that’s full of speculative excess, you might wonder what true value looks like. It looks like BASF.
-
over the last seven to 20 years (a statistically significant time period)
-
outside of bear markets and bubbles
-
hundreds of millions of income investors
-
have consistently paid 13 to 14.5X earnings for BASF
-
91% statistical probability that this range represents intrinsic value for BASF
|
Metric |
Historical Fair Value Multiples (20-years) |
2021 |
2022 |
2023 |
2024 |
12-Month Forward Fair Value |
|
13-Year Median Yield |
3.90% |
$24.36 |
$25.41 |
$25.41 |
$25.90 |
|
|
Earnings |
13.18 |
$25.04 |
$20.82 |
$22.14 |
$23.72 |
|
|
Average |
$24.70 |
$22.89 |
$23.66 |
$24.76 |
$23.08 |
|
|
Current Price |
$15.24 |
|||||
|
Discount To Fair Value |
38.29% |
33.42% |
35.60% |
38.46% |
33.98% |
|
|
Upside To Fair Value (NOT Including Dividends) |
62.05% |
50.20% |
55.28% |
62.49% |
51.47% (58% including dividend) |
|
|
2022 EPS |
2023 EPS |
2022 Weighted EPS |
2023 Weighted EPS |
12-Month Forward EPS |
12-Month Average Fair Value Forward PE |
Current Forward PE |
|
$1.58 |
$1.68 |
$1.19 |
$0.42 |
$1.61 |
14.4 |
9.5 |
BASF is trading at 9.5X earnings and 6.5X adjusted for cash.
-
no long-term investor
-
who avoids becoming a forced seller for emotional or financial reasons
-
has ever regretted buying BASF at 9.5X earnings
-
and all the data we have indicates an 80% statistical probability today won’t be the first time
|
Analyst Median 12-Month Price Target |
Morningstar Fair Value Estimate |
|
$20.57 (12.2 PE) |
$22.00 (13.7 PE) |
|
Discount To Price Target (Not A Fair Value Estimate) |
Discount To Fair Value |
|
25.91% |
30.73% |
|
Upside To Price Target (Not Including Dividend) |
Upside To Fair Value (Not Including Dividend) |
|
34.97% |
44.36% |
|
12-Month Median Total Return Price (Including Dividend) |
Fair Value + 12-Month Dividend |
|
$21.56 |
$22.99 |
|
Discount To Total Price Target (Not A Fair Value Estimate) |
Discount To Fair Value + 12-Month Dividend |
|
29.32% |
33.71% |
|
Upside To Price Target ( Including Dividend) |
Upside To Fair Value + Dividend |
|
42.62% |
50.86% |
Our fair value estimate is within 5% of Morningstar’s.
-
the average DK fair value estimate is 1.5% below Morningstar’s across 507 companies
Analysts expect a 43% total return in the next year, and that forecast is 100% justified by BASF’s fundamentals.
-
if BASF returns to historical fair value and grows as expected in the next 12 months it could deliver a 58% total return
|
Rating |
Margin Of Safety For Low-Risk 13/13 Ultra SWAN Quality Companies |
2022 Price |
2023 Price |
12-Month Forward Fair Value |
|
Potentially Reasonable Buy |
0% |
$22.89 |
$23.66 |
$23.08 |
|
Potentially Good Buy |
20% |
$18.31 |
$18.93 |
$18.47 |
|
Potentially Strong Buy |
30% |
$16.02 |
$16.56 |
$16.16 |
|
Potentially Very Strong Buy |
40% |
$10.99 |
$14.20 |
$13.85 |
|
Potentially Ultra-Value Buy |
50% |
$11.44 |
$11.83 |
$11.54 |
|
Currently |
$15.24 |
33.42% |
35.60% |
33.98% |
|
Upside To Fair Value (Not Including Dividends) |
50.20% |
55.28% |
51.47% |
For anyone comfortable with its risk profile, BASF is a potentially strong buy, and here’s why.
Long-Term Consensus Total Return Potential That’s Incredible Strong
For context, here’s the return potential of the 21% overvalued S&P 500.
|
Year |
EPS Consensus |
YOY Growth |
Forward PE |
Blended PE |
Overvaluation (Forward PE) |
Overvaluation (Blended PE) |
|
2021 |
$206.30 |
50.38% |
20.7 |
21.9 |
20% |
25% |
|
2022 |
$225.37 |
9.24% |
20.6 |
20.6 |
19% |
17% |
|
2023 |
$248.05 |
10.06% |
18.7 |
19.6 |
9% |
11% |
|
2024 |
$275.12 |
10.91% |
16.8 |
17.8 |
-2% |
1% |
|
12-Month forward EPS |
12-Month Forward PE |
Historical Overvaluation |
PEG |
25-Year Average PEG |
S&P 500 Dividend Yield |
25-Year Average Dividend Yield |
|
$227.28 |
20.378 |
20.94% |
2.40 |
3.62 |
1.41% |
2.01% |
(Source: DK S&P 500 Valuation And Total Return Tool)
Stocks have already priced in 98% EPS growth from 2020 through 2024 and are trading at 20X forward earnings.
-
16.85 is the 25-year average
-
16.9 is the 10-year average (low rate era)
-
A 16.2% correction needed to get back to the historical market fair value
S&P 500 2027 Consensus Return Potential
|
Year |
Upside Potential By End of That Year |
Consensus CAGR Return Potential By End of That Year |
Probability-Weighted Return (Annualized) |
Inflation And Risk-Adjusted Expected Returns |
Expected Market Return Vs Historical Inflation-Adjusted Return |
|
2027 |
30.90% |
5.53% |
4.15% |
0.58% |
8.92% |
(Source: DK S&P 500 Valuation And Total Return Tool)
Adjusted for inflation, the risk-expected returns of the S&P 500 are about 0.6% for the next five years.
-
1/11th the S&P’s historical inflation-adjusted returns are 6% to 7% CAGR
|
S&P Earnings Yield |
10-Year US Treasury Yield |
Earning Yield Risk-Premium (3.7% 10 and 20-year average) |
|
4.91% |
2.42% |
2.49% |
|
Theoretical Interest Rate Justified Market Fair Value Forward PE |
Current PE |
Theoretically Interest Rate Justified Market Decline |
|
16.34 |
20.38 |
19.82% |
(Source: DK S&P 500 Valuation And Total Return Tool) updated weekly
Even adjusting for interest rates, stocks still require an even larger 20% correction before they become theoretically fairly valued.
But here’s what investors buying BASF today can reasonably expect if BASF grows as expected over the next five years.
-
5-year consensus return potential range: 19% to 22% CAGR
BASF 2024 Consensus Total Return Potential
FAST Graphs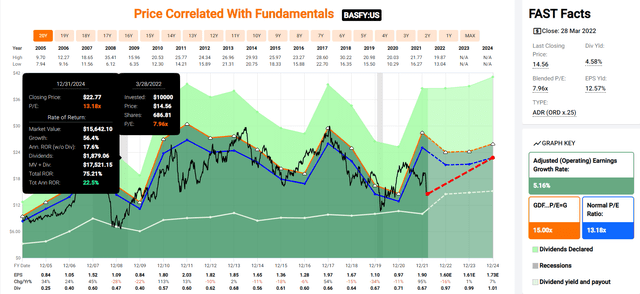
If BASF grows as expected and returns to the low end of historical fair value, it could deliver 75% total returns or 23% annually over the next three years.
BASF 2027 Consensus Total Return Potential
FAST Graphs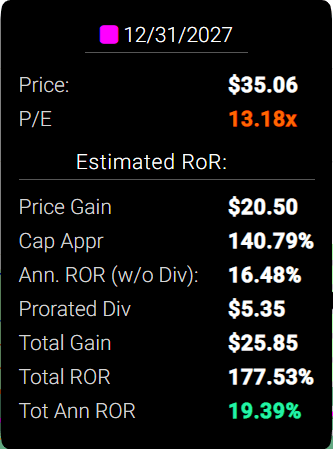
If BASF grows as analysts expect over the next five years and returns to the low end of historical fair value, it could nearly triple your money.
-
Buffett-like 19% annual return potential
-
6X that of the S&P 500
|
Investment Strategy |
Yield |
LT Consensus Growth |
LT Consensus Total Return Potential |
Long-Term Risk-Adjusted Expected Return |
Long-Term Inflation And Risk-Adjusted Expected Returns |
Years To Double Your Inflation & Risk-Adjusted Wealth |
10 Year Inflation And Risk-Adjusted Return |
|
BASF |
6.5% |
11.0% |
17.5% |
12.3% |
10.1% |
7.1 |
2.61 |
|
Europe |
2.6% |
12.8% |
15.4% |
10.7% |
8.6% |
8.4 |
2.27 |
|
Value |
2.1% |
12.1% |
14.1% |
9.9% |
7.7% |
9.3 |
2.10 |
|
High-Yield |
2.8% |
11.3% |
14.1% |
9.9% |
7.7% |
9.4 |
2.10 |
|
High-Yield + Growth |
1.7% |
11.0% |
12.7% |
8.9% |
6.7% |
10.8 |
1.91 |
|
Safe Midstream + Growth |
3.3% |
8.5% |
11.8% |
8.3% |
6.1% |
11.8 |
1.80 |
|
Nasdaq (Growth) |
0.8% |
10.7% |
11.5% |
8.1% |
5.9% |
12.3 |
1.77 |
|
Safe Midstream |
5.3% |
6.0% |
11.3% |
7.9% |
5.7% |
12.6 |
1.75 |
|
Dividend Aristocrats |
2.2% |
8.9% |
11.1% |
7.8% |
5.6% |
12.9 |
1.72 |
|
REITs + Growth |
1.8% |
8.9% |
10.6% |
7.4% |
5.2% |
13.7 |
1.67 |
|
S&P 500 |
1.4% |
8.5% |
9.9% |
7.0% |
4.8% |
15.1 |
1.59 |
|
Dividend Growth |
1.6% |
8.0% |
9.6% |
6.7% |
4.5% |
15.9 |
1.56 |
|
REITs |
2.9% |
6.5% |
9.4% |
6.6% |
4.4% |
16.4 |
1.54 |
|
60/40 Retirement Portfolio |
2.1% |
5.1% |
7.2% |
5.1% |
2.9% |
24.9 |
1.33 |
|
10-Year US Treasury |
2.4% |
0.0% |
2.4% |
1.7% |
-0.5% |
-144.0 |
0.95 |
(Source: Morningstar, FactSet, Ycharts)
Just like it’s done for the last 25 years, analysts expect 11% long-term growth from BASF.
But thanks to a much lower valuation, analysts expect long-term returns of potentially 17.5% CAGR.
-
better than the S&P, aristocrats, Nasdaq, and every popular investment strategy on Wall Street
BASF is currently in a 40% bear market, which means incredible long-term return opportunities.
BASF Rolling Returns Since 1997
-
since 1997 BASF has grown by 11.5% CAGR
-
and delivered average rolling returns of 13% to 14% CAGR, 2X that of the S&P 500
-
from bear market lows returns as strong as 20.3% CAGR
-
16X return over 15 years
-
Buffett-like return potential from a blue-chip bargain hiding in plain sight
BASF Investment Decision Score
Dividend Kings Dividend Kings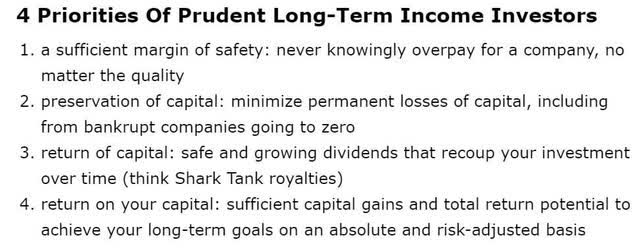

For anyone comfortable with its risk profile, BASF is as close to a perfect high-yield blue-chip bargain opportunity as exists on Wall Street.
-
34% discount vs 21% market premium = 65% better valuation
-
superior fundamental quality and safety
-
75% higher long-term return potential than S&P 500 overtime
-
almost 4X the risk-adjusted expected return for the next five years
-
almost 5X the market’s yield
But before you start measuring the drapes for your penthouse, don’t forget that low-risk blue-chips still carry some risk.
Risk Profile: Why BASF Isn’t Right For Everyone
There are no risk-free companies and no company is right for everyone. You have to be comfortable with the fundamental risk profile.
What Could Cause BASF’s Investment Thesis To Break
-
safety falls to 40% or less
-
balance sheet collapses
-
business model completely disrupted
-
management’s major growth projects fail (due to crashing commodity prices)
-
growth outlook falls to less than 3.5% for four years
-
BASF’s role in a portfolio is to deliver long-term 10+% returns with minimal fundamental risk
-
like all non-defensive sectors (anything that’s not REITs, utilities, midstream, healthcare, telecom, consumer staples), I target 10+% long-term return potential for all recommendations
BASF Risk Profile Summary
“BASF has a medium uncertainty rating. As a large producer of commodity chemicals with hydrocarbon-based feedstocks, BASF is exposed to fluctuations in oil and gas prices. However, the shift toward speciality chemicals helps to reduce volatility. End markets are well diversified, although the cyclical markets generate roughly 60%-70% of sales.
Geographically, the firm remains largely weighted toward Europe, with around half of sales destined for the region. As a result, the European business cycle is a key driver of financial performance. The chemicals business is generally capital-intensive and dependent on high utilisation rates to generate adequate returns.
New production facilities can take three to six years to mature after the initial investment. As a result, the demand expected at the time capital was committed may not be there when the production facility is complete, which could impair financial results for several years.
Like most chemical firms, BASF’s environmental, social, and governance risks are mainly related to production, storage, and transportation of hazardous substances and emissions of wastewater and air pollutants.
Regulatory changes could increase operating costs, require capital investments to meet new standards, increase liability risks, or outright ban certain process chemicals deemed acceptable that may not have an economical substitute. Previously undiscovered soil and ground water contamination on operating sites could lead to material fines or other penalties in the future.
BASF faces somewhat higher risks than other chemical firms because of its agricultural chemicals business, where products can be linked to environmental concerns.
In particular, BASF is involved in litigation around its dicamba-based Engenia herbicide. Many German chemical firms, like BASF, benefit from various subsidies in Germany that result in artificially low electricity prices. Change or cancellation of the same could materially increase energy costs.” – Morningstar (emphasis added)
BASF’s Risk Profile Includes
-
economic cyclicality risk: EU might experience a recession within a year
-
investment risk: projects can take six years to bring online and the industry outlook can change a lot in that time
-
energy price risk: the main input cost and energy prices have soared in recent months
-
this is a very capital intensive industry: maintenance capex is a fixed cost that threatens free cash flow and the dividend in a recession
-
regulatory/political risk (pertaining to tax rates, environmental regulations, and electricity subsidies in Germany)
-
litigation risk (from substances harming consumers)
-
green energy transition execution risk
-
M&A execution risk
-
talent retention risk (very tight job market in Europe, though not as bad as the US)
-
supply chain disruption risk (causing havoc globally right now)
-
cyber security risk: hackers and ransomware
BASF’s automotive-related businesses continued to be negatively impacted by the semiconductor shortage…
We assume that the semiconductor shortage will persist, at least in the first half of 2022.” – CEO/CFO, Q4 conference call
Some analysts expect the auto-chip shortage to last into 2023.
Surging natural gas prices in Europe added approximately $1.7 billion in costs in 2021 and the bill might be larger in 2022.
-
Russia has demanded Europe pay for its gas in Rubles
-
Europe has refused
-
Putin has threatened to shut off Russian gas flows to Europe
-
Russian gas production for Europe is specialized
-
the production fields and pipelines only go to Europe
-
shutting down production means Russia would have to burn the gas and receive no money
-
gas pipelines take many years to build
-
so this is likely a hollow threat
-
but in a worst-case scenario, European gas prices could soar from $35 per MMBtu (7X that of the US) by another 2X to 3X
Energy costs are a major input expense for BASF and management’s 2022 guidance assumes $71 average global oil prices.
-
Brent is trading at $110 right now
-
and has been as high as $130
-
and if the Russian invasion continues and Chinese lockdowns end Bank of America’s base case is $150 Brent for most of 2022
-
worst-case (Russian oil embargo) is $200 Brent
In the worst-case scenario, in which gas triples to $100 and oil doubles to $200, BASF’s free cash flows could collapse, and require it to borrow to cover its dividend.
-
a credit negative that could threaten its A-credit rating
-
and potentially pressure management to cut the dividend
High maintenance capex costs are expected to grow over time, as BASF completes its growth projects and must maintain them in good order.
-
from $3.1 billion in 2020
-
to $4.5 billion in 2025
Maintenance capex is a fixed cost that operating cash flows will have to overcome in order to generate free cash flow that pays the generous and steadily growing dividend.
Recession Watch
BASF’s business model is highly sensitive to economic cycles.
The bond futures market expects the 10-2 yield curve to invert in June and a mild recession to begin around February 2024.
|
Bonds |
Yield |
|
3-Month Treasury Yield |
0.57% |
|
2-Year Treasury Yield |
2.34% |
|
10-Year Treasury Yield |
2.42% |
|
10-3M Curve (Most Accurate Recession Forecasting Tool) |
1.85% |
|
10-2 Curve (Most Popular Yield Curve Followed By Wall Street) |
0.08% |
|
Bond Futures Pricing In Inversion |
June 2022 |
|
Bond Futures Pricing In Recession Start |
January 2024 |
|
Potential Historically Average Recession Start If Curve Inverts Now (March 30th, 2022) |
October 30th, 2023 |
|
Potential Historically Average Bear Market Start If Curve Inverts Now (March 30th, 2022) |
September 8th, 2023 |
(Source: DK S&P 500 Valuation and Total Return Tool)
The bond market is becoming increasingly worried about a Fed policy mistake causing a recession next year.
The 10-2 curve is the most closely watched by Wall Street but a study from the NY Fed finds that the 10-3 curve is the most accurate at forecasting recessions.
The St. Louis Fed’s model, based on four economic metrics, estimates a 0.08% chance we’re in a recession right now.
The NY Fed’s model estimates a 6% chance of a recession within a year.
Currently, the bond market is mildly concerned about recession risk and we are monitoring the situation closely each day.
-
A recession scare could occur in 2022
-
yield curve + BaR economic grid makes it very likely that we’ll see a recession coming at least 10 months out
How do we quantify, monitor, and track such a complex risk profile? By doing what big institutions do.
Material Financial ESG Risk Analysis: How Large Institutions Measure Total Risk
Here is a special report that outlines the most important aspects of understanding long-term ESG financial risks for your investments.
-
ESG is NOT “political or personal ethics based investing”
-
it’s total long-term risk management analysis
“ESG is just normal risk by another name.” Simon MacMahon, head of ESG and corporate governance research, Sustainalytics” – Morningstar
ESG factors are taken into consideration, alongside all other credit factors, when we consider they are relevant to and have or may have a material influence on creditworthiness.” – S&P
ESG is a measure of risk, not of ethics, political correctness, or personal opinion.
S&P, Fitch, Moody’s, DBRS (Canadian rating agency), AMBest (insurance rating agency), R&I Credit Rating (Japanese rating agency), and the Japan Credit Rating Agency have been using ESG models in their credit ratings for decades.
-
credit and risk management ratings make up 41% of the DK safety and quality model
-
dividend/balance sheet/risk ratings make up 82% of the DK safety and quality model
BASF Long-Term Risk Management Consensus
|
Rating Agency |
Industry Percentile |
Rating Agency Classification |
|
MSCI 37 Metric Model |
75.0% |
A, Above-Average, Negative Trend |
|
Morningstar/Sustainalytics 20 Metric Model |
86.0% |
25.2/100 Medium-Risk (Similar To Dividend Aristocrats) |
|
Reuters’/Refinitiv 500+ Metric Model |
100.0% |
#1 Industry Leader, Excellent |
|
S&P 1,000+ Metric Model |
49.0% |
Average, Negative Trend |
|
FactSet |
50.0% |
Average, Positive Trend |
|
Morningstar Global Percentile (All 15,000 Rated Companies) |
57.3% |
Average |
|
Consensus |
70% |
Low-Risk, Good Risk-Management, Stable Trend |
(Sources: Morningstar, Reuters’, JustCapital, S&P, FactSet Research)
BASF’s Long-Term Risk Management Is The 188th Best In The Master List (63rd Percentile)
-
Dividend Champions: 57th percentile – average
-
Monthly Dividend Stocks: 60th percentile – above-average
-
Hyper-Growth stocks: 61st percentile – above-average
-
Master List average: 62nd percentile -above-average
-
Dividend Kings: 63rd percentile -above-average
-
Dividend Aristocrats: 67th percentile -above-average
-
BASF: 70th percentile – good
-
Ultra SWANs: 71st percentile – good
-
Foreign Dividend Stocks: 75th percentile – good
-
Strong ESG Stocks: 78th percentile – good bordering on very good
BASF’s risk-management consensus is in the top 37% of the world’s highest quality companies and similar to that of such other companies as
-
Enterprise Products Partners (EPD)
-
Altria (MO) – dividend king
-
Royal Bank of Canada (RY)
-
Consolidated Edison (ED) – dividend aristocrat
-
V.F. Corp (VFC) – dividend king
-
Kimberly-Clark (KMB) – dividend aristocrat
-
Ecolab (ECL) – dividend aristocrat
-
West Pharmaceutical Services (WST) – dividend champion
-
Nestle (OTCPK:NSRGY)
The bottom line is that all companies have risks, and BASF is good at managing theirs.
How We Monitor BASF’s Risk Profile
-
24 analysts
-
3 credit rating agencies
-
7 total risk rating agencies
-
31 experts who collectively know this business better than anyone other than management
-
and the bond market for real-time fundamental risk-assessments
“When the facts change, I change my mind. What do you do sir?” – John Maynard Keynes
There are no sacred cows at iREIT or Dividend Kings. Wherever the fundamentals lead we always follow. That’s the essence of disciplined financial science, the math retiring rich and staying rich in retirement.
Bottom Line: BASF Is One Of The Best 6.5% Yielding Blue-Chip Bargains You’ve Never Heard Of
It might seem like all the bargain-hunting opportunities vanished in the last two weeks, but remember it’s always and forever a market of stocks, not a stock market.
Reasons To Potentially Buy BASF (Even With 2024 Recession Risk Rising)
-
76% quality low-risk 10/13 blue-chip chemical company
-
safe 6.5% yield (74% safety score)
-
1-year dividend growth streak, frozen in the pandemic, but no cuts since the Great Recession
-
34% conservatively undervalued (potential strong buy)
-
Fair Value: $23.08 (14.4X earnings)
-
9.5X earnings vs 13 to 14.5 historical
-
6.5X cash adjusted PE
-
A stable outlook credit rating = 0.66% 30-year bankruptcy risk
-
risk management consensus 70th industry percentile = Good
-
8% to 13% CAGR margin-of-error growth consensus range
-
11.0% CAGR median growth consensus
-
5-year consensus total return potential: 19% to 22% CAGR
-
base-case 5-year consensus return potential: 19% CAGR (6X market consensus)
-
consensus 12-month total return forecast: 43% (12.2 PE, very reasonable)
-
Fundamentally Justified 12-Month Returns: 58% CAGR
If you’re looking for a safe 6.5% yield with growth potential that puts the market to shame, consider BASF.
If you’re looking for a screaming bargain in this overheated market consider BASF.
If you’re looking for sensible investments that combine incredible yield, value, growth, and return potential, look no further than BASF.
I can’t tell you what the market will do tomorrow, next week, or even this year.
What I can tell you is that no long-term investor in history who avoided becoming a forced seller for emotional or financial reasons, has ever regretted buying BASF at today’s valuations.
And based on the best available data we have, I can say with 80% confidence that today won’t be the first time.
In fact, with the potential to triple in the next five years, buying BASF now is a high probability decision that is likely to make you feel like a stock market genius.
Author’s note: Brad Thomas is a Wall Street writer, which means he’s not always right with his predictions or recommendations. Since that also applies to his grammar, please excuse any typos you may find. Also, this article is free: written and distributed only to assist in research while providing a forum for second-level thinking.
Be the first to comment