

jkitan/E+ via Getty Images
Earlier this year, I identified EastGroup Properties, Inc. (NYSE:EGP) as one of 12 REITs (real estate investment trusts) likely to outperform in 2022. That prediction hasn’t panned out so far. As of July 26 closing, EGP has returned (-26.29)%, while the average REIT as represented by the Vanguard Real Estate ETF (VNQ) has returned (-17.34)%.
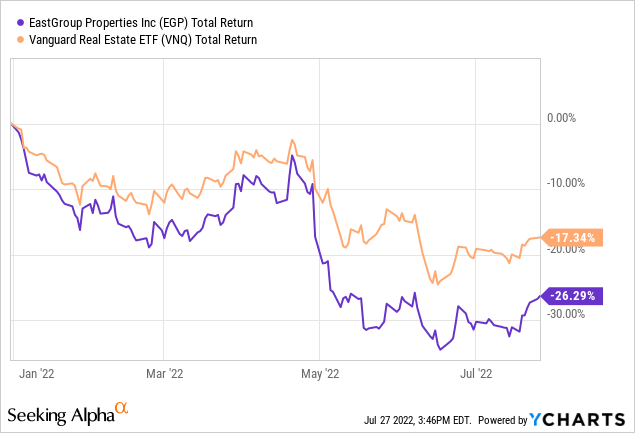
I also predicted Industrial REITs would outperform the REIT average this year. That prediction isn’t doing well, either. According to leading REIT sector analyst Hoya Capital Income Builder, Industrial REITs have returned (-21.85)% this year, compared to the Equity REIT average of (-17.82)%.
Hoya Capital Income Builder
However, the year is only half over, so there is still time for things to change. Meanwhile, EastGroup Properties is in great shape, and just reported an earnings beat, and raised guidance.
Meet the company
EastGroup Properties
Founded in 1969, and headquartered in Jackson, Mississippi, EastGroup Properties owns and operates multi-tenant, shallow bay warehouse facilities totaling just over 50 msf (million square feet), in 25 primary and secondary markets spread across 11 states. At $7.1 billion, the company sits squarely in the market cap sweet spot, the ideal size for total return. The company has built 47% of their current portfolio themselves, rather than acquiring.
Company website
Harvard MBA Marshall Loeb has been the President and CEO since 2016, following 25 prior years of experience in real estate.
Of course, real estate is all about location. EastGroup focuses on:
- Multi-tenant distribution properties
- In urban areas
- In major Sunbelt markets
- Infill sites in supply-constrained submarkets
- In choice last-mile e-commerce locations
- Around transportation facilities in high-growth areas.
Over 80% of the company’s square footage and 85% of ABR (annual base rent) are concentrated in four Sunbelt states:
| State | % of EGP Square footage | % of EGP ABR |
| Texas | 36% | 34% |
| Florida | 25% | 24% |
| California | 15% | 21% |
| Arizona | 7% | 7% |
| Other | 17% | 14% |
EastGroup also gravitates toward smaller facilities of 60,000 to 125,000 square feet, for which the new supply pipeline is smaller.
Company investor presentation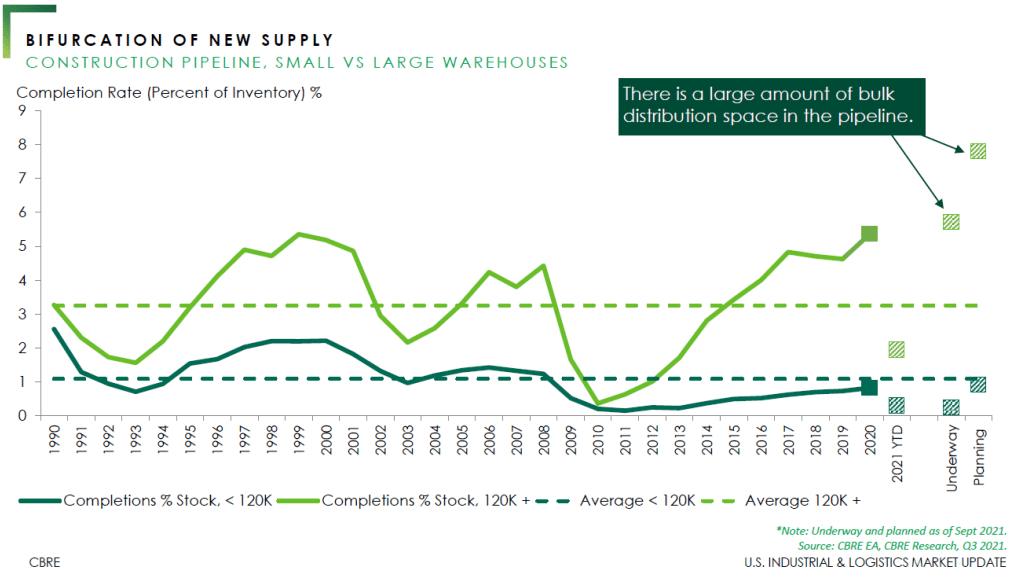
EGP seeks customers that need to stay in their current location for business reasons, and typically need 15K to 70K square feet. Their historic lease retention rate is right at 70%, and rose to 76% in Q2 2022, according to the newest 10-Q. Fully 82% of their customers lease less than 100,000 square feet. Because of this focus, the tenant roster is highly diverse, with the top 10 tenants accounting for only 9.4% of ABR, according to the company’s July investor presentation.
Their strategy on new development is a little different than most. They prefer to build value-add facilities in markets where they already have acquired space, often creating a park-like setting.
Company investor presentation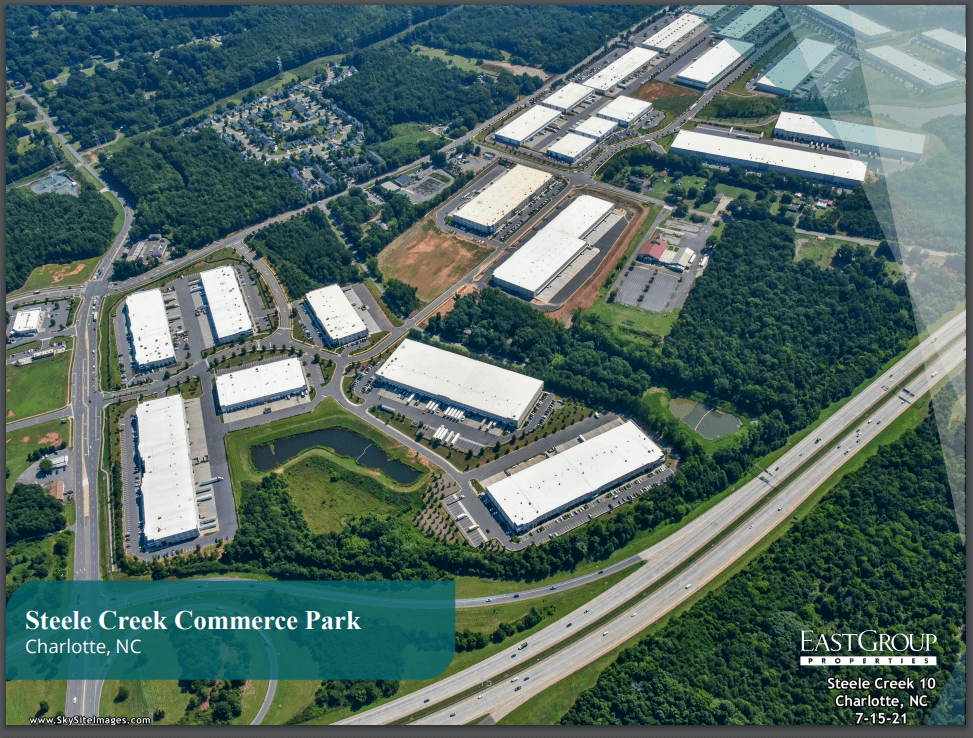
Quarterly results hot off the presses
The company just reported Q2 2022 earnings. Here are the highlights:
- Revenues of $118.5 million, up 19% YoY (year-over-year).
- Net income of $46.2 million, up 67% YoY.
- Net income attributable to shareholders of $1.09, up 58% YoY.
- EBITDA of $96.2 million, up 38% YoY.
- FFO per share $1.72, up 17% YoY.
- Same-property NOI of $73.8 million, up 9.5% YoY.
- Same-property occupancy of 98.2%.
- Portfolio 99.1% leased and 98.5% occupied as of June 30.
- New lease spreads of 35.8% and renewal leasing spreads of 37.8%, for an eye-popping blended rate of 37.2%, bringing 2022 blended spreads to 35.2%.
- Net cash from operations of $176.2 million, up 25% YoY.
Also during Q2, EGP acquired Tulloch Corporation, and its 14 properties in San Francisco and Sacramento, totaling approximately 1.7 msf, along with 10.5 acres of land. The company also:
- completed 3 development and value-add projects totaling 842,000 square feet, already 99% leased, with a projected stabilized yield of 6.2%,
- acquired another 116.8 acres of land for $35 million,
- acquired 229,000 square feet of value-add properties for $47 Million, and
- started construction on three new development projects (522,000 square feet) with projected total costs of $70 million.
The development and value-add pipeline now includes 28 projects in 15 cities, totaling 4.6 msf as of June 30, for a projected total investment of $558 million.
EastGroup also sold a 42,000 square foot property in Houston for $13 million, realizing a gain of $11 million. Overall, the company is expanding rapidly.
The company also raised funds from operations (“FFO”) per share guidance from $6.75 at the midpoint to $6.90.
Growth metrics
Here are the 4-year growth figures for FFO, TCFO (total cash from operations), and market cap.
| Metric | 2017 | 2018 | 2019 | 2020 | 2021* | CAGR |
| FFO (millions) | $145.1 | $165.9 | $186.9 | $211.6 | $239.6 | — |
| FFO Growth % | — | 14.3 | 12.7 | 13.2 | 13.2 | 13.4% |
| FFO per share | $4.26 | $4.67 | $4.98 | $5.38 | $6.09 | — |
| FFO per share Growth % | — | 9.6 | 6.6 | 8.0 | 13.2 | 9.4% |
| TCFO (millions) | $155.0 | $164.7 | $195.9 | $196.3 | $321.6 | — |
| TCFO Growth % | — | 6.3 | 18.9 | 1.0 | 63.8 | 20.0% |
| Market Cap (billions) | $3.04 | $3.34 | $5.16 | $5.46 | $8.84 | — |
| Market Cap Growth % | — | 9.9 | 54.5 | 5.8 | 61.9 | 58.1% |
Source: TD Ameritrade, CompaniesMarketCap.com, and author calculations
EGP’s growth rate in FFO and TCFO has been nothing short of spectacular, and as quarterly results show, that growth continues. Together with the company’s liquidity ratio of 2.06, this company qualifies as a bona fide FROG (fast rate of growth).
Thanks to this year’s sell-off, market cap has fallen to $7.1 billion, but it remains in the market cap sweet spot. Market cap growth CAGR for the past 4.5 years has moderated to a still-sizzling 23.0%.
Meanwhile, here is how the stock price has done over the past 3 twelve-month periods, compared to the REIT average as represented by the Vanguard Real Estate ETF.
| Metric | 2019 | 2020 | 2021 | 2022 | 3-yr CAGR |
| EGP share price July 27 | $120.90 | $124.07 | $176.11 | $164.12 | — |
| EGP share price Gain % | — | 2.6 | 41.9 | (-6.8) | 10.72% |
| VNQ share price July 27 | $88.29 | $78.94 | $106.50 | $95.34 | — |
| VNQ share price Gain % | — | (-10.6) | 34.9 | (-10.5) | 1.51% |
Source: MarketWatch.com and author calculations
EGP has outperformed the VNQ in each of the past 3 years, rewarding investors with an average gain of 10.72% per annum, compared to the VNQ’s mere 1.51%. Despite the selloff thus far this year, EGP’s returns for investors have historically been in the double digits for many years.
Company investor presentation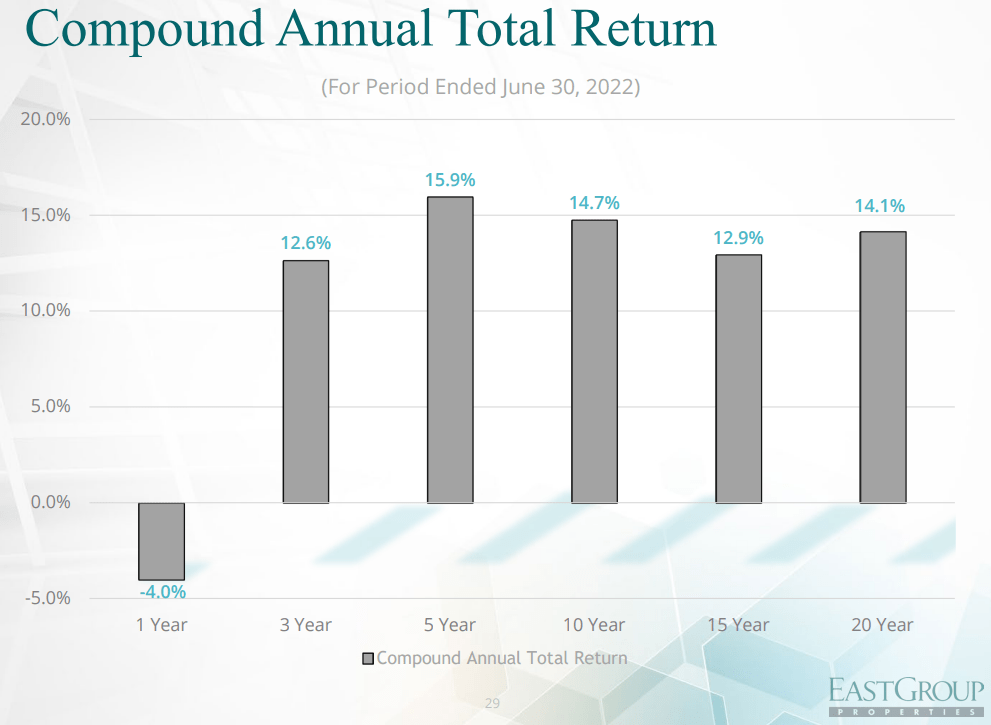
The selloff thus far this year has created an attractive entry point for initiating or enhancing a position.
Balance sheet metrics
EGP has a very sturdy balance sheet, with an exceptionally low debt ratio and Debt/EBITDA.
| Company | Liquidity Ratio | Debt Ratio | Debt/EBITDA | Bond Rating |
| EGP | 2.06 | 14% | 5.0 | Baa2 |
Source: Hoya Capital Income Builder, TD Ameritrade, and author calculations
EGP reported $5.56 million in cash and cash equivalents on hand as of June 30, over against $1.62 billion in debt, only $58,000 of which comes due this year. Debt maturities are pretty evenly spaced from 2023 – 2026, varying from $115 million in 2023 to $145 million in 2025. Even assuming no growth in earnings, servicing this level of debt is well within the company’s capabilities.
EastGroup Properties Debt Maturity Schedule (Company 10-Q for Q2 2022)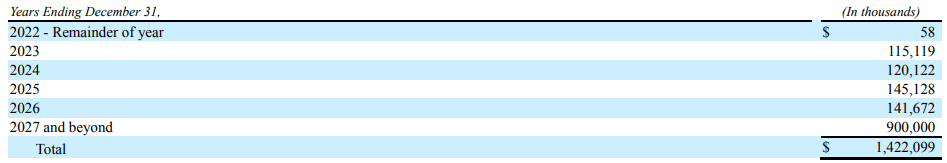
Dividend metrics
EGP has raised its dividend every year for the past 10 years, with no dividend cuts in 29 years. And we’re not talking about small increases, like many of the so-called dividend aristocrats. The 3-year dividend growth rate is a stellar 13.6% and the 5-year is 10.1%. The Dividend Safety rating is an attractive C+, striking a nearly ideal balance between paying cash to the investor and retaining money to grow the business.
| Company | Div. Yield | 3-yr Div. Growth | Div. Score | Payout | Div. Safety |
| EGP | 2.68% | 13.6% | 3.46 | 64% | C+ |
Source: Hoya Capital Income Builder, TD Ameritrade, Seeking Alpha Premium
Like most Industrial REITs, EGP pays a below-average initial Yield, but its dividend growth rate means that within 4 years, the investor’s yield actually experienced will catch up with the REIT average, and EGP will out-yield the field from year 5 onward.
Dividend Score projects the Yield three years from now, on shares bought today, assuming the Dividend Growth rate remains unchanged.
Valuation metrics
EGP currently trades at a Price/FFO slightly higher than the REIT average, but a shade lower than the average Industrial REIT. This premium seems well-justified, given the company’s stellar growth rates.
| Company | Div. Score | Price/FFO ’22 | Premium to NAV |
| EGP | 3.46 | 24.1 | 0.1% |
| Industrial REITs | 3.11 | 26.4 | 1.3% |
| Overall REIT average | 3.66 | 19.8 | (-5.0)% |
Source: Hoya Capital Income Builder, TD Ameritrade, and author calculations
Of course, the combination of below-average Yield and above-average Price/FFO will not appeal to value investors. EGP is a growth play, and for the moment, growth is still out of style. But according to research by Hoya Capital, REITs that sell for slightly elevated Price/FFO tend to outperform on total return. EGP will be no exception.
What could go wrong?
Because of the company’s penchant for developing their own facilities, construction costs and supply chain disruptions could cut into cap rates on new facilities.
Competition for acquisitions is fierce, and the company is expanding into markets where they have not done business before, adding risks due to the company’s unfamiliarity with the new territory.
Downturns in Sunbelt markets, or in cities like Houston and Dallas, where EGP has large concentrations of facilities, may affect the tenants’ ability to pay rent.
Continued increases in interest rates could restrict acquisition and development opportunities, and compress cap rates.
Civil war would be bad for most kinds of real estate, but particularly bad for industrial REITs, because of their vital importance to the supply chain.
Investor’s bottom line
For years now, EastGroup Properties has been a growth juggernaut for revenue, cash flow, dividend, and market cap. When REITs and growth come back into style, share prices on this little-known jewel will soar. In fact, there is a key technical indicator signaling that this may have already begun: EGP’s 10-day simple moving average recently crossed above its 50-day.
EGP Price with moving averages (TD Ameritrade)
Indeed, REITs may be coming back into favor, as the VNQ is within inches of doing the same thing. Unless a hidden trap door opens in the REIT world, it is likely that the VNQ has bottomed.
VNQ Price with moving averages (TD Ameritrade)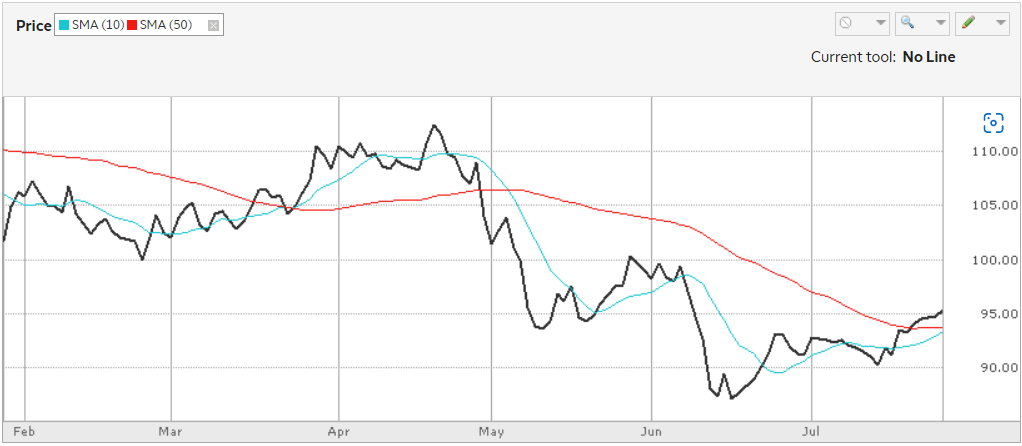
Insiders have bought $98,000 worth of shares in EGP in the past 3 months, while hedge funds have trimmed $45,400. The company has achieved a 12.9% return on equity and a 21.3% increase in assets in the past 12 months.
For all these reasons, I rate EastGroup Properties a solid Buy. The Street, Ford Equity Research, Zacks, and CFRA all concur with this prediction.
The Seeking Alpha Quant Ratings and Wall Street Analysts rate EGP a Hold. The Quant ratings love everything about the company except the price.
Seeking Alpha Premium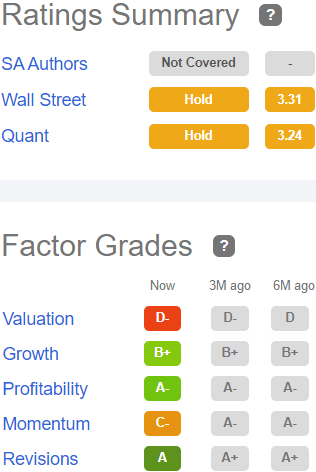
The average price target from the 16 Wall Street analysts that cover this firm is $187.86, implying an upside of 14.4%, but the highest price target is $248, implying 51.1% upside, and I personally think this latter target is more likely to be accurate over the next two years. To me, EastGroup Properties is a FROG in the early stages of its next big leap.
Be the first to comment