

GoodLifeStudio/iStock via Getty Images
Introduction
After a long period in which interest rates were virtually zero following emergency rate cuts in March 2020, the Federal Reserve moved again two years later to raise the federal funds rate to counter the current high inflation. Rising interest rates put pressure on stocks and bonds, and investors had to watch their portfolio values fall in part because of the Federal Reserve’s new course.
In this article, I will discuss the concept of duration, which according to many textbooks can only be applied to interest-bearing assets, i.e., bonds. However, the concept can also be applied to equities. In fact, duration is an aspect to consider in one’s due diligence before investing.
I will first explain some aspects of risk management, focusing on interest rate risk. Then I will give an easy-to-understand explanation of the concept of duration, along with a little mathematical background, which of course can be skipped. It will show how and why investors in long-term bonds have dramatically underperformed to date.
In the main body of the article, I will apply the concept to stocks and explain three approaches to estimating the duration of stocks, focusing on a value and a growth stock: McKesson Corp (NYSE:MCK), the large pharmaceutical retailer, and PayPal (NASDAQ:PYPL), the well-known fintech and online payment system operator.
A Brief Digression To Measuring Risk
Someone planning to invest in bonds usually considers several types of risks in his assessment, such as credit risk, operational risk and market risk. It is no coincidence that the Capital Requirements Regulation (CRR) focuses on these three types of risks in the context of defining the capital adequacy of financial institutions.
Credit risk refers to the probability of default of the bond issuer in the simplest sense and is not discussed in this article, nor is operational risk, which refers to the uncertainties and hazards that an entity faces in its day-to-day operations. Of course, these two types of risk are closely related, as a company can become insolvent due to inadequately managed operational risks, for example.
Market risk in the context of equities can be viewed as the risk of general market fluctuations (systematic market risk) or company-specific changes in share prices due to changes in operational performance (unsystematic market risk). Thus, market risk can also be related to the above (and several other) forms of risk, and it is difficult to clearly differentiate between them. In the context of debt investments, systematic market risk represents the risk of changes in interest rates (e.g., federal funds rate), while unsystematic market risk, in turn, is related to the operational performance of the issuer.
In the first part of this article, I will focus on systematic market risk from the perspective of an investor who invests in debt securities, since the theory is equally valid when investing in stocks, but is much easier to understand using bonds as an example.
What Exactly Is Duration, And When Does It Signal Danger?
When assessing the risk of a potential investment in a bond, the investor considers several aspects such as the issuer’s credit rating, the currency, the coupon rate and, of course, the maturity. It is not sufficient to look only at the overall maturity when assessing the interest rate sensitivity of a bond, because the coupon rate plays an important role in the bond’s actual “duration”.
In 1938, economist Frederick Macaulay developed a concept that provides a better understanding of a bond’s interest rate sensitivity – duration. Those who are not interested in the mathematical background of this concept can skip directly to the last paragraph of this section, which contains a simple illustration of the concept as well as the key takeaways.
Macaulay duration is a mathematical concept that refers to the average capital commitment period of an investment in a bond and does not necessarily correspond to the maturity date. This becomes clear when comparing a zero-coupon bond to a conventional bond with semi-annual payments: the latter is less sensitive to changes in interest rates because the investor recovers a portion of his investment in regular installments through coupon payments. A dollar earned today is worth more than a dollar earned in a few years. In general, a bond with a very high coupon rate has a shorter duration than a bond with a lower coupon rate. A zero-coupon bond is therefore the riskiest way to invest in bonds from an interest rate sensitivity perspective. In zero-coupon bonds (sometimes called discount bonds), the duration coincides with the maturity date.
Mathematically, the concept of duration is based on the idea that all cash flows expected from an investment in the future are discounted at an appropriate interest rate. Of course, it is wrong to claim that there is one single “appropriate” interest or discount rate, since yield curves are usually not flat. However, for simplicity, we assume a flat yield curve and thus a fixed discount rate. Accordingly, when assessing the interest rate sensitivity of a bond, the change in interest rate results in a parallel up- or down-shift in the yield “curve”. Moreover, the concept assumes reinvestment of coupon payments at the market interest rate. If you are not interested in how Macaulay duration is derived, you may of course skip the next paragraph.
The sum of all discounted future cash flows Ct is called the present value of an investment (V, Equation 1). t denotes the time the cash flow is received. The first derivative of V with respect to the discount rate (Equation 2) is then put into relationship with the present value (Equation 3). The second part of Equation 3 resembles Macaulay duration D (Equation 4).
Source: Author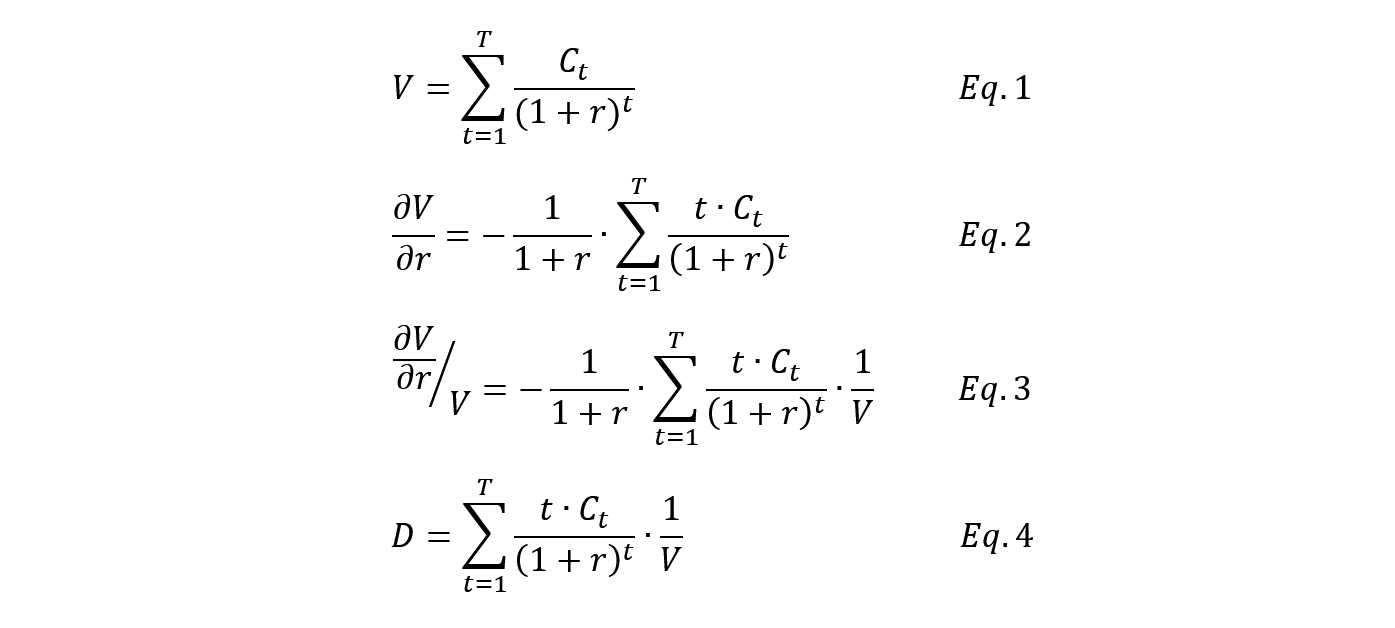
The formula is only valid for relatively small changes in interest rates, but I think it is important to understand the basic relationship between future cash flows and discount rates.
As an aside, multiplying D with 1/(1+r) yields the modified duration, which can be used to calculate the percentage change of a bond’s price if the discount rate (i.e., the market interest rate) changes by 100 basis points. It can therefore be viewed as a measure of the elasticity of the bond price with respect to the market interest rate. Of course, it follows the important inverse relationship of interest rates and bond prices.
The key insight is that a high coupon bond has a lower duration than a low coupon bond, and a zero coupon bond has a duration equal to its maturity. In other words, in a low interest rate environment, the bond with the higher coupon has a shorter duration because the present value of the short-term cash flows is relatively higher.
As an example, Figure 1 shows the interest rate sensitivity of a 20-year bond relative to the coupon rate. All other things being equal, a 20-year bond with a coupon rate of 8% has a duration of 10.6 years at a discount rate of 8%. An investor who is content with an interest rate of 2% for an otherwise identical debt instrument has to bear a significantly higher interest rate risk, as shown by the duration of 14.3 years.
Figure 1: Durations (years) of bonds with a 20-year maturity, coupon rates between 0% and 10% (annual payment), and using discount rates of 4% to 14% (own work)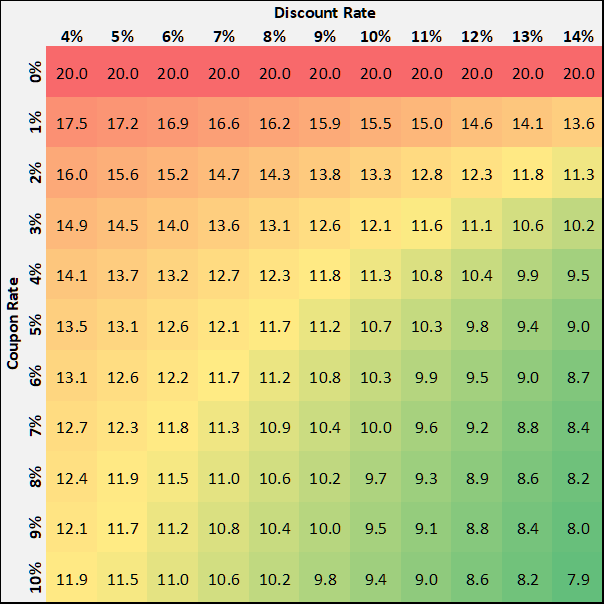
Recent Examples Of Significant Bond Revaluations And The Concept Of Convexity
As mentioned above, modified duration helps to understand the percentage change in the price of a bond as a function of the discount rate. However, because of the assumptions mentioned above, the entire approach is valid only for small changes in interest rates. There is more to consider: convexity, or, why bond (and stock) returns can vary disproportionately with interest rate changes.
The concept of convexity allows us to determine the non-linear relationship between the price of a bond and the change in the discount rate. Mathematically, convexity represents the second derivative of the bond price with respect to the interest rate. Figure 2 shows the convexity of several 20-year bonds with different coupon rates. Obviously, the lower the bond’s coupon rate, the more pronounced the convexity. In other words, the owner of a long-term bond with a low coupon rate suffers much more from rising interest rates than an investor with a high coupon rate bond (all other things being equal).
Figure 2: Convexities of long-term bonds with various coupon rates, assuming annual coupon payments (own work)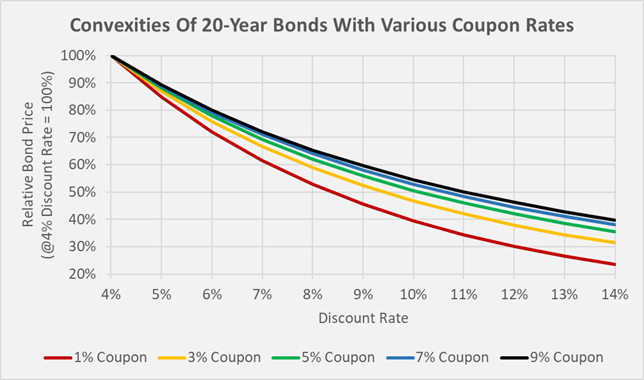
But enough of theory – the Austrian 100-year bond with a coupon of 2.1% serves as a particularly illustrative example (Figure 3). Issued in 2017, the bond was trading at up to 225% of par in November 2020 against a backdrop of zero or in some cases even negative interest rates. However, as interest rates began to rise, the yield on the Austrian bond increased and the value of the bond decreased accordingly. In September 2022, the security traded below 80% of par with a yield to maturity of 2.8%. The holders of this bond (mostly pension funds managing the retirement savings of younger generations) are most likely not satisfied with their returns. “Fortunately”, such bonds are typically not marked to marked but are on the books at par or purchase price.
Figure 3: Historical chart of the 100-year Austrian government bond AT0000A1XML2, which matures in 2117 and has a coupon rate of 2.1%, paid annually (own work, based on the bond’s daily closing price on the Frankfurt stock exchange)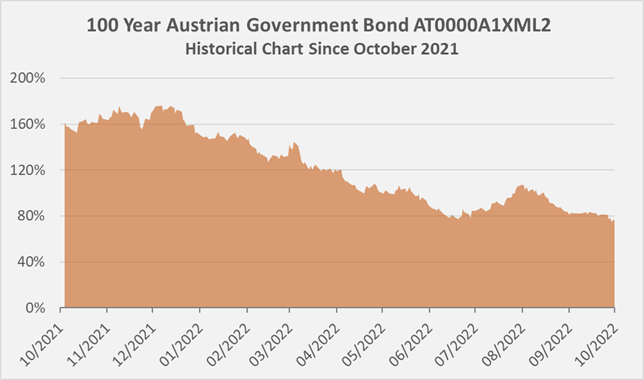
Other examples, certainly less spectacular but similarly illustrative, especially from a U.S. investor’s perspective, include the recent repricing of long-term Treasury bond ETFs such as the Vanguard Long-Term Treasury Index ETF (VGLT), the iShares 20+ Year Treasury Bond ETF (TLT), and the SPDR Portfolio Long Term Treasury ETF (SPTL). Unsurprisingly, they move in lockstep, as the weighted average durations of their holdings are very similar – VGLT 16.8 years, TLT 17.7 years, and SPTL 16.4 years.
Many investors hold such securities as a part of the low-risk portion of their traditional 60/40 stock/bond portfolios. The credit risk of such issues may indeed be close to zero, but the interest rate risk (and of course the foreign exchange rate risk from a non-U.S. investor’s perspective) must be considered. Who would have thought that these investments, often referred to as “risk-free,” could perform so poorly? Clearly, investors need to be wary of interest rate risk – whether in the context of bond or equity investments.
Figure 4: Performance of VGLT, TLT and SPTL, three long-term government bond ETFs; the prices were normalized with respect to the closing prices as of January 2 2022, i.e., 100% (own work, based on VGLT’s, TLT’s and SPTL’s daily closing price)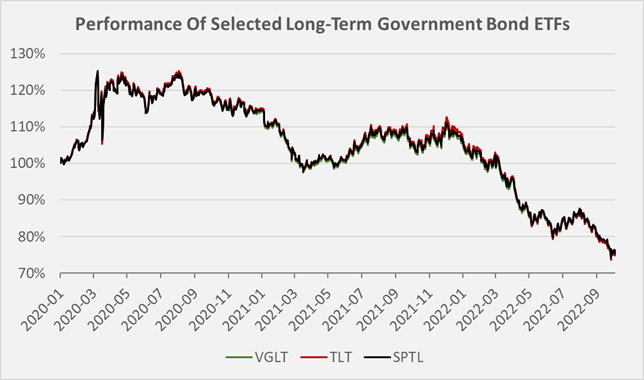
Translating The Concept Of Duration To Stocks – McKesson (MCK) and PayPal (PYPL) As A Case Study
It has been made clear that bonds with low coupons and long maturities have a higher duration and are therefore significantly more sensitive to interest rate changes than high-yield bonds with low maturities – all other things being equal.
At this point, it becomes apparent that dividend-paying stocks, especially those with higher yields, can intuitively be viewed as lower duration investments when compared to non-dividend-paying growth stocks – all else being equal.
Although it is mathematically impossible to directly apply the concept of duration from fixed-income investments to equities (remember that a dividend is never guaranteed), there are several ways to estimate the duration of equities and thus their interest rate sensitivity.
The Price-To-Earnings Ratio – A Clear Sign That PayPal Is A High-Duration Stock
By far the simplest approach is to look at the price-earnings ratio (P/E) and the price-earnings-growth ratio (PEG). Suppose the stocks of two companies are trading with a PEG ratio of 2, but with P/E ratios of 15 and 25. All else being equal, the two companies are expected to grow their earnings by 7.5% and 15% per year, respectively. Not surprisingly, investors in the latter company expect cash flows further into the future. The stock, with a P/E ratio of 25, has a higher duration.
McKesson Corporation, a large U.S. pharmaceuticals distributor, is currently trading at a non-GAAP P/E ratio close to 15. Fintech company PayPal, which operates a highly successful global online payment system, is currently trading at a P/E ratio of 23. Assuming an investor is willing to pay an identical PEG ratio for both stocks, they are expecting PayPal to grow much faster than McKesson, and accordingly, cash flow expectations are skewed toward later years. Comparing McKesson’s PEG ratio to the federal funds rate, we find no particular relationship, as underscored by a correlation coefficient of 0.18 (Figure 5). PayPal, on the other hand, shows a clear inverse correlation with the federal funds rate, as shown in Figure 6 and underlined by a correlation coefficient of -0.59.
Figure 5: Historical forward P/E ratio for McKesson, compared to the federal funds rate (own work, based on the daily closing share price of MCK and the federal funds rate according to forbes.com/advisor/investing/fed-funds-rate-history/)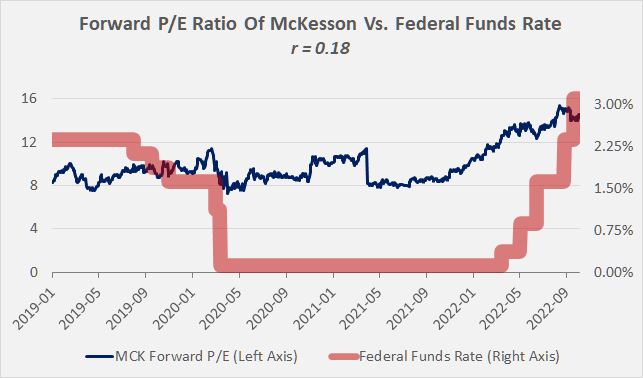
Figure 6: Historical forward P/E ratio for PayPal, compared to the federal funds rate (own work, based on the daily closing share price of PYPL and the federal funds rate according to forbes.com/advisor/investing/fed-funds-rate-history/)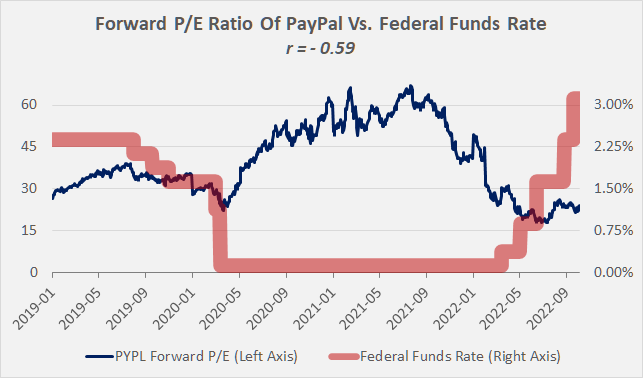
Of course, there are several reasons for PYPL’s multiple expansion since early 2020 and contraction since Q3 2021, such as first rising and then falling growth expectations, a general flight to safety, and less enthusiasm for speculation. However, I argue that Figure 6 clearly shows that interest rate changes have an impact on stocks that are high duration from a P/E perspective. Specifically, with respect to the interest rate rise, the market was very forward-looking, while the sudden rate cuts in March 2020 were impossible to predict.
Taken together, looking at the P/E ratio allows for a quick assessment of the duration of stocks – the higher the P/E ratio, the higher the duration of the stock. The problem is that such an approach can only be used for comparison purposes.
The Dividend Discount Model – The “Bond-Way” To Determine The Duration of McKesson Stock
As the name suggests, the Dividend Discount Model (DDM) only works as a measure of the duration of a stock as long as the underlying company pays a dividend. In short, duration is calculated in the same way as for a bond, taking into account dividend payments instead of interest payments and assuming an infinite holding period.
As is common with growth stocks, PayPal’s management reinvests all free cash flow back into the company. Management believes this allows investors to earn a higher return on their capital. Therefore, this approach is not applicable to PYPL.
McKesson has a long history and its roots go back to 1833. It has become a well-diversified distributor of generic and branded pharmaceuticals, as well as biosimilars and over-the-counter medicines. It is also a provider of medical supplies, care management tools and health information technology. In an oligopoly with AmerisourceBergen (ABC) and Cardinal Health (CAH), McKesson supplies about one-third of all drugs used in the United States. As a result, the company is very well established, benefits from enormous economies of scale, and has a very reliable business model. Cash requirements for capital expenditures have stabilized, and growth prospects are limited. McKesson therefore distributes a portion of the free cash flow the company generates each year to shareholders in the form of dividends.
While dividends are not a promised payment with a legal right like the interest payment of a bond, there are many companies with a very good dividend record. Dividend kings, for example, have increased their dividends for at least fifty years and, accordingly, have never cut their payouts to shareholders. There are even companies that have a dividend history of more than 100 years, such as UGI Corporation (UGI), which paid its first dividend in 1885 (see my detailed analysis).
McKesson’s dividend history, while not as long, is still respectable with 14 consecutive increases. Free cash flow appears to be very robust after normalizing for working capital movements and accounting for stock-based compensation expenses (Figure 7). McKesson’s dividend is extremely well covered by free cash flow and therefore can be considered very safe and unlikely to be cut. The company has grown the dividend at a compound annual growth rate (CAGR) of 9.8% since 2015, but thanks to share repurchases, the payout in dollar terms has remained about the same since fiscal 2019 (ending March 2019). Because of its well-funded dividend and very reliable cash flow, McKesson serves as a good example of how to calculate the duration of a stock using the dividend discount model.
Figure 7: Historical normalized free cash flow and dividend payout of McKesson Corporation (own work, based on the company’s fiscal 2016 to fiscal 2022 10-Ks)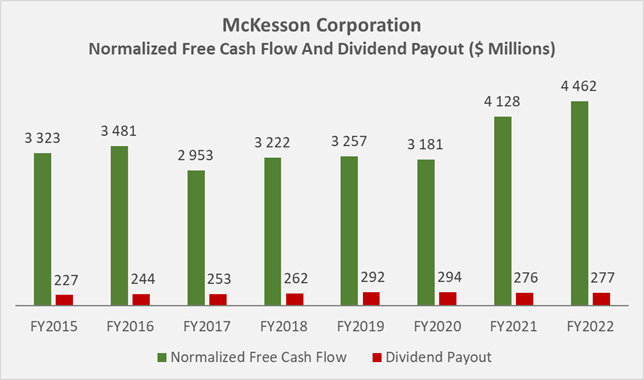
McKesson currently trades at $350 per share and currently pays $2.16 in dividends per share per year, which equates to a dividend yield of 0.62%. Dividing the share price by the annual dividend amount gives 162 years – which is a very rough “approximation” of McKesson’s duration (if that’s what you want to call it), since neither dividends have been appropriately discounted nor has a dividend growth rate been considered. Clearly, we need to come up with something better.
For a more reasonable estimate, consider the following example, which can be easily implemented in a spreadsheet: Suppose McKesson continues to grow its dividend at a CAGR of 9.8% for another ten years, then reduces growth to 5% per year until year 20. From then on, the dividend grows at a rate of only 3% per year. The investor considers a discount rate of 8% to be acceptable. Projecting the growing dividend cash flows into the future and discounting them at 8% yields a payout profile from a present value perspective as in Figure 8.
Summing the discounted cash flows gives an area under the curve (AUC) of $77.5. With the discounted dividend cash flows, we get a duration of 24.7 years. However, if we stop the series after 20 years, we get a duration of only 10.3 years, and that can’t be right. This is, of course, due to the violation of the above assumption – an infinite holding period.
Figure 8: Payout profile of McKesson’s dividend in the future, in terms of present values (own work)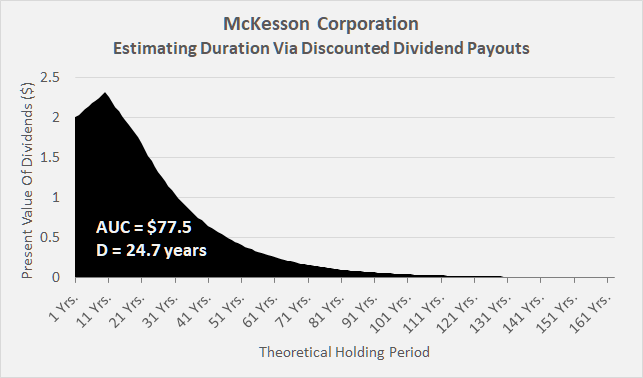
To get a more realistic estimate of duration that is not constrained by this assumption, we need to account for the sale of the stock at the end of the holding period.
To arrive at a reasonable future share price, we now assume that McKesson’s business grows at the same rate as the dividend and the share price adjusts accordingly.
If we take the cumulative sum of all discounted dividend cash flows and add the present value of the stock in the year of the expected sale and stop the series thereafter, we can calculate duration more accurately. Figure 9 compares the durations that result when only the dividend cash flows are considered and when the proceeds from the sale of the stock in a given year are also included. Of course, the longer the holding period, the more pronounced the effect of discounting and the less important the cash flow from the sale of the stock becomes. It is therefore hardly surprising that the result of the two approaches converge.
Assuming a common holding period of 20 to 40 years, it can be seen that the results differ significantly. The dividend discount model underestimates the actual duration (all else being equal) by 45% to 50%. Investors should therefore be careful not to underestimate duration and thus the interest rate sensitivity of their holdings by using an incomplete approach or ignoring its limitations.
Figure 9: Duration of MCK, as obtained via the dividend discount model (own work)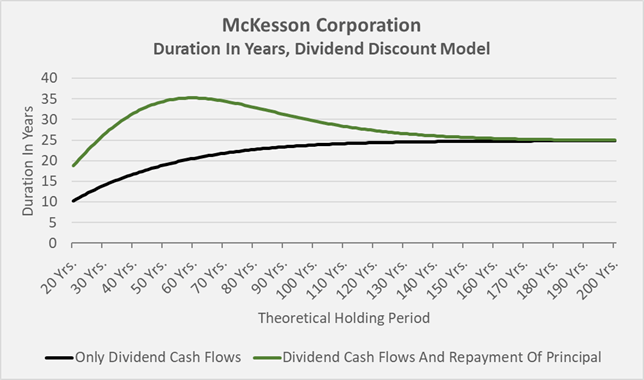
Calculating Duration For Dividend- (McKesson) And Non-Dividend Payers (PayPal)
Ignoring the present value of the stock when estimating duration using the dividend discount model leads to potentially misleading estimates of duration. Taking the present value of the stock into account improves the situation, but the calculation is still confusing and prone to errors because it is based on two views – dividend payments and earnings growth.
The discounted free cash flow model is better not only because it relies on fewer assumptions, but also because it is more broadly applicable and based on a single cash flow to shareholders – free cash flow, which is the total of all excess cash a company earns each year after servicing its debt, paying its capital expenditures, taxes, etc. It is irrelevant whether the cash flows are paid out via buybacks or dividends or reinvested in the company. Accordingly, for non-dividend paying growth stocks like PayPal, only the discounted free cash flow model can be used.
According to PayPal’s 10-Ks, and after normalizing with respect to working capital movements, transaction and credit losses as well as related allowances, and after accounting for stock-based compensation expenses, the company’s free cash flow profile is as follows:
Figure 10: Historical normalized free cash flow of PayPal Holdings Inc. (own work, based on the company’s 2015 to 2021 10-Ks)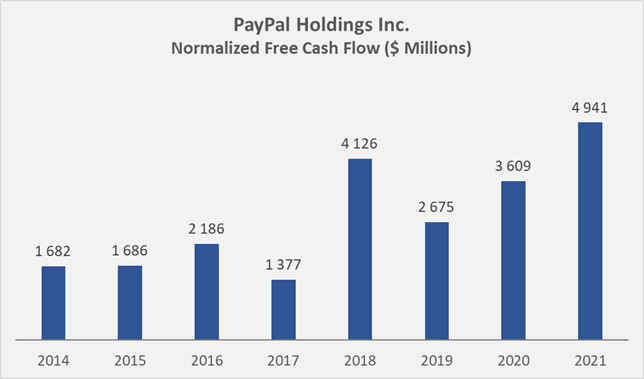
Compared to McKesson, which grew its free cash flow (FCF) at a CAGR of 4.3% since fiscal 2015, PayPal grew much faster at 16.6% over the last eight years. Let’s assume the following growth rates and take the average free cash flow for 2020-2021 (in the case of MCK, for fiscal 2021 and 2022, Figure 7) as the baseline for free cash flow:
- PayPal: baseline FCF of $4.28 billion, growth through year 5 of 16.6%, followed by 10% through year 10 and a terminal growth rate of 3%.
- McKesson: baseline FCF of $4.30 billion, growth through year 10 of 4.3% as it is a much more mature company, and 2% thereafter.
These assumptions result in the durations according to Figure 11, depending on the theoretical holding period. Note that the calculation includes discounted free cash flows for each year and the discounted terminal value at the given holding period.
Figure 11: Duration of MCK and PYPL, as a function of the theoretical holding period (own work)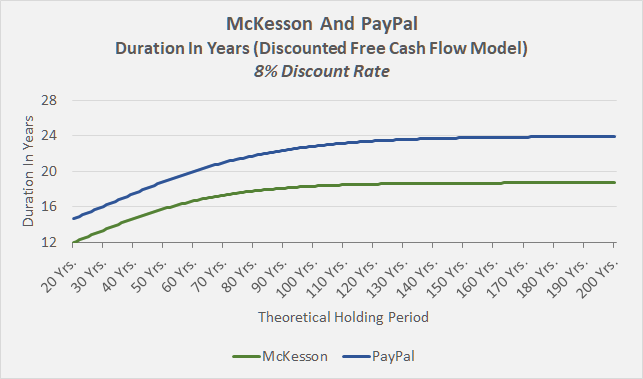
Since PayPal’s free cash flow is assumed to grow much faster than McKesson’s, the duration must understandably be much longer. However, it should be remembered that the data in Figure 11 is based on past growth rates and rough estimates of future growth.
To avoid falling for highly overvalued growth stocks in the future, investors should conduct sensitivity analyses regarding the market’s growth expectations for a company.
A simple formula can be used to determine the current market expectation g for a company’s free cash flow growth rate (Equation 5). Conversely, for a given growth rate, it is similarly easy to calculate the cost of equity currently expected by the market participants.
Source: Author
In equation 5, p denotes the share price, n the number of diluted weighted average shares outstanding, m the minority interest, e the cost of equity (the discount rate) and C the baseline free cash flow. By entering the formula into a spreadsheet, it is easy to estimate the market’s current growth expectations as a function of the share price and the discount rate, i.e., to perform a sensitivity analysis. Of course, by rearranging the formula, sensitivity analysis can also be used to estimate fair share prices for a given cost of equity and terminal growth rate.
Figure 12 shows the result of a sensitivity analysis for McKesson’s free cash flow growth. It is reasonable to assume that, given McKesson’s current stock price of $350, the market would expect a cost of equity (discount rate) of 12% if the current growth rate of 4.3% proves sustainable. In other words, an investor who believes a cost of equity of 8% is sufficient at a $350 stock price would expect the company to report stagnant free cash flow in the future. However, with a 300 basis point increase in interest rates, the company would need to grow its FCF 3% faster to justify the same share price.
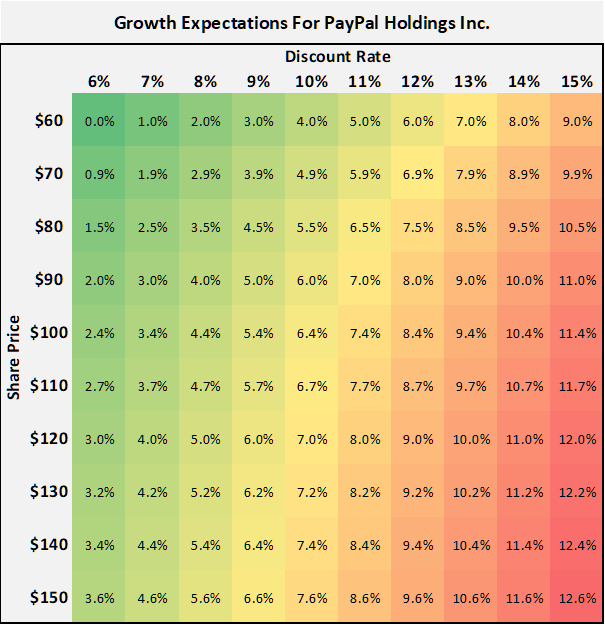
According to the sensitivity analysis in Figure 13, and at a stock price of $90, the market obviously expects PayPal to grow its free cash flow faster than McKesson. It is important to understand that the growth rate in the equation represents a terminal growth rate. Personally, I think a terminal growth rate of 6% is still a bit optimistic for a company with a narrow economic moat according to Morningstar.
Figure 12: Growth expectations for McKesson, as a function of the share price and the discount rate (own work, based on the data found in MCK’s fiscal 2022 10-K) Figure 13: Growth expectations for PayPal, as a function of the share price and the discount rate (own work, based on the data found in PYPL’s 2021 10-K)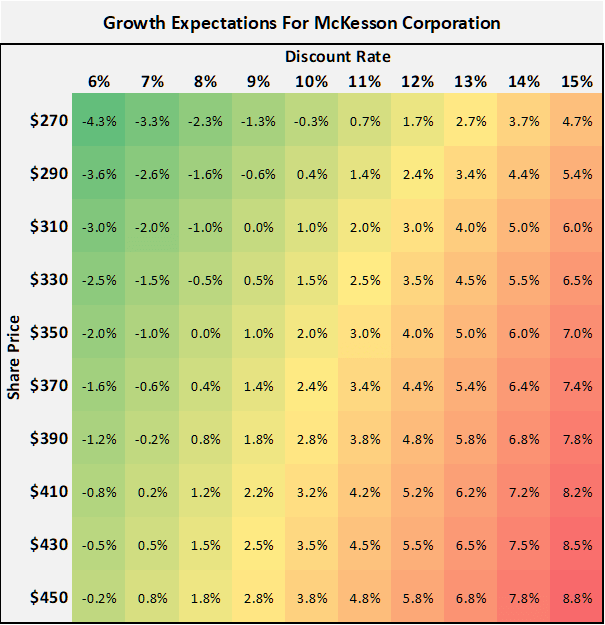
Other Potential Implications Of Duration On The Valuation Of Stocks
Apart from the issues discussed so far, duration should also be considered in the context of acquisitions. Two examples come to mind.
V.F. Corporation (VFC), the company behind well-known fashion and outdoor brands Timberland, Vans, The North Face, and Dickies, acquired Supreme, a relatively young fashion label, in 2020. The $2.1 billion price tag represents a price-to-sales multiple of 3.7, which can be considered a high valuation in this sector. Obviously, management’s expectations for Supreme’s growth were high – the Supreme transaction had a high duration. Partly as a result of the recent rise in interest rates, the company has to take a goodwill impairment charge of $300 million to $400 million in the second quarter of the fiscal year 2023. This, of course, has impacted VFC’s valuation. For those interested, I recently analyzed VFC’s exhaustive 172-slide Investor Day presentation.
The second recent example is Adobe’s (ADBE) planned acquisition of Figma for $20 billion, which represents a price-to-sales multiple of 50 – more than six times ADBE’s current valuation. I have recently discussed this matter in detail. In essence, it does not seem unreasonable for ADBE to take an impairment charge in the future if the transaction closes and growth does not materialize. At 50x revenues, the growth expectations seem unimaginably high. Moreover, Adobe’s balance sheet is already loaded with goodwill (48.6% of total assets at the end of Q2, p. 3, 2022 second quarter 10-Q).
Key Takeaways
- Government bonds, especially those with long maturities, carry a significant interest rate risk.
- Interest rates and bond prices (as well as share prices) are usually inversely correlated.
- Duration is a simple measure of a bond’s sensitivity to changes in interest rates.
- The concept is only valid for small changes in interest rates, and the relationship between a bond’s price and the change in the discount rate is not linear (convexity).
- However, with a few simple formulas and a spreadsheet program, bond convexity can be characterized and excessively risky bond investments can be identified.
- The concept of duration is as relevant for bonds as it is for stocks.
- Dividend stocks and/or stocks with high current cash flow, such as McKesson Corporation are less sensitive to interest rates than growth stocks like PayPal.
- A comparison of P/E ratios helps to distinguish between low duration stocks (low P/E) and high duration stocks (high P/E).
- The dividend discount model can be used to evaluate the duration of dividend stocks, but the repayment of principal, similar to a bond, must be taken into account if the time series is terminated early.
- Taking a step back and focusing on free cash flow allows for a much clearer and less constrained assessment of duration.
- Sensitivity analyses are easy to perform in a spreadsheet program and allow for an unbiased view of the market’s current expectations for a company’s free cash flow growth. That way, growth traps can be avoided.
- Duration should also be considered in the context of acquisitions – acquisitions at high multiples carry the risk of goodwill impairment, as a recent example shows.
Thank you very much for taking the time to read my article. In case of any questions or comments, I am very happy to hear from you in the comments section below.
Be the first to comment