

Alena Butor/iStock via Getty Images
Investment Thesis
This article evaluates the Distillate U.S. Fundamental Stability & Value ETF (NYSEARCA:DSTL), a fundamentals-focused fund with a 0.39% expense ratio and assets under management approaching $1 billion. The team at Distillate Funds assesses the quality of stocks differently than traditional approaches, thereby justifying the relatively high fees. However, my comprehensive analysis of fundamental metrics indicates the method won’t add much alpha over what cheaper, passive ETFs already offer. One example is the Schwab Fundamental U.S. Large Company ETF (FNDX), which has virtually identical volatility, valuation, growth, and profitability metrics. Since FNDX’s expense ratio is just 0.25%, I recommend investors go with that cheaper option, and I look forward to describing why in more detail next.
ETF Overview
Strategy Discussion
DSTL tracks the U.S. Distillate Fundamental Stability & Value Index, a custom-built Index selecting 100 large-cap U.S. stocks according to proprietary screens. Distillate Capital describes the objectives as follows:
The Index seeks to include the most fundamentally stable and most undervalued stocks from a starting universe of around 500 of the largest U.S. companies. The selection criteria for the Index are based on Distillate Capital’s proprietary fundamental measures that attempt to correct the shortcomings of traditional metrics for judging the quality and value of stocks.
To be considered for selection, companies must:
- be among the top 500 U.S.-listed companies based on free-float market cap
- have at least five years of cash flow per share data
- have a reported net profit in at least one of the last three fiscal years
- are headquartered in the United States or Ireland
- have an average trading value of USD $50 million in the previous 90 days
- have a 12-month free cash flow estimate available from FactSet Research
Though the strategy is proprietary, the prospectus adds color to the model’s three screens.
Distillate Capital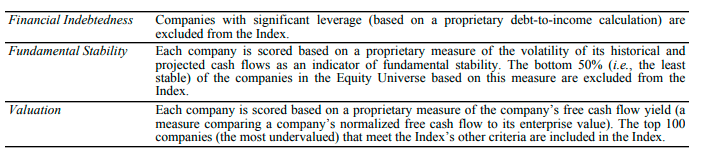
DSTL aims to hold companies with stable or growing free cash flow with manageable levels of debt trading at a fair price. The unknowns are the sensitivity of the leverage screen and if stable free cash flows are desirable. However, since valuation is how constituents are selected, that will be key to assessing the ETF.
The Index uses a hybrid weighting method that’s two-thirds equal-weight and one-third based on total normalized cash flow. This method provides a slight bias toward larger companies since they likely produce the largest cash flows. Finally, the Index reconstitutes quarterly after the close of trading on the third business day each January, April, July, and October, using data from the last business day of the preceding month. While I appreciate the use of forward-looking metrics, it always fascinates me when indexes seeking cheaply-valued securities reconstitute so frequently. Successful value investors are incredibly patient, and although I understand the desire for flexibility, the approach runs counter to how I view value investing. DSTL’s last annual portfolio turnover rate was 73%, so a lot of rotation is happening that may only sometimes be beneficial to shareholders.
Sector Exposures and Top Ten Holdings
DSTL may follow a proprietary strategy, but it wasn’t difficult to identify a cheaper and more passive ETF with almost identical fundamentals across the board: the Schwab Fundamental U.S. Large Company ETF. I’ve highlighted its sector exposures alongside DSTL and the SPDR S&P 500 ETF (SPY) below. DSTL is the less-diversified fund, with 26.52% and 20.39% exposure to Technology and Health Care sectors.
Morningstar
Since one of DSTL’s key screens is leverage, sectors like Utilities have little chance. Therefore, if considering DSTL as a core holding in your portfolio, you can complement it with a sector ETF like the Vanguard Utilities ETF (VPU). The volatility screen likely works against the Energy sector despite current substantial free cash flow numbers. It relates to what I discussed earlier about whether stable free cash flows were desirable. In prior years, Energy companies’ numbers were down due to low oil prices, but a prudent investor wouldn’t hold that against them indefinitely. Indeed, Energy stocks have proven to be excellent inflation hedges this year, and ETFs like COWZ that screen based on current free cash flow numbers have significantly higher exposure to this sector.
DSTL’s top ten holdings are below, including Alphabet (GOOGL), Johnson & Johnson (JNJ), and UnitedHealth Group (UNH). These large companies are consistent with the advantage described earlier on total normalized free cash flow. However, they only account for 21.60% of the portfolio. The ETF looks well-diversified at the holdings level but less at the sector level.
Distillate Capital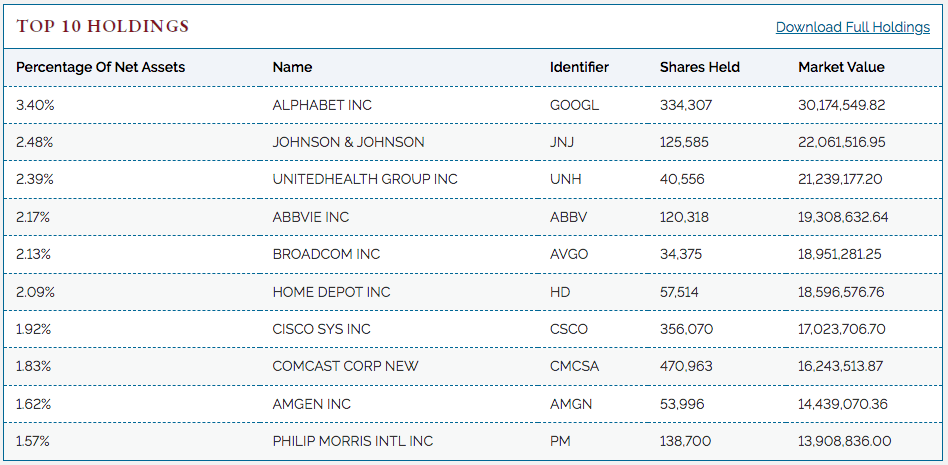
Performance Analysis
DSTL launched in October 2018, delivering a 13.96% annualized return compared to 11.42% and 10.63% for FNDX and SPY. These results, especially considering its similar volatility, indicate that the Index’s unique strategy can work in both bull and bear markets.
Portfolio Visualizer
However, the strong outperformance was primarily linked to 2020, when DSTL outperformed FNDX by 10.17%. In 2021 and 2022, DSTL lagged by 2.86% and 3.12%. Given how 2020’s market movements are unlikely to repeat and that DSTL typically has a high turnover rate, investors should not rely much on this short track record.
Portfolio Visualizer
ETF Analysis
Industry Fundamentals
Morningstar classifies DSTL and FNDX into different categories. However, they are incredibly similar funds based on their characteristics. To illustrate, here is a summary of DSTL’s fundamentals for its top 25 industries.
The Sunday Investor
DSTL and FNDX have five-year betas of 1.05 and 1.02, placing them close to SPY. This metric indicates that all three ETFs will have similar volatility. DSTL and FNDX also have near-identical estimated sales growth (10.06% vs. 9.57%) and earnings growth (12.87% vs. 12.52%). However, there is a large gap between historical and estimated sales growth. Notice how several industries, like Biotechnology and Semiconductor Equipment, have substantial expected slowdowns. It could be a case of relying too much on past results and not acknowledging changing market conditions. This might explain why DSTL underperformed FNDX in 2021 and 2022.
Turning to valuation, DSTL trades at 15.39x forward earnings, or 1.28x less than FNDX. Both ETFs trade at about 15x trailing cash flows, much cheaper than SPY. Not shown above, but FNDX is slightly less expensive on a price-sales basis (2.89x vs. 3.01x). I favor forward-looking metrics, so DSTL is more attractive on valuation. Still, it’s a close call. The test was if DSTL’s proprietary methodology resulted in a portfolio that other cheaper passive ETFs couldn’t, and that’s not the case.
EPS Revision Score
The last metric I’d like to discuss is the EPS Revision Score, where FNDX holds a slight advantage (5.65/10 vs. 5.47/10). The rating, which I’ve normalized on a ten-point scale using Seeking Alpha’s Factor Grades for each company, is beneficial when assessing market sentiment. It’s objective and based on Wall Street analyst EPS revisions across numerous periods. For reference, SPY began the year at 6.21/10 and has declined to 5.23/10. Meanwhile, fundamentals-based portfolios have held more firm, consistent with this year’s outperformance. I’ve highlighted this score for each of DSTL’s top 25 holdings in the table below, alongside other helpful sales and earnings surprise figures from last quarter.
The Sunday Investor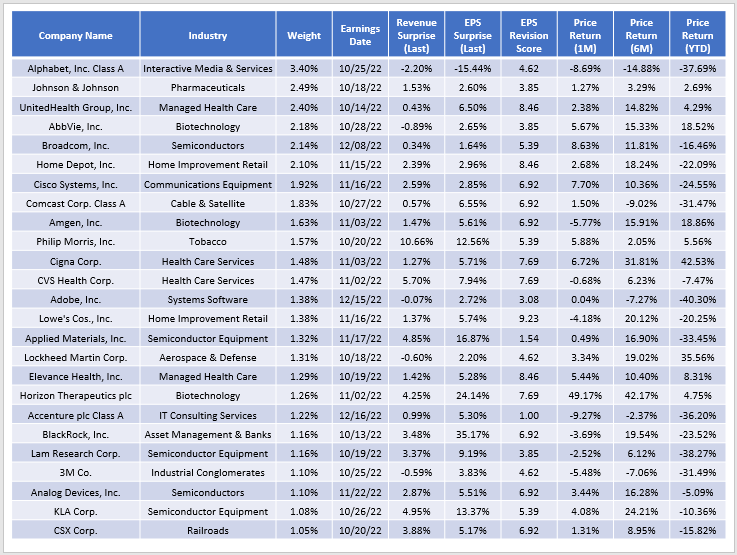
This table reveals that DSTL’s constituents had very few double-digit earnings surprises last quarter, an essential catalyst for short-term price momentum. Alphabet, the fund’s largest holding by far, missed 2.20% and 15.44% on sales and earnings. That’s three consecutive earnings misses and why shares are down across all three periods listed (one month, six months, and YTD).
Seeking Alpha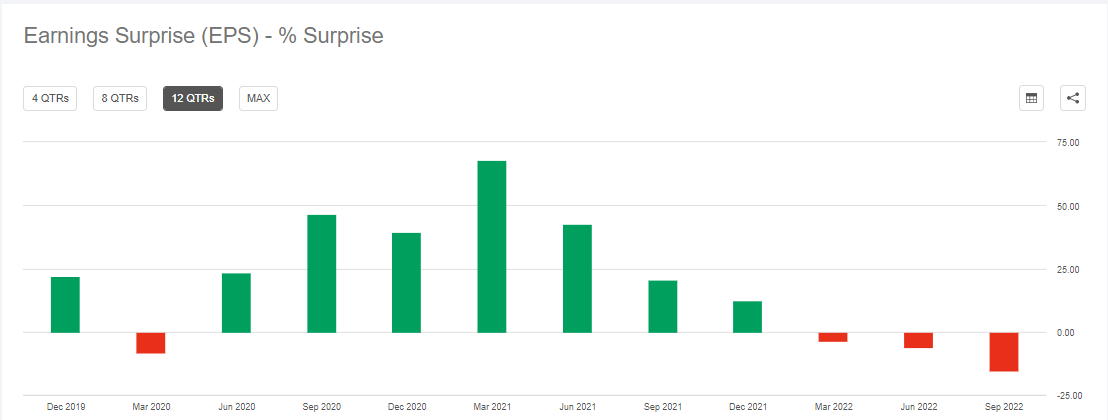
Adobe (ADBE) is another company with a poor EPS Revision Score. Earnings surprises are still positive, but they’re relatively small compared to what the company achieved in 2020 and 2021.
Seeking Alpha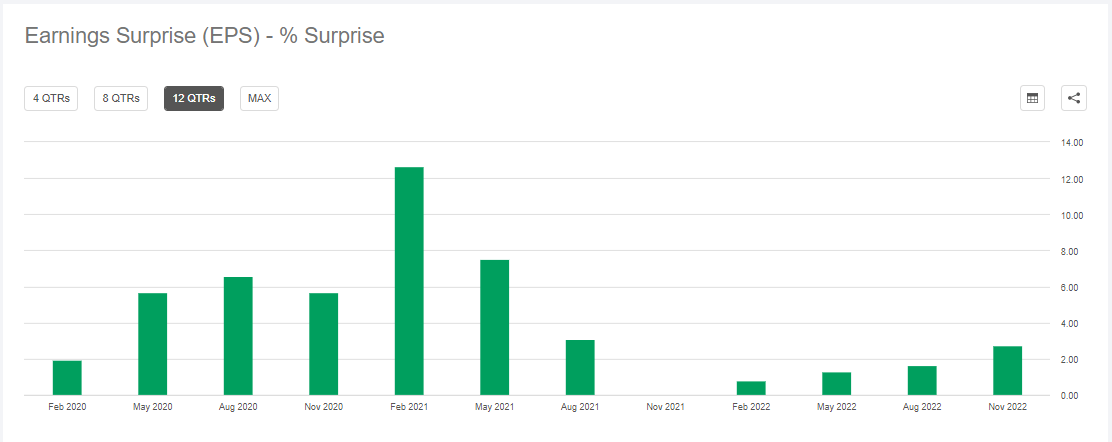
The long-term average quarterly earnings surprise is about 5-7% for S&P 500 companies. With last quarter’s 3.40% aggregate earnings surprise, it’s hard to imagine a significant bull run in the near term, so fundamentals-based ETFs like DSTL and FNDX should continue to do relatively well. However, in case of a turnaround, FNDX’s better EPS Revision Score indicates it will outperform.
Investment Recommendation
DSTL, at least based on its current holdings, scores well on numerous metrics that should be valuable in this current market. It has nearly 13% estimated earnings growth, trades at about 15x forward earnings and trailing cash flow, and is only slightly more volatile than SPY. DSTL’s disadvantages are that it’s not very well diversified at the sector and industry level, potentially disqualifying it as a core holding replacement for SPY. In addition, its constituents have slightly weaker earnings revisions than FNDX, which may lead to underperformance in a market rebound.
I like how both ETFs are designed, and they’re both solid. However, I am limiting my rating to neutral because DSTL fails to stand out and has a higher expense ratio. I look forward to assessing DSTL each time it reconstitutes for potential buying opportunities, but in the meantime, I’m happy to answer any questions in the comments section below.
Be the first to comment