

Alex Wong/Getty Images News
Here is the fact: the Fed had 13 monetary tightening cycles since 1945, and 10 of them resulted in a recession (see the chart below). “Soft-landing” exceptions: 1965-66, 1983-84, and 1994-95.
The Fed has just started another monetary tightening cycle, which is expected to increase the Federal Funds rate from the near 0% level to about the 2.5-3% level. The stock market bulls are hoping that the Fed will be able to engineer another “soft-landing” like in 1994/95. A “soft landing” is the monetary tightening cycle that does not cause a recession (and the bear market in stocks).
Unfortunately, it is very likely that the current monetary tightening cycle will cause a recession (hard landing) and consequently a bear market in stocks (NYSEARCA:SPY), which in-fact has been unfolding since January of 2022.
The 1995 soft-landing
Here is the chart that shows the historical monetary policy tightening cycles (increase in Federal Funds rate), where the shaded bars represent the recessions. If you zoom in to the 1993-95 period, you can see that the Fed had been increasing interest rates during this period, but it did not cause a recession – the “1995 soft landing”.
FRED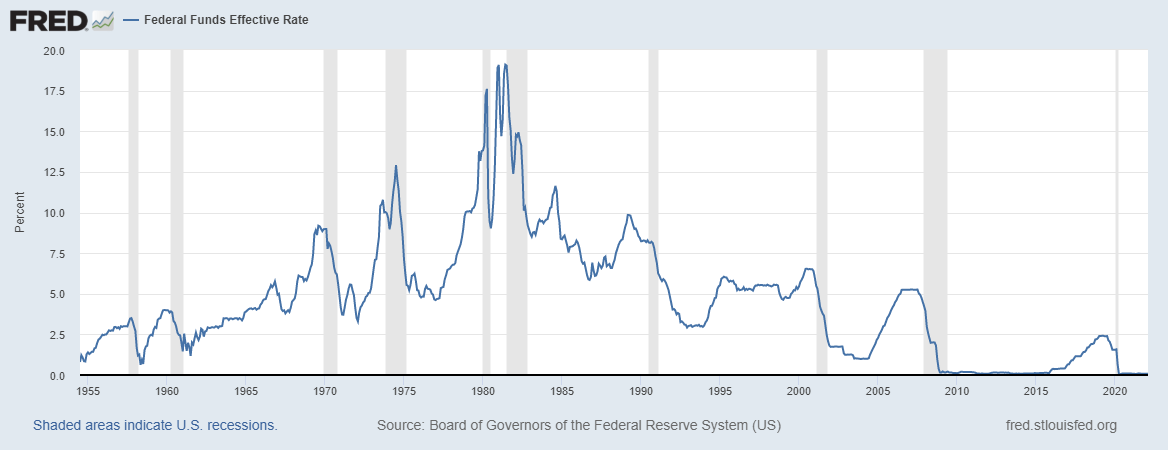
Here is the Fed’s statement from the January 1995 meeting:
The Federal Reserve Board today approved an increase in the discount rate from 4 3/4 percent to 5 1/4 percent, effective immediately.
In a related move, the Federal Open Market Committee agreed that this increase should be reflected fully in interest rates in the reserve markets.
Despite tentative signs of some moderation in growth, economic activity has continued to advance at a substantial pace, while resource utilization has risen further. In these circumstances, the Federal Reserve views these actions as necessary to keep inflation contained, and thereby foster sustainable economic growth.
The most important keyword in this Fed’s statement is the “resource utilization”. During the pre-globalization and the early globalization period of 1970s and 1980s, inflation was driven by the capacity utilization rate, among other variables.
If you look at the chart below, the US economy operated at near 90% capacity utilization in 1970s, which was one of the key variables that led to the inflationary spikes. After the 1981 recession, the capacity utilization fell to 70% and never exceeded 85% afterwards as the globalization policies took hold. This significantly reduced the inflation expectations and allowed the Fed to increase interest rates in the early 80s and the early 90s without causing a recession.
In fact, in 1993, the capacity utilization started to increase from about 80% to 85%, which apparently alerted the Fed to increase interest rates to contain the inflation expectations. Yet, during the entire period, from 1993 to 1995, the CPI inflation was subdued and stayed within the narrow range of 2.5-3%. Thus, the Fed was pro-actively increasing interest rates responding to the rising capacity utilization – while the actual inflation was never a problem.
Note, the capacity utilization never exceeded 85% afterwards, and continued to decease towards the 80% level in the second part of the 1990s, which allowed the Fed to slightly decrease the interest rates after the monetary tightening cycle – and set the stock market on fire.
Globalization is disinflationary. The globalization policies allowed the US to gradually outsource the production, which reduced the inflationary pressures related to all resource limitations – labor and factory.
FRED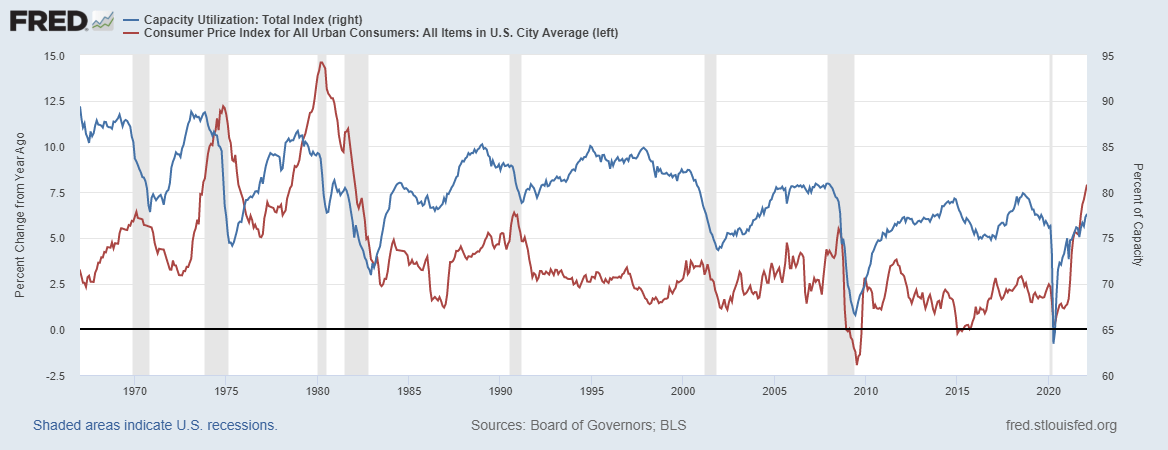
The 2022 Inflation Spike
Fast forward to 2022, and you see the completely different situation. Inflationary is very high with the current spike up to 7.9% yoy CPI, and capacity utilization very low at 77%. This is nothing like the 1994-95 situation. Inflation is now a major problem, and it’s not due to factory capacity utilization – however, it is partially due to the low labor resources capacity given the 3.8% unemployment rate.
In-fact, inflation is currently spiking due to the extraordinary pandemic-related monetary stimulus, and pandemic-related supply disruptions, both of which proved to be non-transitory. Thus, the Fed has no option other than to significantly reduce the demand, which includes deflating the asset prices as a major source of demand due to the wealth effect. This is a hard landing scenario – recession and the bear market.
But more importantly, the long-term inflation expectations are also rising due to the unfolding trend of de-globalization, which has been accelerated with the Russian invasion of Ukraine. De-globalization is stagflationary – high inflation with low growth. The Fed is only able to counter supply-side inflationary pressures arising from de-globalization by further reducing the demand. Longer term this could result in a series of inflationary recessions like in 1970s.
The unfolding bear market
The S&P 500 had the first leg of the bear market with the 10% correction in January 2022, which was caused primarily by the rising long term interest rates in expectation of ending of the Fed’s QE program. However, at the time, the market expected only a gradual tightening (4 interest rate hikes in 2022). Further, the yield curve spread was above 0.70%, suggesting a very low probability of a recession. Thus, I viewed the 10% correction as a tactical buying opportunity.
However, the yield curve spread significantly narrowed to 0.4% with the geopolitical escalation as Russia invaded Ukraine, which increased the recession probability and caused a deeper 13% correction in S&P 500. Given the absence of the inverted yield curve, I downgraded my view to hold on Feb 14th, advising against buying stocks due to longer term stagflationary pressures arising from de-globalization, but stopping short of recommending a sell.
However, over the last month since my downgrade, the parts of the yield curve inverted (10y-5y), which now signals an upcoming recession. The widely followed spread between 10Y and 2Y Treasury Bonds narrowed to 0.20%, which does not support an imminent recession by historical standards yet. However, the speed at which the yield curve has been narrowing over the last 3 months is alarming, and the likelihood of the near-term inversion is high. Furthermore, given that the stock market is possibly already in a bear market, this might be one of the very rare situations where I would actually recommend to sell S&P 500. This time there might not be the usually 9-12 month time lag between the initially inverted yield curve and the beginning of the bear market, the current sell-off could only accelerate.
Tactical considerations
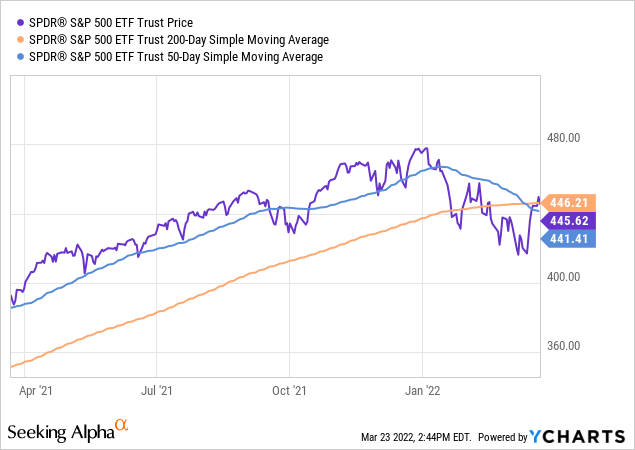
Here is the SPY chart. Technically, SPY is in a downtrend since Jan 3rd, 2022. Furthermore, there is a “death cross”, where 50dma crosses 200dma. Currently, SPY is likely in a bear market rally – which could extend. Given that fundamentals and technicals are both bearish, many will attempt to short, which opens the possibility of a very sharp short-covering rallies. However, these rallies will be the opportunities to exit the long SPY positions.
Risks – bullish thesis
What could change the bearish outlook on S&P 500? Simply – rebirth of globalization. The US would have to lift all trade tariffs on China, and China would have to rein-in Russia. This would reduce the stagflationary pressures and re-introduce the 1990s’ goldilocks of high growth with low inflation.
Why is SPY vulnerable?
The S&P 500 index ETF is considered as the proxy for the market portfolio, and it’s widely used as the performance benchmark for active funds, as well as the preferred investment vehicle for the passive index investors.
Thus, there have been large inflows of passive investment funds into SPY, which possibly inflated the largest and the most speculative stocks within the index, such as Tesla (TSLA) which represents over 20% of the consumer discretionary sector (XLY). In fact, Michael Burry warned in 2019 of the possible passive investing bubble. Consequently, as the bear market sell-off accelerates, SPY will be vulnerable to a deep NASDAQ-like sell-off, unlike for example in 2000-2003 when S&P 500 was more insulated from the deep selloff.
Conclusion
The Fed is not going to be able to engineer the soft-landing like in 1995. The Fed was proactively lifting interest rates from 1994 to 1995, in response to increasing resource utilization. During the entire period, inflation stayed within a narrow range 2.5-3%.
Currently, we have a significant 7.9% spike in inflation – and the Fed a way behind, with interest rates just lifted from the 0% level. Thus, the Fed will have to increase the interest rates very aggressively, which will very likely to produce a hard landing – recession and the bear market in stocks. The SPY ETF is vulnerable to a deep sell off due to the passive investing bubble, which inflated large and speculative tech stocks, heavily weighted in the S&P 500 index.
Be the first to comment