

The article was published to members of my service on June 12th, 2022.
Abu Hanifah/iStock via Getty Images
Lately, we have been quite concerned with duration. Believe it or not, there aren’t that many exchange-traded fixed income products that provide low duration. Out of 756 fixed income products, we monitor only around 60 that have maturity dates shorter than 10 years. The pick that got our attention recently is the Eagle Point Credit Company Inc – 5.375% NT REDEEM 31/01/2029 USD 25 baby bond (ECCV) that matures in a little less than 7 years:
ECCV is the largest issue in the ECC family and…
ECC Fixed Income Products (Proprietary Software)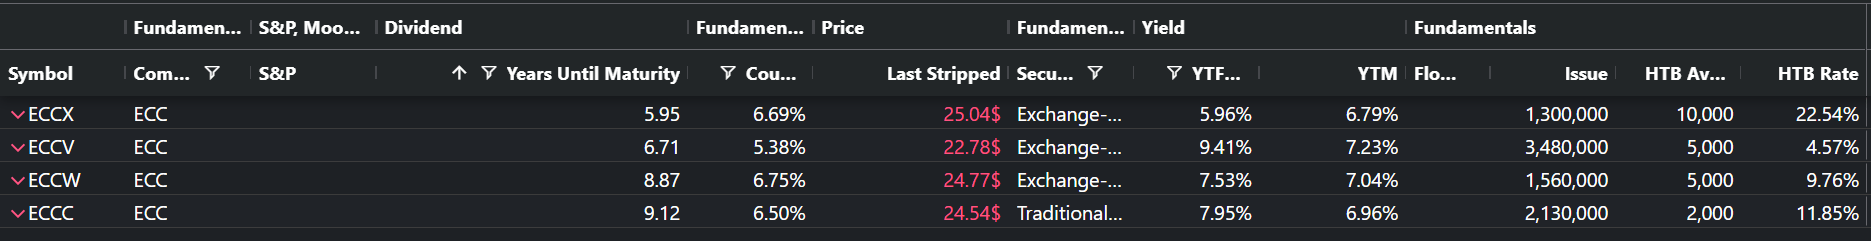
has been issued at the lowest-ever nominal coupon for the company. At a current price of around $23, it has a yield to maturity of around 7.2% (XIRR calculated). This is in line with the other 2 baby bonds from the company, (ECCX) and (ECCW), but what makes ECCV superior is that is that it has a chance of capital appreciation in case ECC is able to finance at lower yields. Both ECCX and ECCW are trading very close to Par and are already callable anytime. So on the downside, the 3 securities face the same duration risk while on the upside ECCV is superior. This is the only reason ECCV is the hero of the article and here are our 4 main reasons for the reader to consider it.
Reason number 1: Low duration
The majority of fixed income products that trade on the exchange are either perpetual or have maturity dates of more than 30 years. In the following picture, one can see what duration really means:
7yr Bond compared to a perpetual (author’s calculations)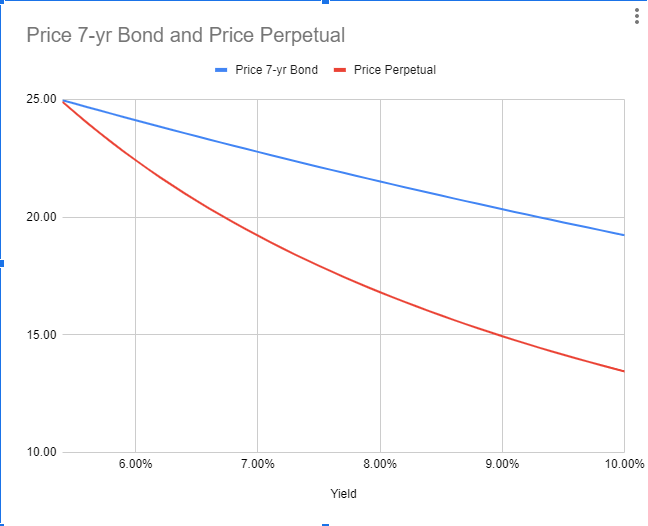
The price of the shorter-term bond is way less volatile. But this is not just theory. Fixed income is probably one of the very few places where practice eventually meets theory. ECCV was issued on 1/12/2022, at the same time as (BIPI) and just a week after PSA-S. We all know that there has been a massive shift in the yield curve:
ECCV price now vs PSA-S and BIPI (Proprietary Software)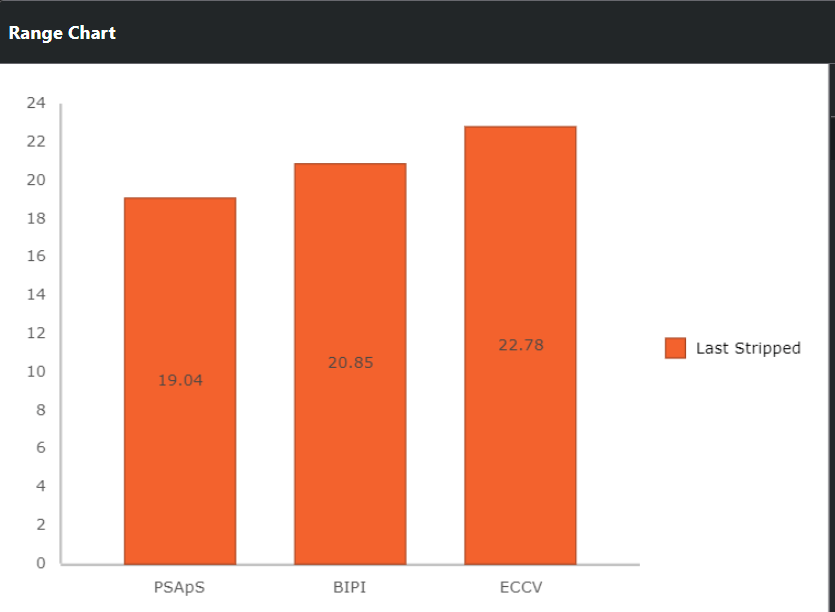
As you can see, ECCV has fallen way less in price while it has shifted even more in yield. PSA-S was issued at 4.10% and now has a current yield of 5.34%, BIPI has gone from 5.10% to 6.10% while ECCV has shifted almost 1.9%. Not only it is safer in terms of interest rate risk but it has already shifted more than the stocks issued at similar dates. In terms of interest rate risk, ECCV is way superior compared to the average preferred stock just or exchange-traded debt because of its short duration. If an investor is concerned with interest rate risk he is most likely to switch to shorter-duration instruments.
Reason 2: Low credit risk based on leverage restriction
Being a Closed-End Fund (“CEF”), ECC has to limit its leverage. Here is a quote from the prospectus of ECCV:
“We are required under current law to have an asset coverage of at least 300%, as measured at the time of borrowing and calculated as the ratio of our total assets (less all liabilities and indebtedness not represented by senior securities) over the aggregate amount of our outstanding senior securities representing indebtedness. With respect to senior securities that are stocks (i.e., shares of our Preferred Stock), we are required under current law to have an asset coverage of at least 200%, as measured at the time of the issuance of any such shares of preferred stock and calculated as the ratio of our total assets (less all liabilities and indebtedness not represented by senior securities) over the aggregate amount of our outstanding senior securities representing indebtedness plus the aggregate liquidation preference of any outstanding shares of preferred stock.”
And here is another one:
“Over the long term, management expects us to operate under normal market conditions generally with leverage within a range of 25% to 35% of total assets.”
When evaluating credit quality, the most important factor is the amount of leverage a company is expected to use. All rating agencies have similar methodologies when it comes to CEF debt or preferred stocks and all CEFs receive extremely high credit ratings. The case with CLO equity funds is a little bit different based on the credit quality of the underlying portfolio and its liquidity. The indicator we have been using to sleep calmly at night is the ratio of the market capitalization of the fund in comparison to the indebtedness, assuming that the market will give us a fair value estimate of the value of the underlying portfolio.
So, instead of looking at reported data that comes rare, we are monitoring the price behavior of ECC on a daily basis to be certain we will act on some sharp decline in the market value of the fund. I will allow using the only available rating of ECCV which is from Egan Jones. They give the bond a rating of BBB+. Usually, it is a bad sign when you use them as a predictor of credit quality, but if you add to this the simple rule to monitor the market cap of the CEF in comparison to the overall leverage, we are in a very decent situation:
ECC capital structure (Cefconnect)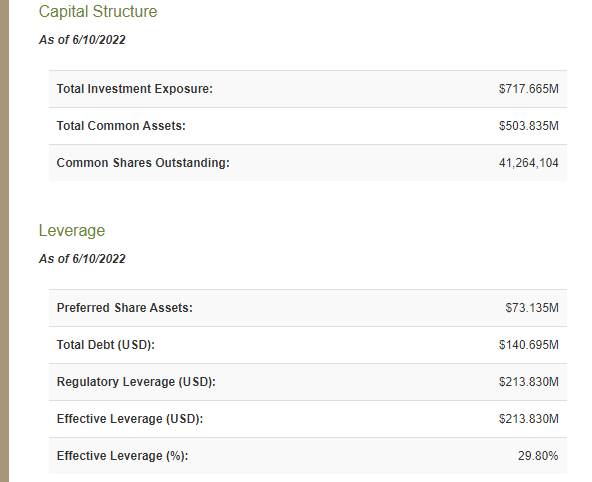
Around 700 mln of assets cover around 140mln of debt and 70mln of preferred stock. The investor in ECC debt has to understand that even if there is some downside risk to the underlying portfolio, as long as it is not some panic market shock, the fund will most likely be forced to dilute further to meet its leverage criteria. The management team is probably most concerned with generating their management fees so whatever happens in the CLO space they will try to keep the fund running.
To some extent as long as there is a public interest for someone to create for them a CLO equity portfolio ECC will be able to issue new shares and stay under the 1940 act leverage limits. ECC received a big test in the middle of the Covid-19 panic of 2020, and it managed to maintain its leverage ratios. Hopefully, there is nothing worse than what happened in 2020 ahead of us, because in this case no instrument that trades on the exchange can be considered safe. Here is how Eagle Point Capital 6.6875% Notes (ECCX), as an example, compared to iShares Preferred and Income Securities ETF (PFF) over the last several years:
ECCX vs PFF (Proprietary Software)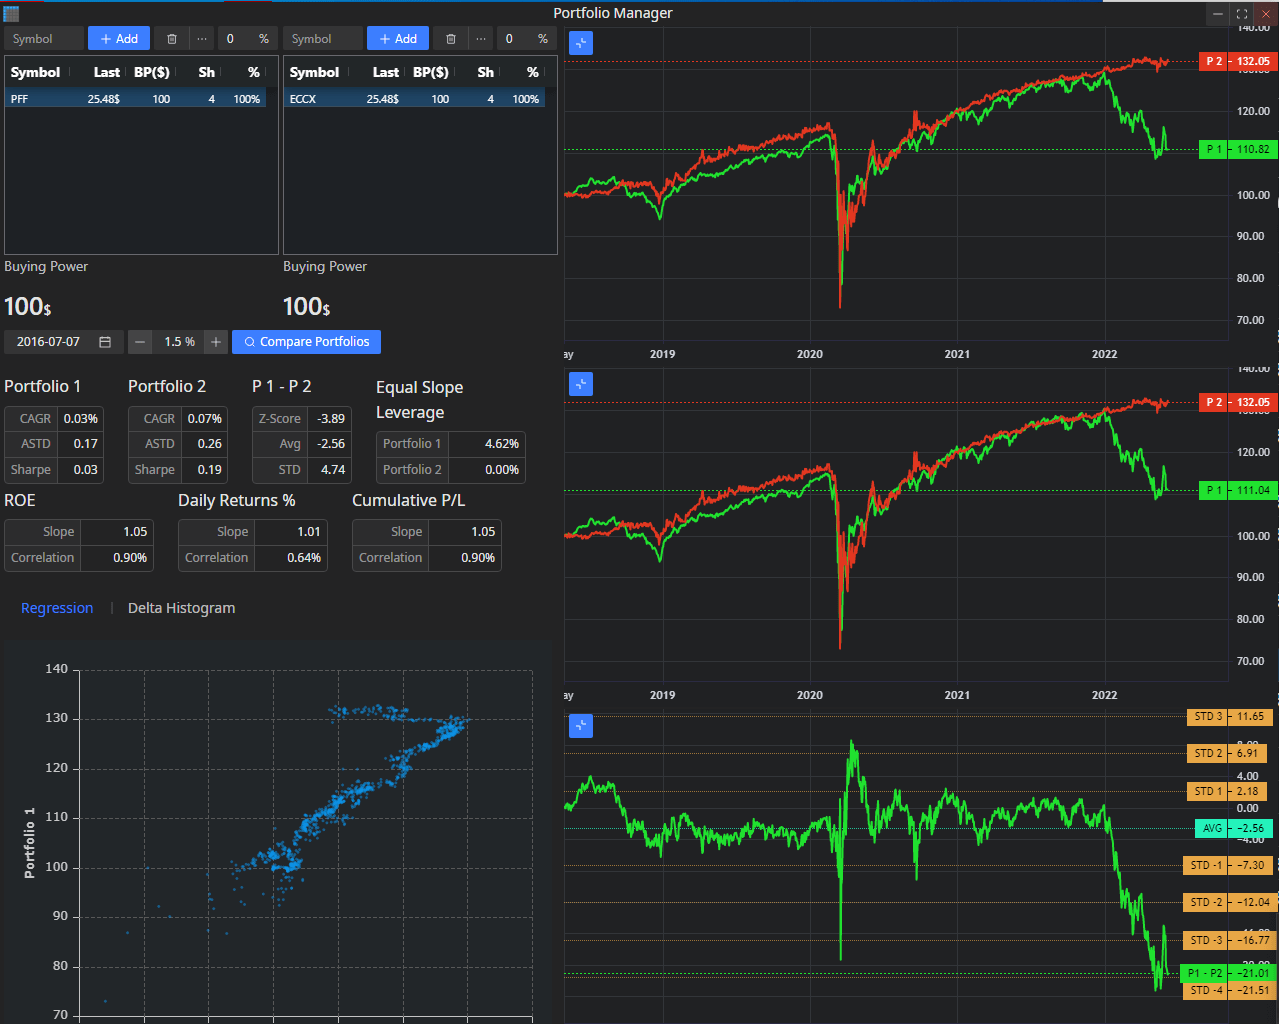
As long as it was not some crazy underperformer to the highly diversified PFF, we can say that ECC debt has been battle-tested.
Reason 3: ECCV brings way less risk than ECC itself
Let’s start with a simple chart:
ECCX vs ECC (Proprietary Software)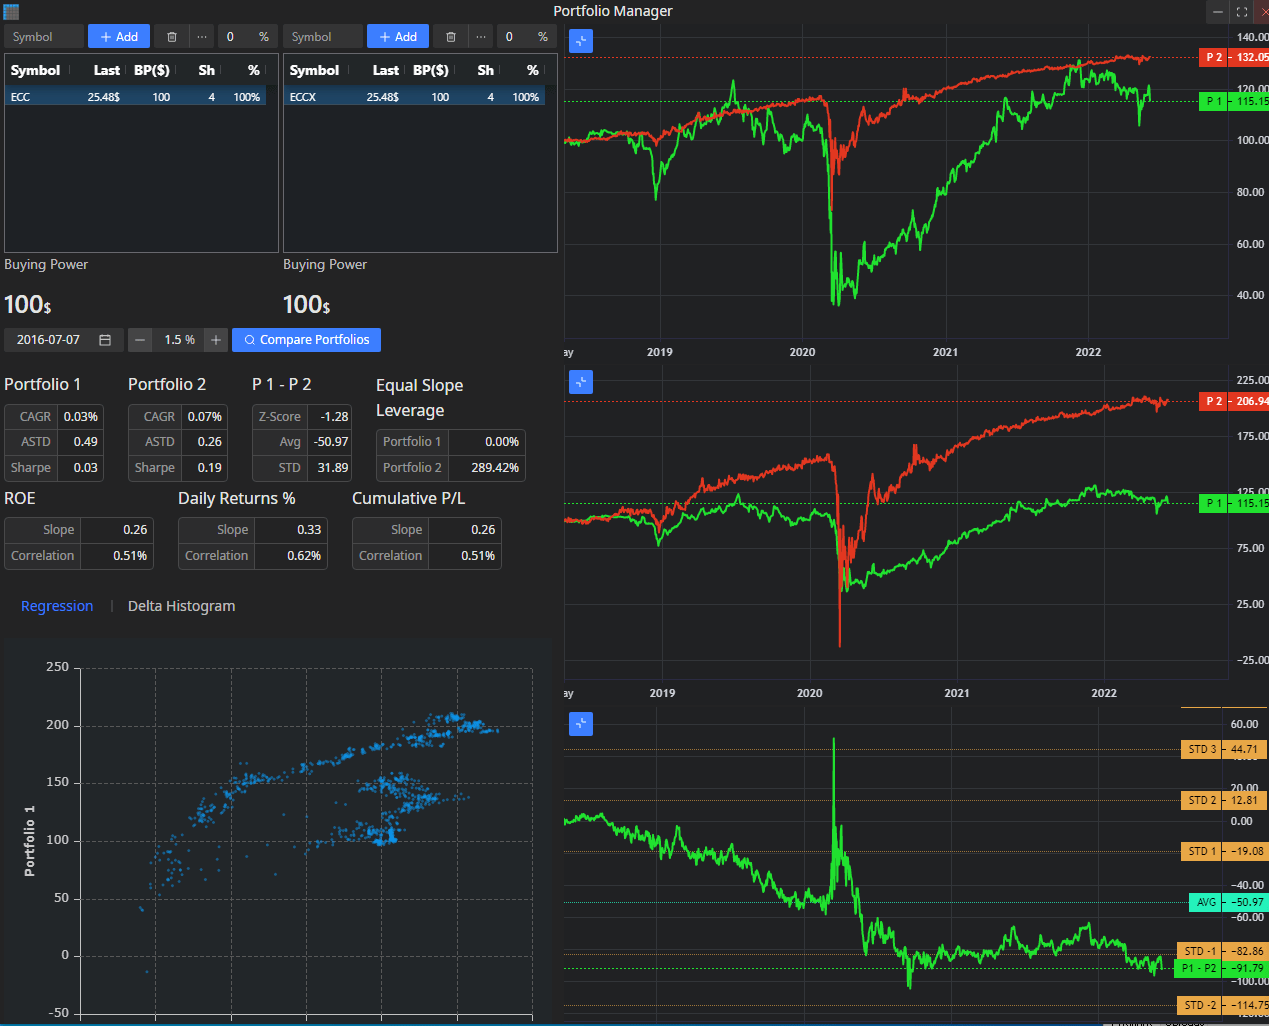
On the upper chart, one can see how the equal dollar amount portfolio of ECCX compares to ECC. It is obvious how much more risk ECC generates. The big problem here is that ECC is not some company that is expected to generate a decent amount of capital appreciation. For the last 5 years, ECC has been able to return 8.9% with the following metrics:
ECC metrics (Morningstar)
If one is to slightly leverage ECCV, let’s use 30% as much as ECC is leveraged, the expected return of the leveraged ECCV position is quite similar to the expected return of ECC while taking way less risk. In fact, ECC may pretty well sell all their holdings and buy ECCV, as it is likely to outperform on a risk-adjusted basis. When you buy ECC you need to understand that you are buying a leveraged portfolio of some of the highest-risk assets and you pay an enormous management fee to get exposure to it.
On top of that, your leverage expense is as high as 7%. ECCV can achieve the same result with less risk, and it does not even need ECC to be profitable. When you invest in ECC, you need it to be profitable. I personally fail to understand how a long-term investor would prefer the perpetual risky return of the fund’s common share compared to the same return from an asset way higher in the capital structure of the CEF. This is a total mystery to me. What is one’s expectation of ECC’s return to prefer it to ECCV? To make the comparison even better, I will use the data from last annual report of ECC:
ECC NII (ECC Annual Report)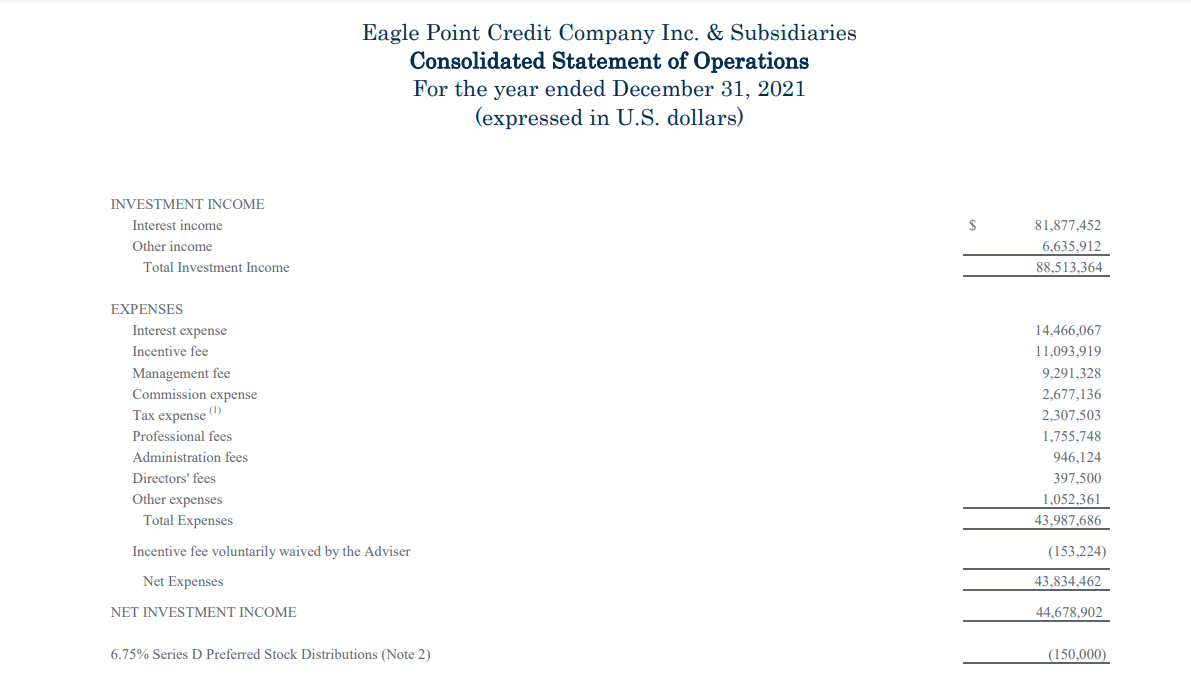
At the time of the report, ECC had $768mln of assets, $242mln of debt, and the $24mln perpetual preferred stock ECC-D was accounted for as temporary equity and 502mln of net assets. I will remind you that ECC is constructed to pass-through the income, and capital appreciation is likely to occur only after big losses as in 2020.
What you can expect from ECC in the future as a most positive scenario is for the fund to continue to generate the same amount of investment income. Here are the numbers. The assets of ECC earn 88.5mln on 768mln, or 11.52%. Only management fees and incentive fees eat up 23% of this income. When you add to this all the expenses and the leverage expense, the NII falls down to 44.7mln. This is a 5.82% return on assets or around 8.9% ROE. This is achieved with around 31% leverage at a very high cost. This 8.9% ROE is achievable only if the highly risky portfolio of the CEF continues to work as expected.
And now is the time to remind you that ECCV is way higher in the capital structure of the CEF compared to the equity. If ECC continues to generate its 8.9% ROE, then ECCV is at no risk whatsoever. In fact, if you are buying ECCV today and are highly certain of the credibility of your investment, and let’s say you give it a “BBB-” personal rating, by default you give ECCV a rating at least 4 notches higher than something like an “A.” This is just by default. Any rating you give to ECC, give ECCV 4 notches higher.
So, how much can you earn by ECCV if you leverage it yourself at 30% without any management fee (you can pay yourself)? Let us assume a 2.5% leverage cost at your broker and use the same numbers: 768 in assets, 266 in debt (temporary equity included), and a 7.2% YTM of ECCV. This investment yields 9.69%. It is way less risky, and on top of that ECC’s yield is impossible to be generated if ECCV does not generate its yield first. I am also posting the working sheet that I used to compare the two alternatives, and you are to judge which is easier to understand:
ECC Calculations (personal spreadsheet)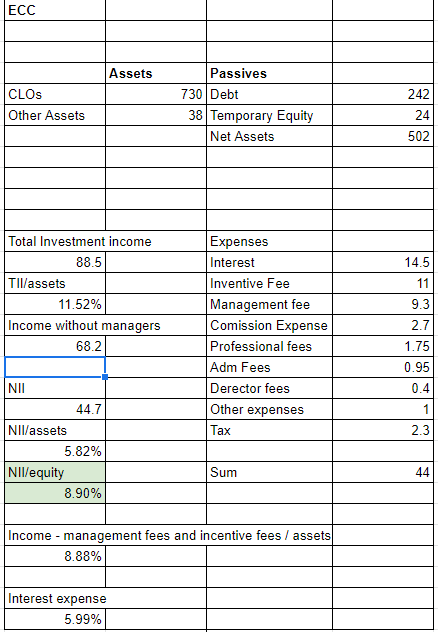
Here you have to look at the annual report and read every single detail to understand how exactly ECC generates its final distribution. And, of course, here is the ECCV calculation:
ECCV Calculations (personal spreadsheet)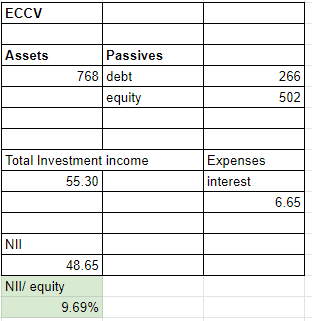
If you still believe ECC is better, do share why.
ECCV seems to be mispriced and has capital appreciation potential
It is very hard to give an exact fair price for an instrument without a credit rating, and the only straightforward comparison can be seen in the following picture:
CLO CEF Yield Curve (Proprietary Software)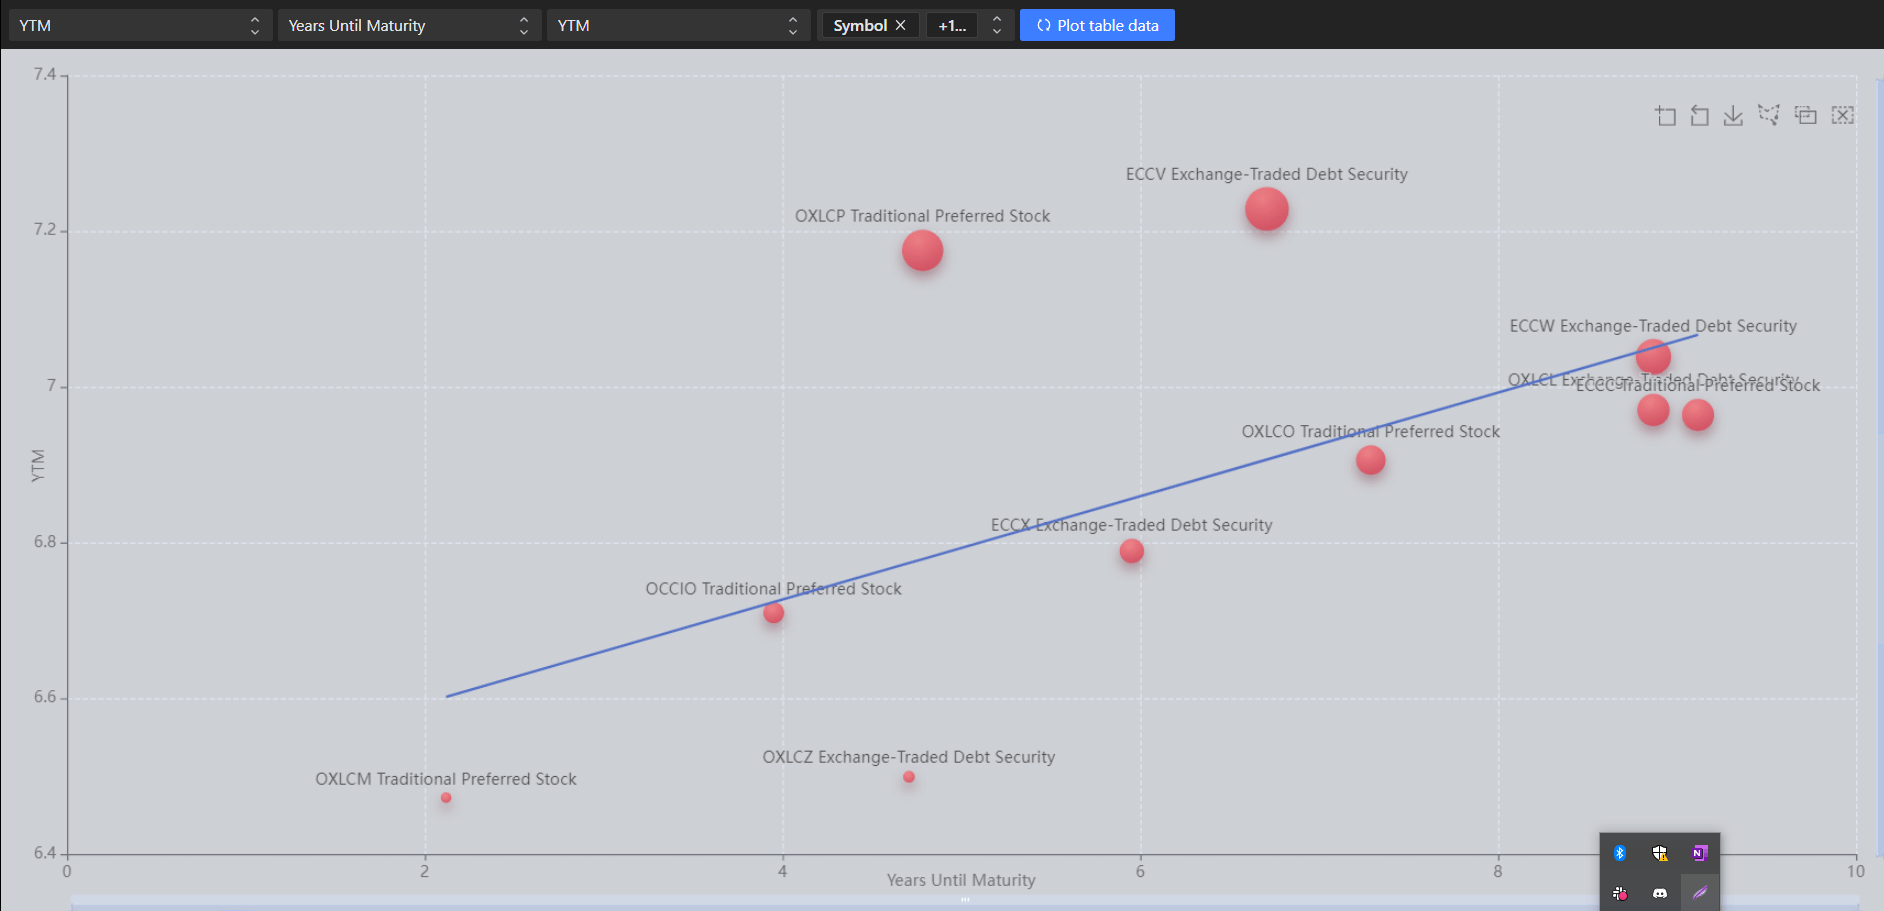
ECCV has the highest YTM despite having shorter maturity and being higher than the capital structure compared to most of the products on the chart. We are not talking about some crazy arbitrage potential and, in fact, I am a fan of all of the products in the picture. Just at the moment, ECCV seems to be the best value. For ECCV to have a YTM (XIRR calculation) of 6.8% it has to trade at 23.60. ECCV is ex-dividend on the 14 of June 2022, so one has to adjust the 23.60 price by 33 cents. The capital appreciation potential of 60 cents does not sound impressive but keep in mind this is a bond with very low duration. It is not supposed to give large opportunities.
Conclusion
ECCV and its 7.2% yield for less than 7 years seem to be among the best values of today’s exchange trade fixed-income products. It comes with the credit risk of CLO equity but is superior to its common equity both in terms of seniority and return (assuming equal leverage), so anyone taking a chance in ECC, OXLC, or OCCI has to consider ECCV. At the moment of writing, ECCV is most likely the best way to generate low-duration income while being indirectly exposed to the CLO sector.
Be the first to comment