

Gold (XAU/USD) Analysis
- Gold enters oversold conditions in the aftermath of hawkish rate forecasts from the Fed
- Pre-invasion level of 1611 within touching distance as fundamentals continue to weigh on the precious metal.
Recommended by Richard Snow
Get Your Free Gold Forecast
Gold Enters Oversold Levels After Hawkish Fed Forecasts
Gold continues to be on the receiving end of contractionary monetary policy that is gaining traction among major central banks, bar the Bank of Japan. The Fed’s latest summary of economic projections, particularly the dot plot – which forecasts the Fed funds rate over time, forced the market to play catch up as Fed members were more hawkish than expected.
Implied probabilities via Fed funds futures initially saw the Fed hiking over 4% but expected rate cuts to follow shortly after. The Fed’s dot plot revealed a rather unified preference for rates to end 2023 higher than 2022 – implying that rates will remain higher for longer which evoked a market response. The dollar (DXY) has soared around 4.6 points (4.19%) since the day of the FOMC meeting, adding further pressure to the precious metal at a time when global commodities continue to weaken.
The weekly gold chart shows the vulnerability of the yellow metal ever since breaching the significant 1776 level. 1776 held prior attempts to trade lower on multiple occasions – highlighted via the circles on the chart. The level also represented the full retracement of the 2021-2022 major move.
The next level of significance is the pre-invasion level of support at 1611, corresponding to January this year. However, the daily chart shows gold finally entering into oversold territory on the RSI, although, it must be stressed that markets can remain on oversold territory for extended periods. Any hint of a retracement should only be considered upon a return from oversold conditions, at which point 1676 reappears as resistance.
Gold (XAU/USD) Weekly Chart
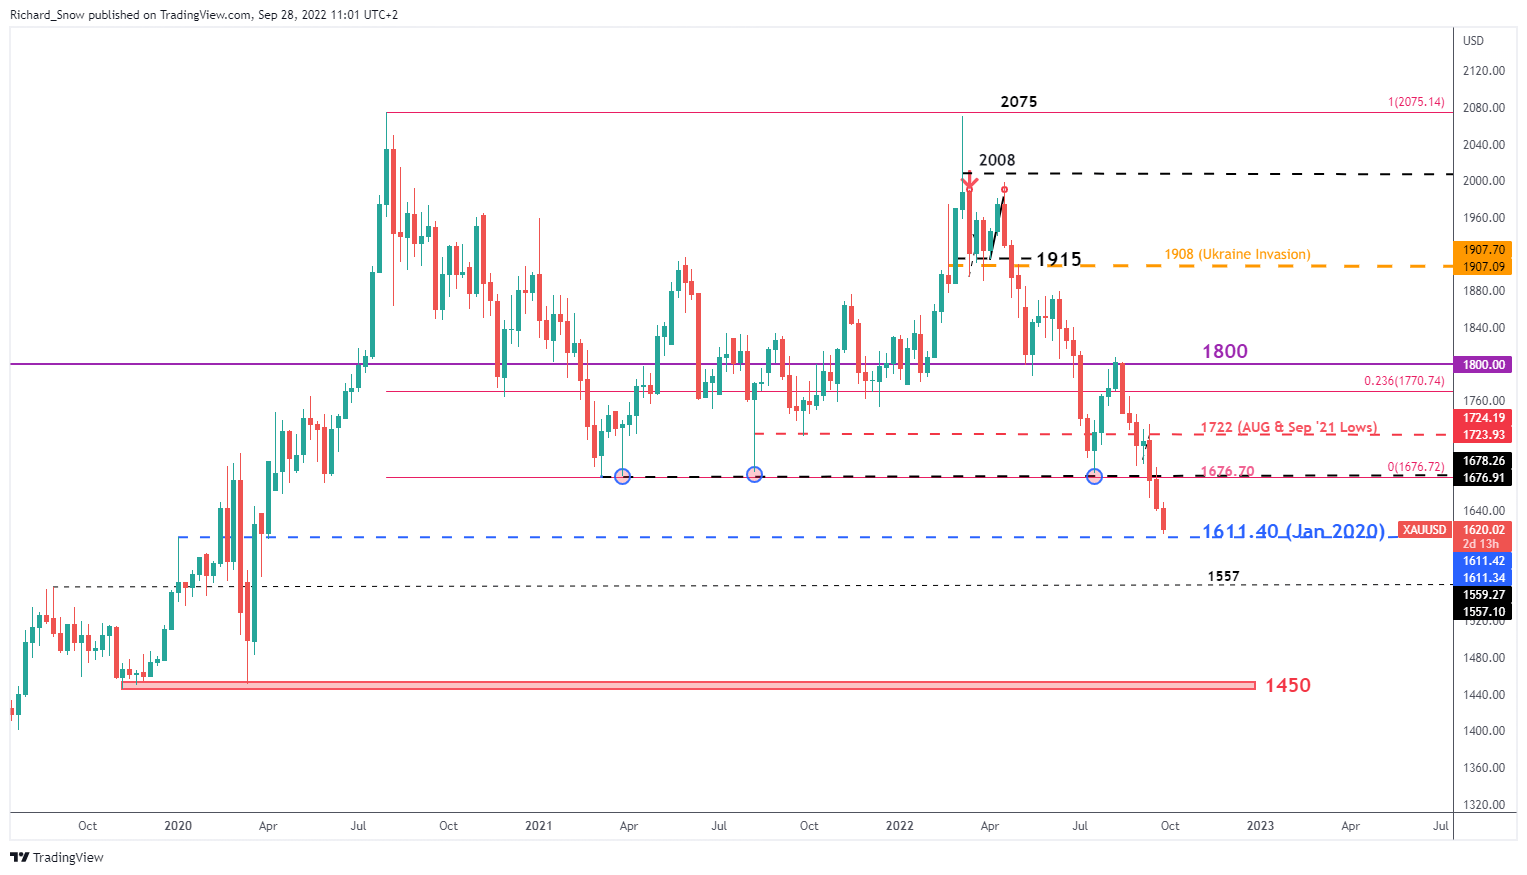
Source: TradingView, prepared by Richard Snow
The daily chart reveals the very nature of the current downtrend ever since failing to break above the 1800 level – the start of this current leg lower. Typically, in strong trending markets, there is a tendency for pullbacks to be relatively shallow and short-lived. The daily chart highlights multiple short-lived pullbacks that were followed by strong sell offs, suggesting that sellers aren’t done just yet.
Gold (XAU/USD) Daily Chart
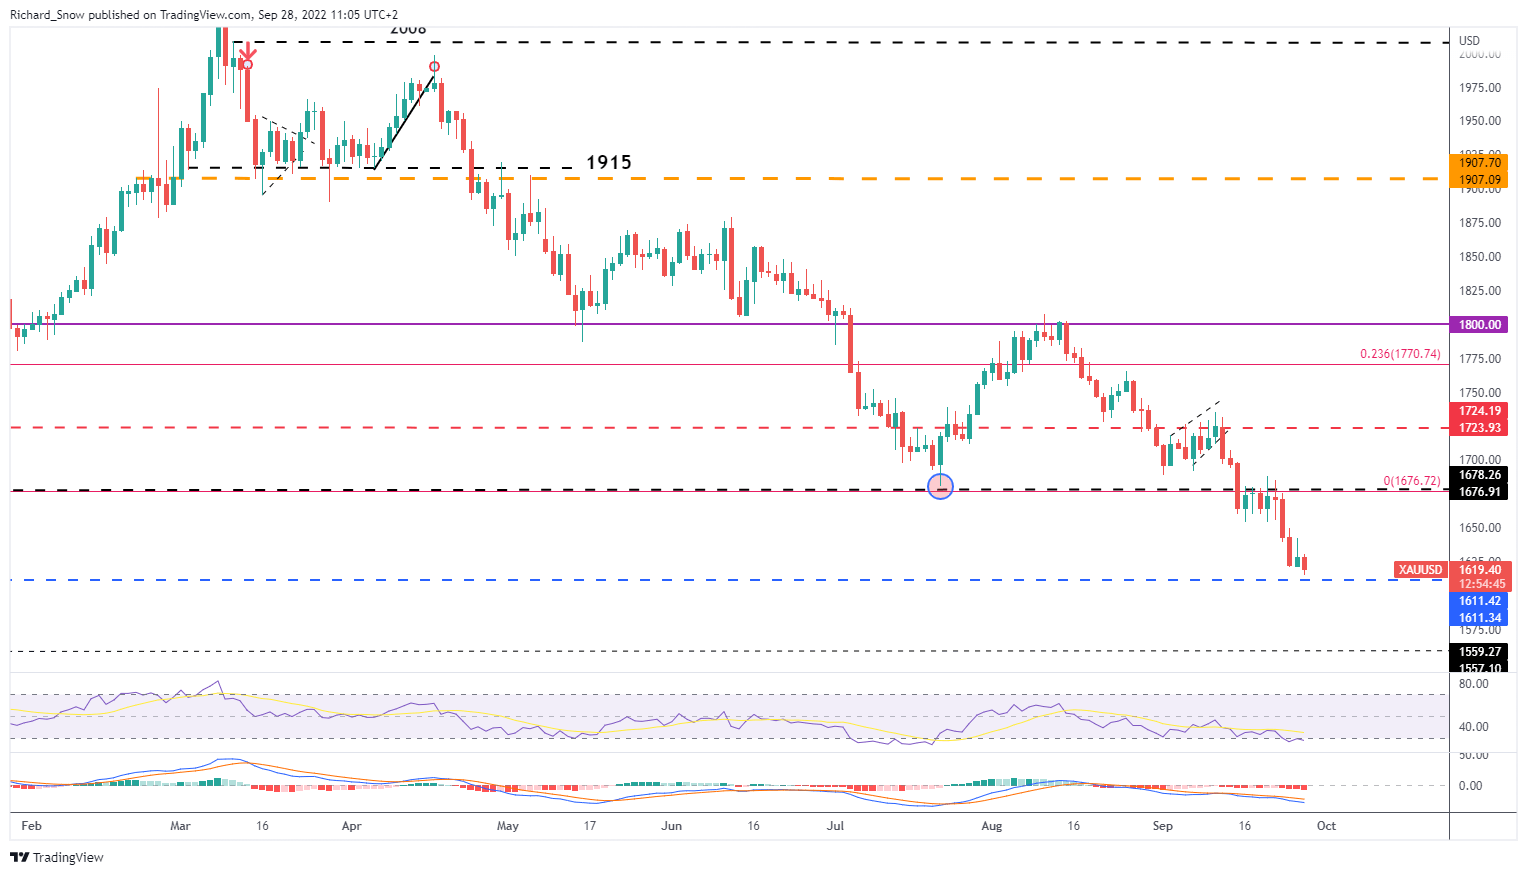
Source: TradingView, prepared by Richard Snow
— Written by Richard Snow for DailyFX.com
Contact and follow Richard on Twitter: @RichardSnowFX
Be the first to comment