

helen89
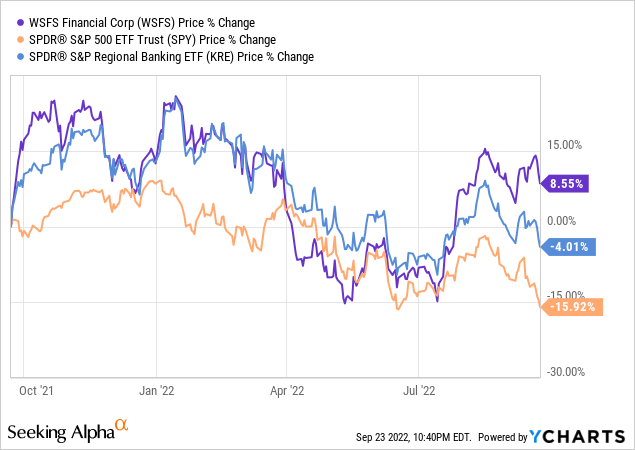
Investors should consider selling shares of WSFS Financial Corporation (NASDAQ:WSFS). The stock has performed well in 2022 by exceeding both the S&P 500 and the S&P Regional Banks Select Industry Index. However, the uptick in price has led to a reasonable market value for WSFS shares. The stock is not a great value pick, based off its low dividend yield, low price to earnings, and low price to book value. An investor seeking exposure to regional banking can find better value elsewhere.
The major catalyst that can make WSFS a future buy is an increase in dividend yield. Despite my initial criticism of the stock as a value pick, I believe that a 2 to 3 percentage point dividend increase will have major ramifications on moving the stock higher. The company does have excess cash flows and could begin returning more value to shareholders through dividends in the near future. Additionally, I believe that much of WSFS’s 2022 success can be attributed to the firm’s success in M&A. WSFS has shown a consistent ability to improve profitability though such acquisitions, and the announcement of new M&A activity will probably move the stock price higher.
WSFS – Background
Headquartered in Wilmington, Delaware, WSFS has a market cap of $3.16 billion and an enterprise value of $2.02 billion. The bank was founded in 1832, and has a network of 110 branches throughout Delaware, Pennsylvania, and New Jersey. The firm touts its “community banking” vs. the “centralized decision making of others” and has parlayed this into significant market presence in the Greater Philadelphia region. According to the firm’s 2021 10K, it operates through 3 business segments: cash connect, banking, and wealth management. WSFS’s banking segment accounts for 82% of the firm’s earnings before taxes, wealth management accounts for 15%, and cash connect accounts for 3%. In terms of profit, the cash connect segment loses roughly $25,000 per year (35,000 expenses vs. 10,000 income). Wealth management and banking are both profitable.
WSFS’s management has undertaken significant acquisitions over the past few years. In early January 2022, WSFS announced the completion of its deal to acquire Pennsylvania-based Bryn Mawr Trust. The Bryn Mawr acquisition has strengthened WSFS’s foothold in the Greater Philadelphia region and added $20 billion in assets to the firm’s balance sheet. Moreover, WSFS completed its acquisition of Beneficial Bancorp in early 2019. The Beneficial Bancorp acquisition grew WSFS into the “largest, premier, locally-headquarter bank in the Greater Delaware Valley.” WSFS has also been slowly expanding into other markets by opening one branch each in Virginia and Nevada. These acquisitions and expansions have allowed WSFS to grow its employee base in addition to its deposit base. Between 2017 and 2021, WSFS deposits have grown from $5 billion to $13 billion.
Comparable Companies – Ratio Valuation
Large cap firms such as JPM, Wells Fargo (WFC), and Bank of America (BAC) all have substantial presence in the Greater Philadelphia area. However, WSFS’s competitors in terms of regional banks are Citizens Financial (CFG), PNC Financial (PNC), M&T Bank (MTB), Fulton Financial (FULT), New York Community Bancorp (NYCB), Partners Bancorp (PTRS), and Berkshire Hills Bancorp (BHLB). I particularly like BHLB for comparison purposes because it has roughly the same number of branches as WSFS, and it was also founded in the 1840s.
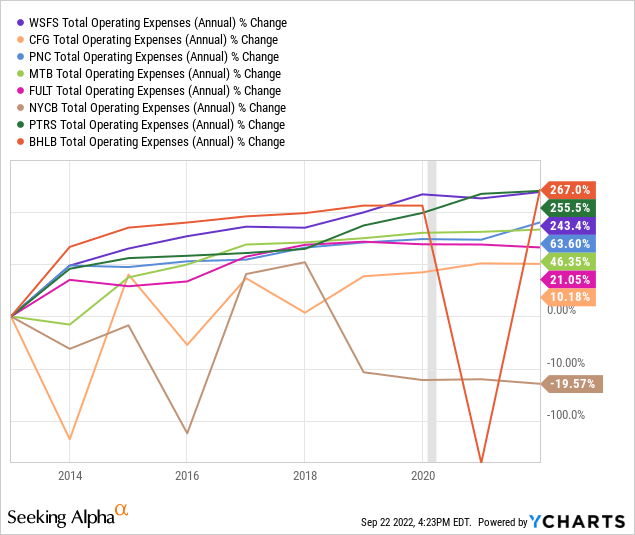
I’ll start out with a comparison of operating expenses between WSFS and its various competitors. I used log scale to smooth outliers in the data. WSFS’s operating expenses have increased by 243% over the past 10 years. Expenses are not necessarily always bad because their theoretical purpose is to help generate revenues. As WSFS has acquired competitors in the past few years, expenses have ballooned. Ballooning expenses can magnify losses. However, WSFS has increased its profitability despite the increasing expenses.
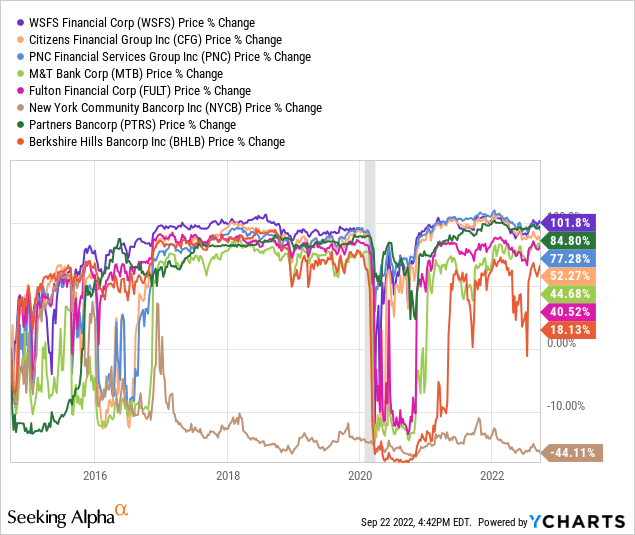
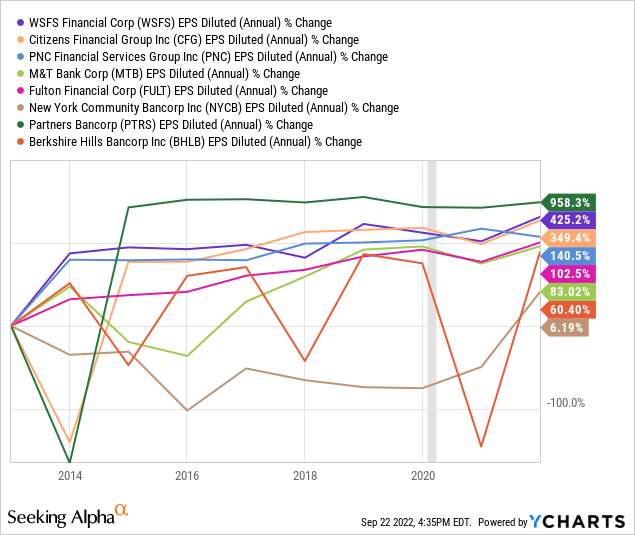
With respect to profitability, WSFS has outperformed many of its peers. I have measured profitability using diluted earnings per share here. If net income is used, WSFS outperforms all of its peers. However, if operating cash flow is used, WSFS is average compared to peers. I also included a price graph below because I was surprised to see that WSFS’s share price has increased more on a percentage basis than all of its peers. My interpretation is that the market is rewarding WSFS’s profitable acquisitions and its earnings stability. As mentioned earlier, I believe that BHLB is a great comparable to WSFS. The market has been much more bullish on WSFS over the last decade. BHLB has also engaged in M&A deals, but with much less success with respect to EPS growth.
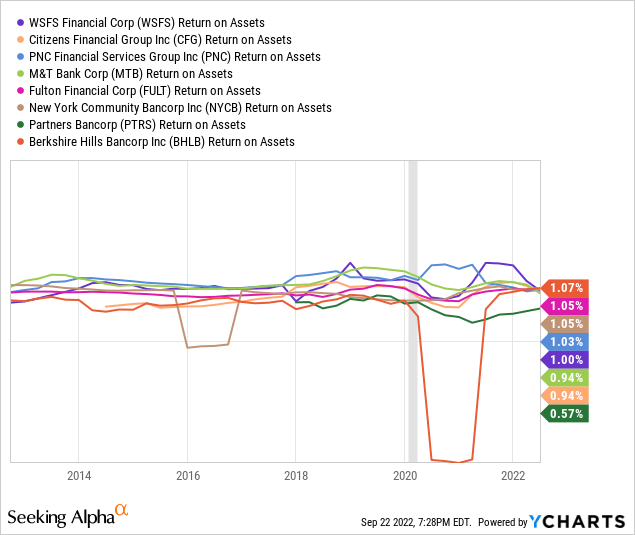
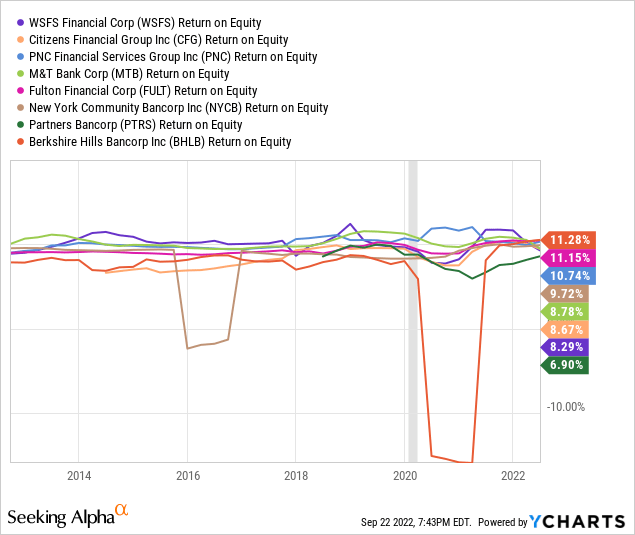
Ratio analysis is highly subjective, and I am a sucker for ROE and ROA. ROE and ROA are a good way to evaluate a firm’s managerial structure. For these charts, I again used log scale.
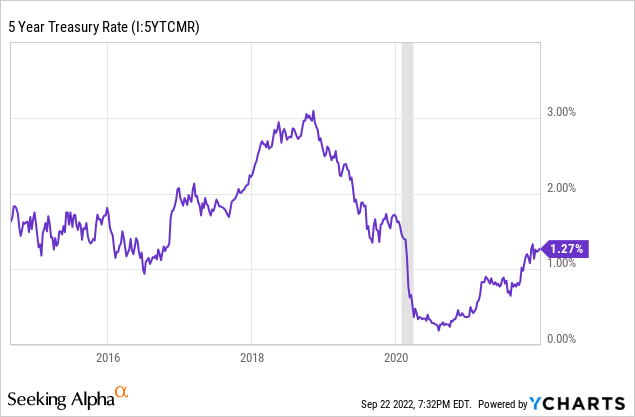
Compared to its competitors, WSFS has poor ROE and ROA measurements. In terms of ROA, none of these firms are knocking it out of the park. The return on “risk-free” 5 year treasuries during this period was about 1.4%. Seeing as WSFS’s ROA during this period was 1%, the firm could have theoretically made a better return investing in treasury bonds as assets instead of the assets on its balance sheet. This is definitely an oversimplification, and I’ll admit that many banks suffer this same issue, but I think that it speaks to the firm’s management. Moreover, while WSFS has a below average return on equity compared to its competitors, at least its ROE is approximately equal to the 8.5% per year return of the S&P 500.
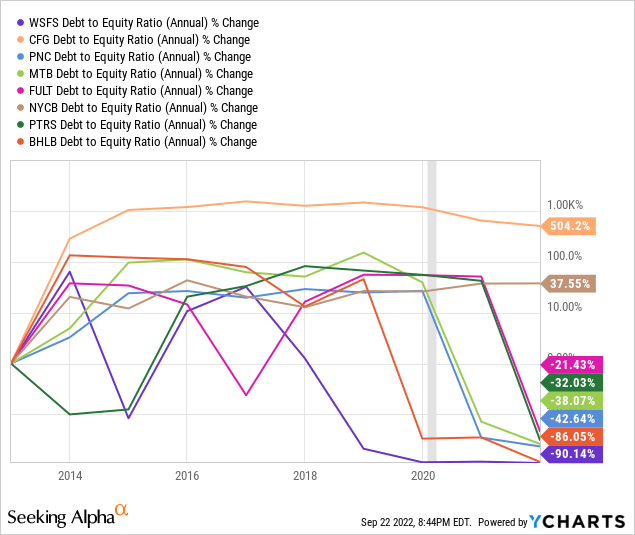
I am going to use the debt/equity ratio as a proxy for financial leverage. Leverage carries a tax advantage, but it can also have a detrimental effect on a firm in crisis. Over the past decade, WSFS has significantly decreased its debt/equity ratio. This is good for investors looking for a bank with good financial health, but it is also questionable given the cheap cost of borrowing between 2012 and 2022. I also think that investors should consider the fact that WSFS’s free cash flow has tripled since early 2020. The firm currently has $270 million in free cash flow and investors can get $2.49 in free cash flow for every WSFS share that they purchase.
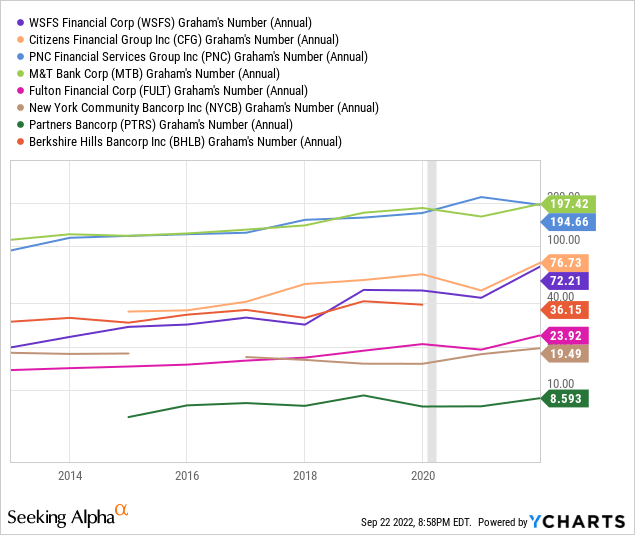
“Graham’s Number” is legendary economist and investment wiz Benjamin Graham’s way of valuing companies with book values that fairly approximate market values of their assets. It tells a prospective investor seeking a high margin of safety what their maximum purchase price should be. WSFS currently sells for $48 and based on Graham’s calculation, a defensive investor could purchase for anywhere up to $72. I do not suggest that investment advice be made on this alone, but it is useful context based on WSFS’s price/book ratio and asset base consisting of fair value accounting principles.
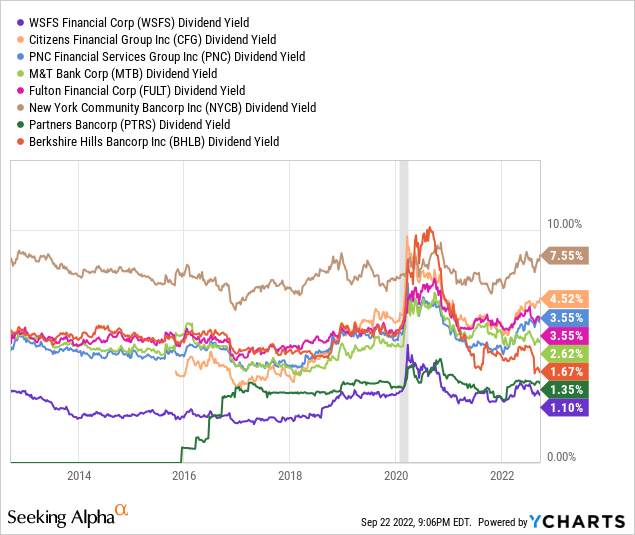
Dividend growth is a great way to reward shareholders. WSFS has paid a steady dividend over the past 10 years. However, the bank’s dividend yield is not impressive compared to its competitors. In addition, WSFS has implemented a share buyback program in 2022.
WSFS – Risk Factors
WSFS is dependent on a good credit rating so that it can borrow. Kroll Bond Rating agency has given WSFS a senior debt rating of A- with a stable long term perspective. I am sometimes wary of credit ratings because the ratings agencies need business, but an A- rating should reassure investors. For perspective, JPMorgan Chase (JPM) has the same rating per Standard & Poor’s.
WSFS has a large commercial loan portfolio. Commercial loans generally carry more risk than consumer and residential loans. Fortunately, nonperforming commercial loans are not popping up on the balance sheet, but it is hard to know the magnitude of these risks until there is a significant down-cycle. This is one of my biggest concerns with WSFS, as its commercial lending business could take a significant hit during a recession.
WSFS has a defined benefit plan that is continuously growing year over year as more employees join the firm. However, WSFS seems to be managing this liability well by establishing appropriate pension allowances. Moreover, WSFS’s investment securities portfolio is primarily composed of fixed-income instruments. The bond market has been ravaged in 2022, and investors should be wary of any future write-downs that will be required for these securities.
The above risk factors are taken from WSFS’s annual reports. My primary concern from an intuition perspective is that WSFS has oversaturated its market. The firm has already captured much of its target clientele in the Philadelphia region. Its many acquisitions have been a function of its need to secure more customers. Buying your competitors is a good way to do this, but there are only so many smaller competitors that can be bought before you become the smallest. It’s a fine line. I’m originally from the Wilmington, Delaware region, and I am going to offer up the cautionary tale of Wilmington Trust, an old bank that was acquired by MTB in 2010. Wilmington Trust was a direct competitor of WSFS, and won the battle for a while. However, they ultimately oversaturated their market and collapsed in the shadow of the 2008 Global Financial Crisis. Wilmington Trust’s shareholders were not well compensated in a steeply discounted bank firesale. The comparisons between WSFS and Wilmington Trust are not apples to apples, and I believe that WSFS is fundamentally sound. In fact, it could even become the next PNC, CFG, or MTB if it continues its success. However, I worry what will happen in the bear case where rising interest rates and a slowing economy contribute to a dramatic decline in its stock price once its growth potential runs out.
DCF Valuation
I formulated a discounted cash flow model to supplement WSFS’s multiples valuation. Units are in thousands to match units on the firm’s financial statements. The process began with a computation of EBIT, capital expenditures, and the change in net working capital. These computations were all based on 10K and 10Q data. In addition, depreciation and amortization values were taken from WSFS’s financial statements. The firm has taken an earnings hit through the first half of 2022, and it seems like EPS will fall year over year. I factored this into the analysis, which features lower than average free cash flow numbers for 2022 and 2023. The possibility that the firm does not return to higher levels is likely and should be considered by prospective investors.
Author’s calculations based off 2021 WSFS 10K.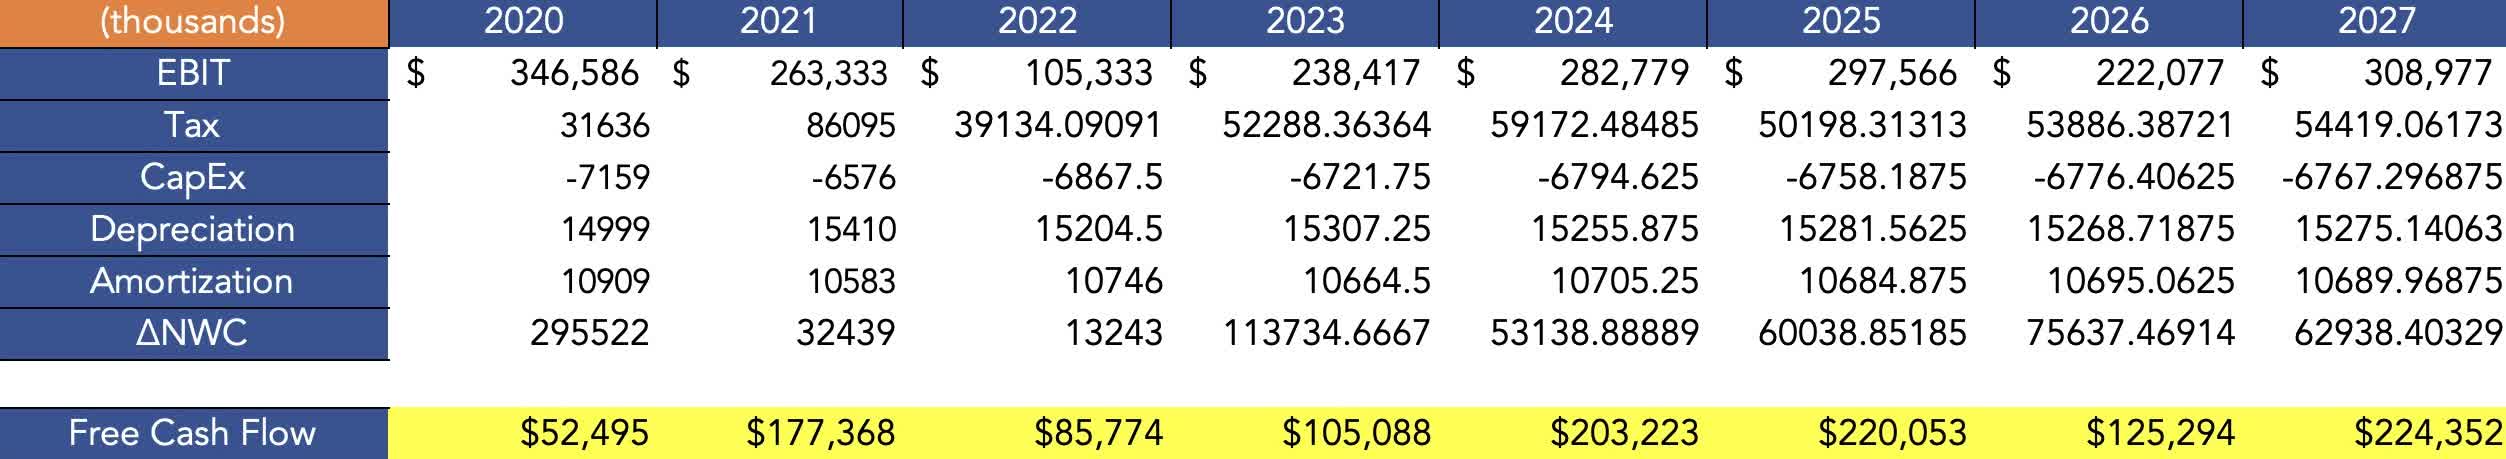
The discount rate was computed based on the firm’s weighted average cost of capital. Two major assumptions made here were that the cost of equity and cost of debt will rise and stay elevated over the next five years. This reflects the fact that investors generally require higher returns during times of economic uncertainty to compensate them for higher levels of risk. Historical data from 2020, 2021, and the first half of 2022 also lent credence to rising costs of debt and equity.
Author calculations.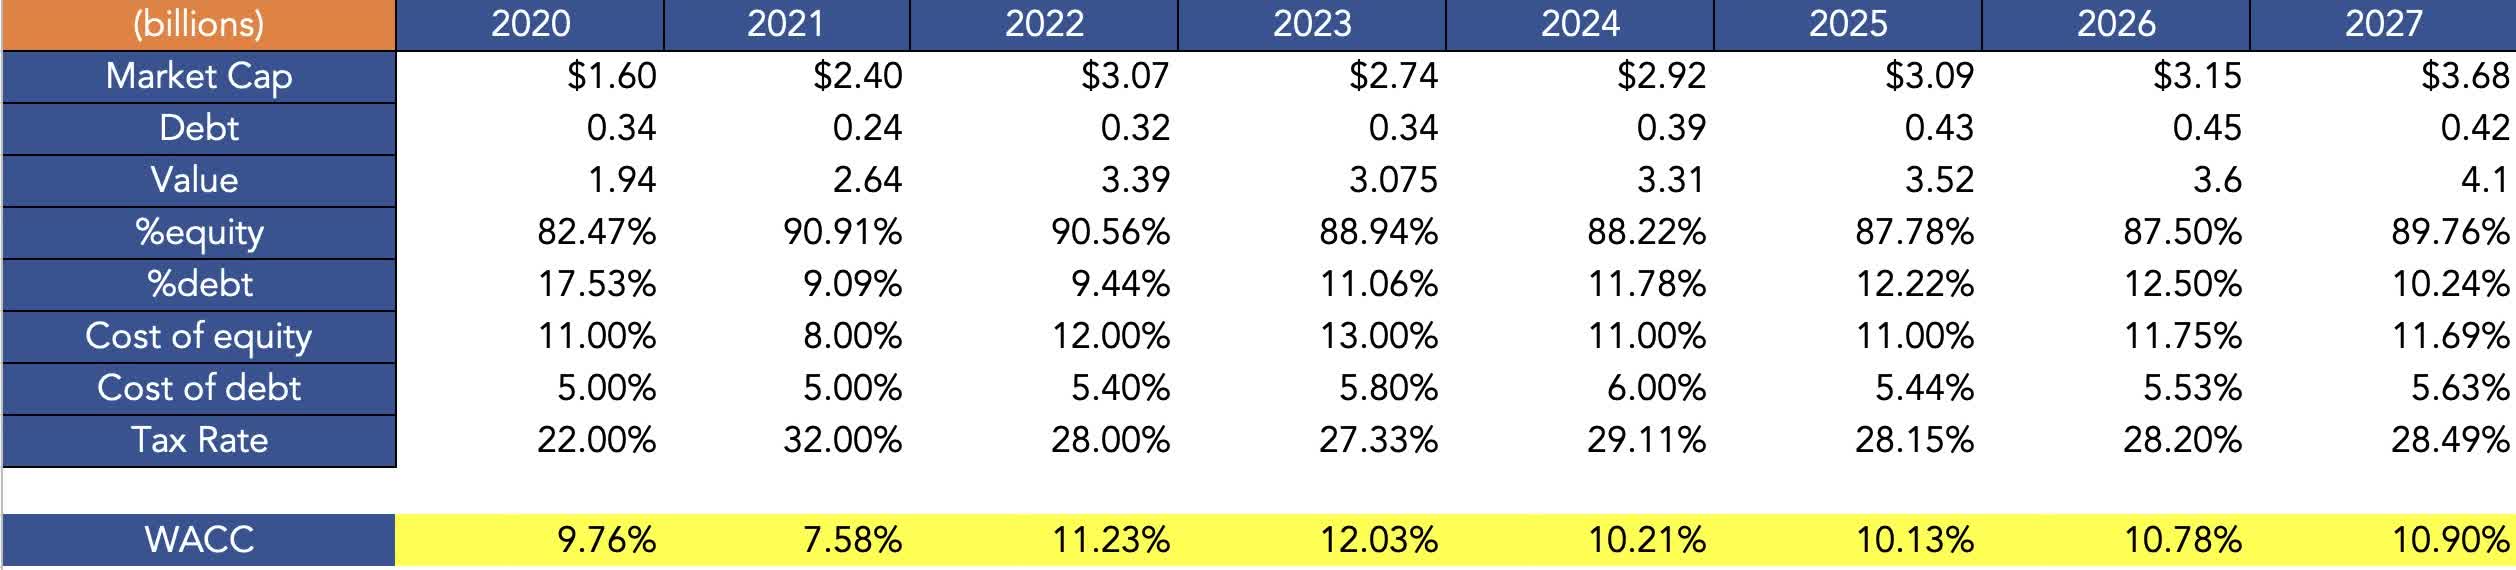
Terminal value was calculated using an average of the perpetuity growth and exit multiple methods. For the perpetuity growth method, 1.75% was used as the growth rate. Industry growth averages for regional banking did not seem appropriate because growth rates differ by region. I used a multi-year average of the U.S. GDP growth rate as a proxy for industry growth. I think that it provides a more conservative estimate. The EBITDA multiple was taken from an average of the multiples of comparable companies.
Author calculations.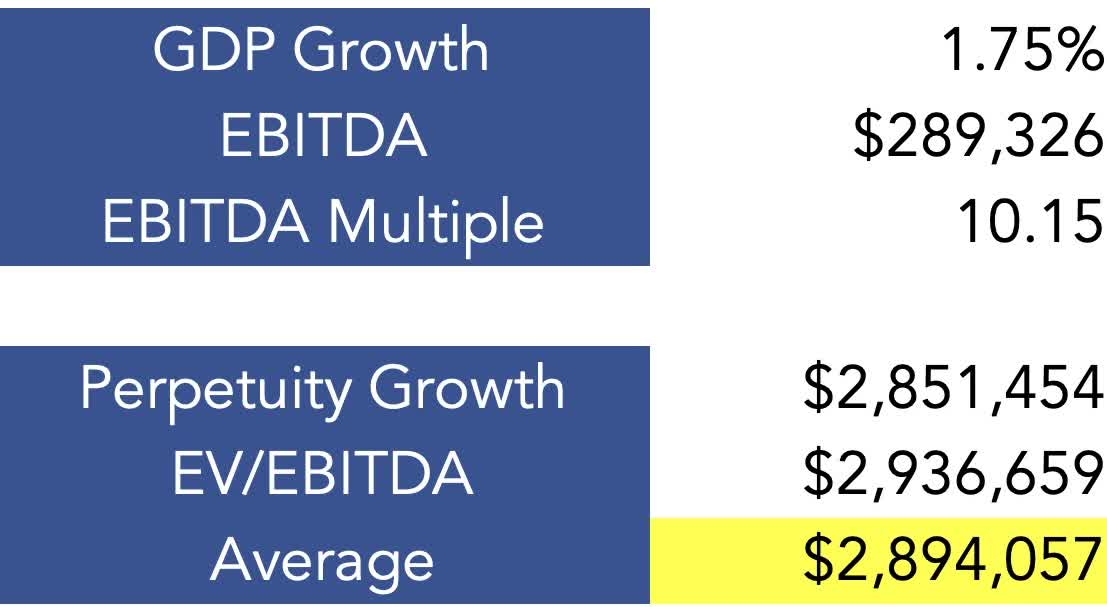
I discounted cash flows back to the present using the firm’s WACC. A stub period was used in order to reflect the fact that the cash flows are not occurring evenly at the beginning of every year. The discounted cash flows were then added together to arrive at the firm’s enterprise value. I cross referenced this number with third party sources, and it seemed like my EV was a bit too high. However, I manipulated WSFS’s cash and equivalents by removing restricted cash from the total. Restricted cash is cash set aside for specific projects, and while it is definitely cash, I think that removing it gives a more accurate perspective on the firm’s effective cash balance.
Historic data was used for WSFS’s shares outstanding, and a final step of dividing the equity value by the number of shares outstanding yielded an intrinsic value of $56. This number is quite close to WSFS’s current share price of $48.
Author calculations.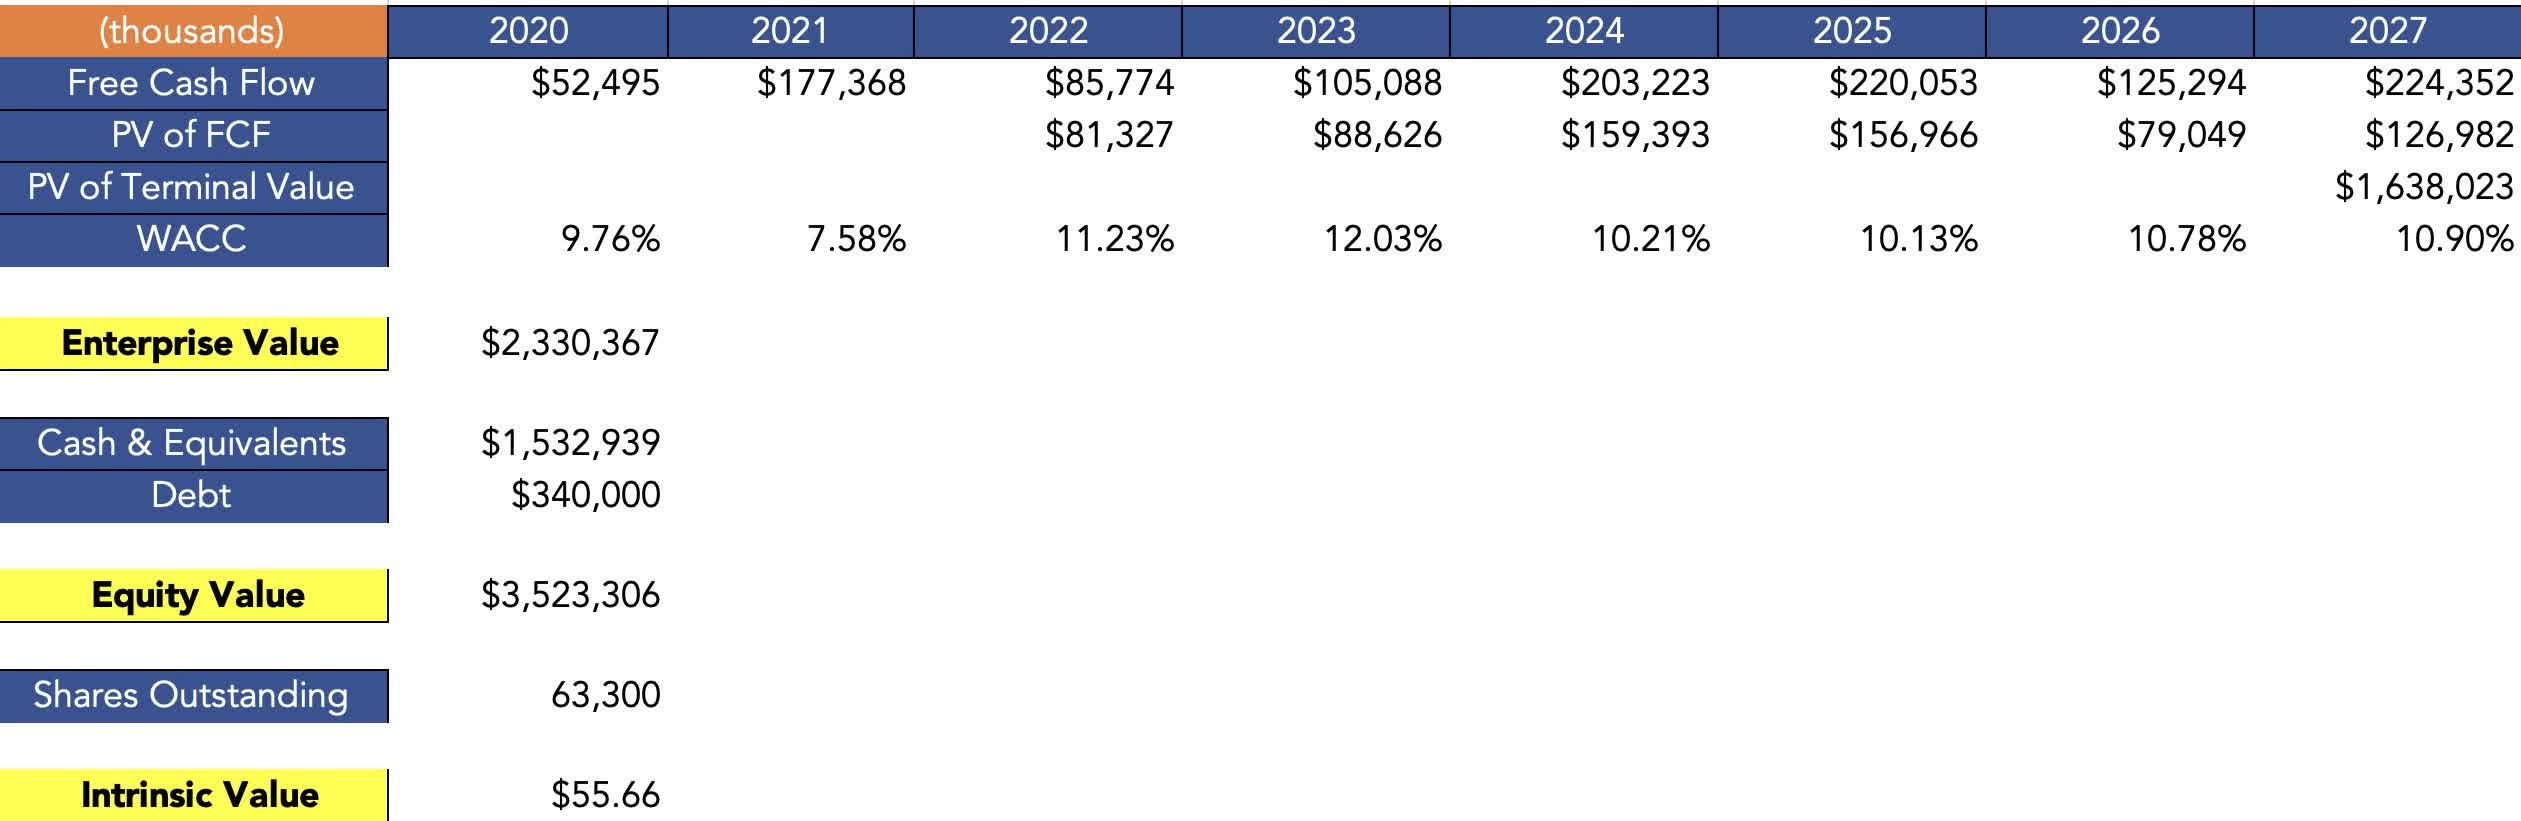
Conclusion
There is much to like with WSFS, but I am fervent that the market’s continued interest throughout 2022 has led to the stock being fairly valued. Essentially, I like the company, just not at $48 per share.
WSFS seems to be in a reasonable position to withstand impending economic headwinds. The firm is well capitalized and not overly leveraged. This gives me confidence that a major development, such as an increase in dividend yield, will make WSFS a future buy. I generally do not like to buy things until a good news event actually happens.
Be the first to comment