

S&P 500, Volume, Dollar, GBPUSD, USDJPY and EURUSD Talking Points:
- The Market Perspective: S&P 500 Bearish Below 4,100; EURUSD Bullish Above 1.0000
- The biggest rally for the S&P 500 in nearly a month was an impressive move with broad ‘risk’ participation, but conviction remains a dubious commitment at best
- Meanwhile, the Dollar’s surge to multi-decade highs this week feels an unholy combination of risk trends, rate differentials and economic imbalance – leading the ‘majors’ to painful extremes
Trade Smarter – Sign up for the DailyFX Newsletter
Receive timely and compelling market commentary from the DailyFX team
Subscribe to Newsletter
An Intense and Broad Risk Bounce…With Little Fundamental or Systemic Backing
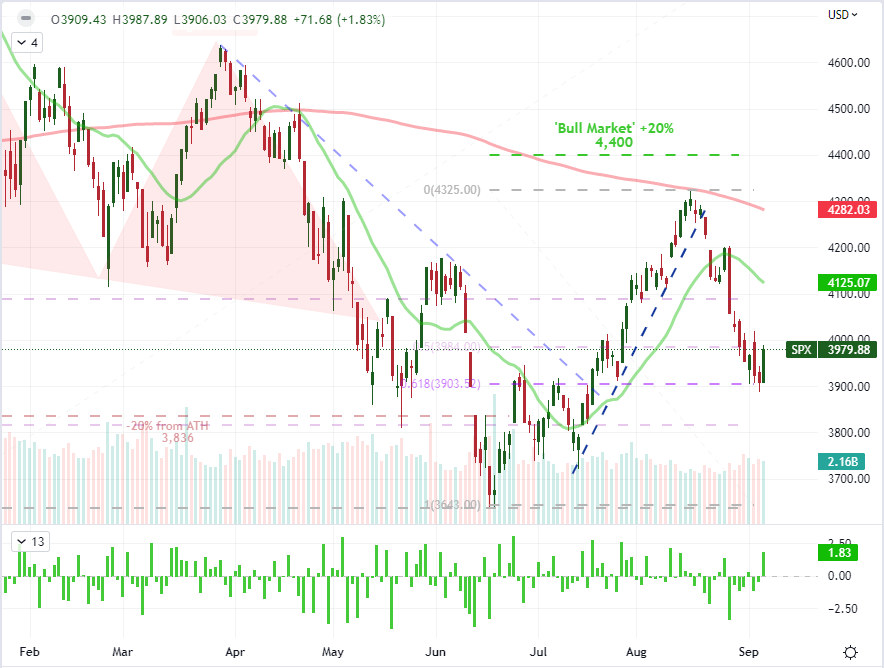
My focus this past session – and moving into the second half of the trading week – is more on the US Dollar’s performance and less on the traditional ‘risk’ measures. That is not to say that general market sentiment is less important for my overview of a financial system update with an assessment of the opportunities at hand. In reality, I consider risk trends the ‘great equalizer’ as an overriding influence regardless of fundamental proclivity or what asset we may be discussing. Through this past session, the S&P 500 posted a robust 1.8 percent rally for the biggest charge higher since August 10th. Given the breadth of the classified ‘risk on’ move, it would be seem there is a confidence from the market, but there was very little tangible fundamental backdrop for the bid. Growth forecasts, monetary policy expectations and the outlook for insidious inflation pressures offer little quarter to true confidence. That said, it looks like a fraught course for true conviction for the collective bulls.
Chart of S&P 500 with Volume, 20 and 200-Day- SMAs as well as 1-Day ROC (Daily)
Chart Created on Tradingview Platform
As we monitor the course of our preferred ‘risk’ measures, I’m trying to keep grounded in historical averages. That is not to say that the averages over the past decades for performance, volatility and participation through the likes of the S&P 500 have to play out again in 2022, but these averages exist for a reason. Notably, volatility (via VIX) tends to crest around this time of year as volume recovers. The most notable average though is the S&P 500’s only average monthly loss of the calendar year in September. We absolutely do not have to live by these norms, but market participants will be considering the seasonality more closely given the headwinds offered through traditional fundamentals.
Chart of Calendar Month Average S&P 500 Change, Volume and Volatility from VIX
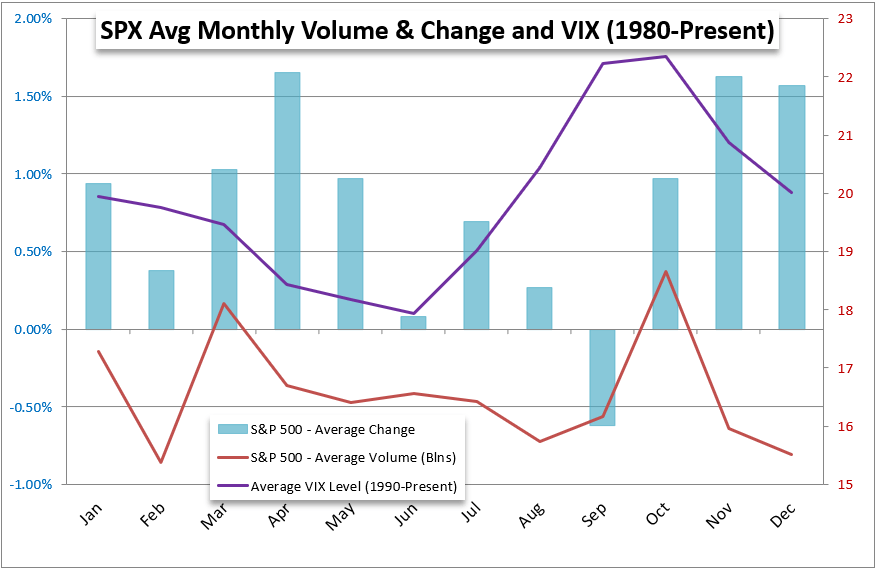
Chart Created by John Kicklighter
The Dollar a Conduit for Fundamental Issues and a Threat In Its Own Right
While it managed to pullback from its intraday highs this past session, the DXY Dollar Index nevertheless managed to charge fresh multi-decade highs this past session. Where was the fundamental motivation originating? The economic docket was certainly accommodating. This past session was light on traditional economic event risk (the US trade balance was a noteworthy update), but there was plenty of systemic insight via matters like monetary policy. Officially, we would receive the FOMC’s Beige Book which both set the two-week countdown to the next FOMC rate decision (September 21st) and offered up interesting insight as to the supports staffs views on economic health and policy response. Alternatively, there were a few Fed speakers on tap with Vice Chair Lael Brainard’s commitment to the Fed line on fighting inflation delivered its own statement as to the spectrum of options seen for the Fed. Putting the many issues of the Greenback against major counterparts, it is worth noting that GBPUSD (also known as the ‘Cable’) briefly tagged its lowest levels in decades this past session. The late-reversal shows the market is not yet ready to capitulate, but the pressure is well founded when consider the UK’s own projected recession (from the BOE), its poor status as a ‘safe haven’ and the limited advantage that yield forecasts play.
Chart of GBPUSD with 50 and 200-Day SMAs and ‘Wicks’ (Daily)
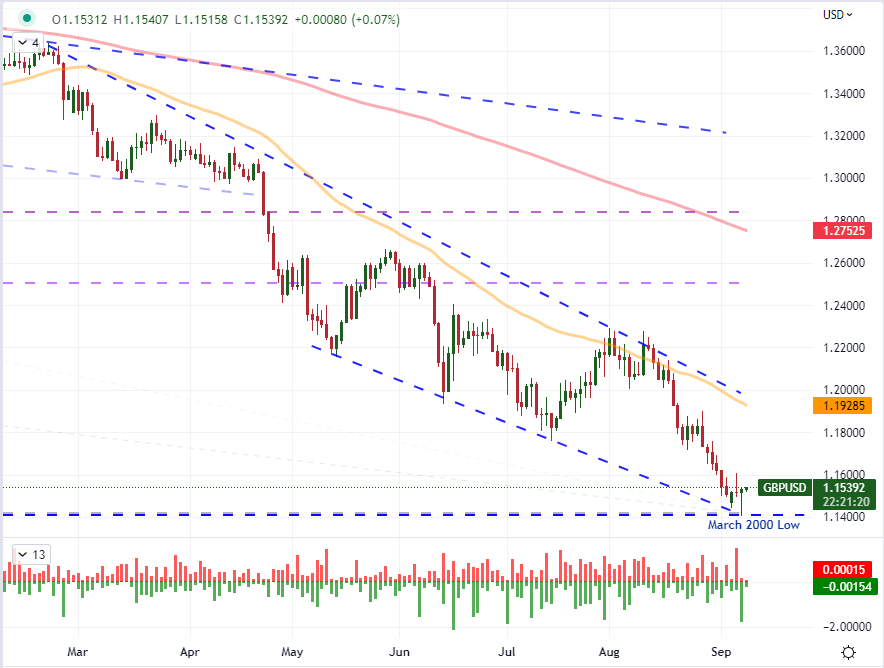
Chart Created on Tradingview Platform
I do believe that the drivers of risk trends, growth disparity and relative monetary policy stance are the principal fundamental considerations at present. And, it is this mix that I’m keeping tabs on when evaluating the most liquid currency pairs – like USDJPY. This Japanese Yen is considered third most liquid reserve currency (after the Dollar and Euro), and its capitulation to the Greenback is proving extreme. This past session, we were within 300 pips of the highest level for he exchange rate since August 1998. If we tick above 147. 67, we will be treading int territory not seen since 1990. What is the principal driver here? I would consider ‘risk trends’ an insignificant contribution for this cross, with growth disparity a modest influence and rate differentials a dominant influence. This is certainly a pair to watch.
Chart of USDJPY with 20 and 100-Day SMAs and ‘Wicks’ (Daily)
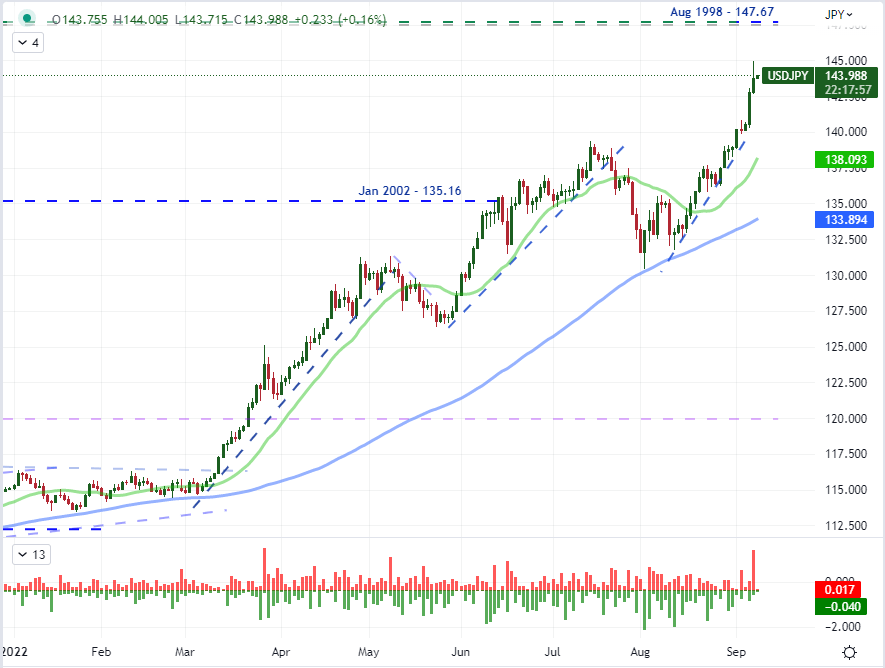
Chart Created on Tradingview Platform
Monetary Policy as a Theme, ECB Rate Decision as a Principal Event, EURUSD a Top Driver
Relative rate forecasts is a top level fundamental theme for the financial markets (and particular exchange rates), but the market impact is not as simplistic a consideration as determining what rate forecast is most robust to see the market’s persistent reallocation of funds. There was no better example of the simplistic interpretation falling short than the reaction and USDCAD and other Canadian Dollar crosses to the Bank of Canada’s (BOC) rate decision. A 75 basis point rate hike after the previous meeting’s 1.00 percent increase is an extreme move, but it also fit right in-line with what the market had expected. If we’ve already discounted such a move, is there any further speculation to be fleshed out?
Spectrum of Monetary Policy Stance by Major Central Banks with Year-End Rate Forecast via Swaps
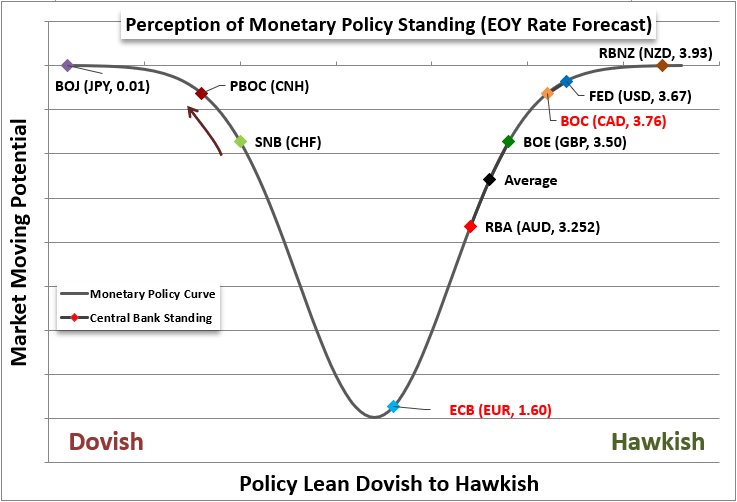
Chart Created by John Kicklighter
Evaluating how comprehensive the market’s rate forecasting prowess is will prove a critical consideration for how EURUSD shapes up moving forward. Top event risk this coming session is the European Central Bank (ECB) rate decision whereby the seemingly perpetually dovish policy authority is seen hiking its benchmark rate by 75 basis points. That would be the biggest hike of the century thus far, but it is also seen as probable enough that it is the highest probability scenario outcome derived from swaps. As we trade just below parity for EURUSD, the lack of follow through on the ‘psychological break’ is a serious feature of the landscape. As the world’s most liquid exchange rate – and arguably its top asset overall – is a cross that should be monitored closely regardless of your trading/investment preferences.
Recommended by John Kicklighter
How to Trade EUR/USD
Chart of EURUSD with 50-Day SMA and 1-Day Rate of Change (Daily)
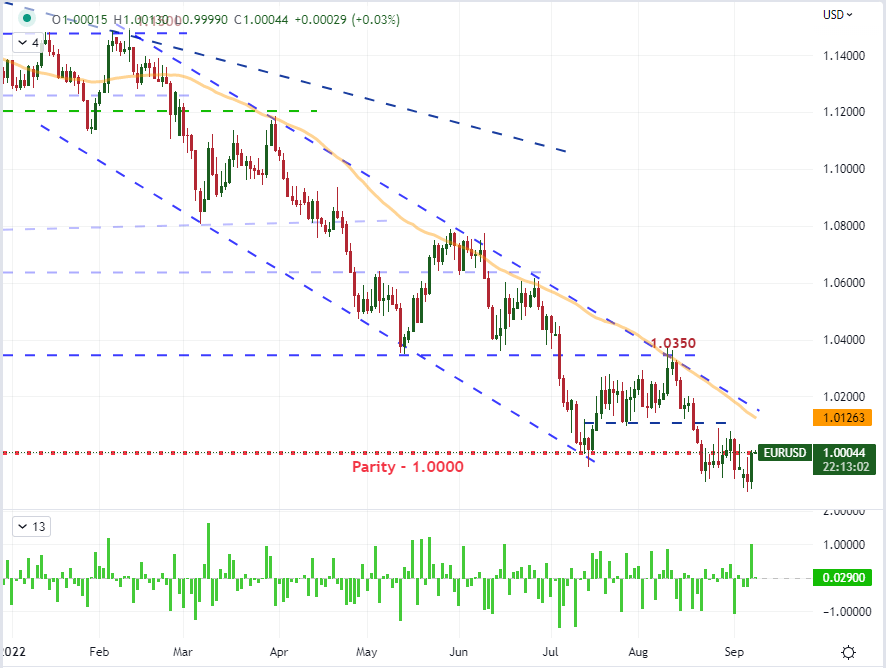
Chart Created on Tradingview Platform
Be the first to comment