

Inside Creative House/iStock via Getty Images
Invitation Homes (NYSE:INVH) is trading very near its 52-week low. In fact, you have to go back to March of 2021 to find the shares even 5% below the current valuation.
Furthermore, with the exception of 2020, when COVID pushed most stocks dramatically lower, Invitation’s yield is very near an all time high. Add that since its inception five years ago, the dividend has grown at a double-digit pace every year. In fact, the stock now posts a five-year dividend growth rate a bit above 40%.
Bears apparently view inflation, rising interest rates, and a tumbling economy as an argument to avoid an investment in INVH. That perspective was reinforced when the REIT missed on FFO and revenue last quarter, and management lowered 2022 guidance as property taxes hurt results.
I see many of these factors as enduring tailwinds.
An Overview Of Invitation Homes
As of June of 2022, INVH had a portfolio of 85,582 homes in 16 markets. It ranks as the largest single-family rental real estate investment trust.
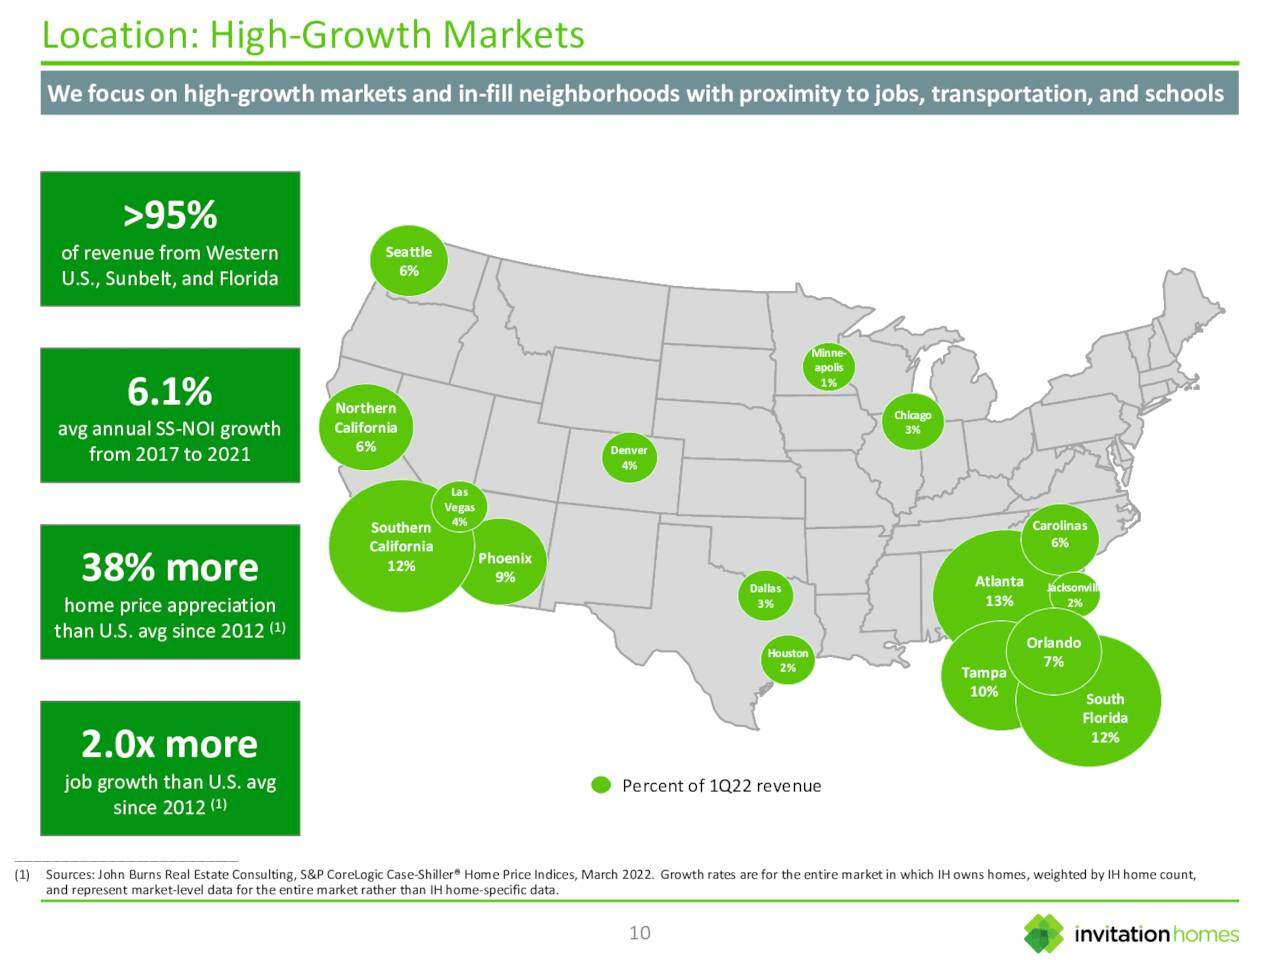
The bulk of Invitations properties are located in the Sunbelt. At the end of 2021, INVH derived 39% of total revenue from the Western U.S., 33% from Florida, 19% from the Southeastern U.S., 5% from Texas, and 4% from the Midwest.
On average, INVH has over 5,000 homes in each of its markets, and over 98% of the REIT’s revenues stem from markets in which INVH has over 1,800 properties.
The typical INVH rental is a three-bedroom, two-bath house just under 1,900 square feet in size.
The average annual income of new residents in INVH properties is over $134,000, and the average income to rent ratio as of Q1 of 2022 was 5.3x.
The REIT focuses on locations with strong job and population growth, high barriers to entry, and potential for strong home price appreciation.
Proof that the company accomplished the latter goal lies in the fact that since 2012, areas where Invitation’s properties are concentrated experienced 38% higher price appreciation than the U.S. average.
A Glance At Last Quarter’s Results
INVH provided Q2 2022 results in the last week of October. Core FFO per share of $0.42 was $0.01 below analysts’ estimates. Even so, it was up from $0.36 in Q2 2021.
Revenue of $568.7 million missed the consensus mark of $570.1 million; however, it was well above the $509.5 million reported in the year-ago quarter.
Same-store net operating income increased 8.6% year-over-year, well below the 12.4% year-over-year growth reported in Q2 2022.
The lackluster results were caused by an increase in same-store operating expenses of 7.6%, the largest increase in the company’s five year history. This was driven by inflation pushing repair and maintenance costs up by 15.4% and a 15.2% increase in turnover-related expenses.
The third quarter included net casualty losses to core FFO due to a $19 million accrual for estimated losses and damages related to Hurricane Ian.
Management cited an increase in property taxes due to rising home price appreciation as a negative factor weighing on results.
Management lowered guidance for FFO and revenue for FY 22. FFO per share is forecast in a range of $1.63 to $1.67, from the prior $1.66 to $1.72, and same-store core revenue growth is projected to increase 8.75% to 9.25%, versus the previous 9% to 10% range.
On a positive note, lease rates increased by 11.6%, and average occupancy stood at 97.5%.
Also, management estimates the current loss to lease at 10%. (Loss to lease is the difference between contractual rental rates and the current market rental rates. It represents a “loss” when market rents grow faster than rents from current contracts.)
Where The Rubber Meets The Road
Any investor worth his or her salt knows the housing market exploded following the COVID crisis. Housing prices increased 45% from December 2019 through June 2022. However, it may come as a surprise to many that the cost of owning a new home is now markedly higher than the cost of renting.
The following chart provides a picture of the cost of renting versus that of owning a home.
John Burns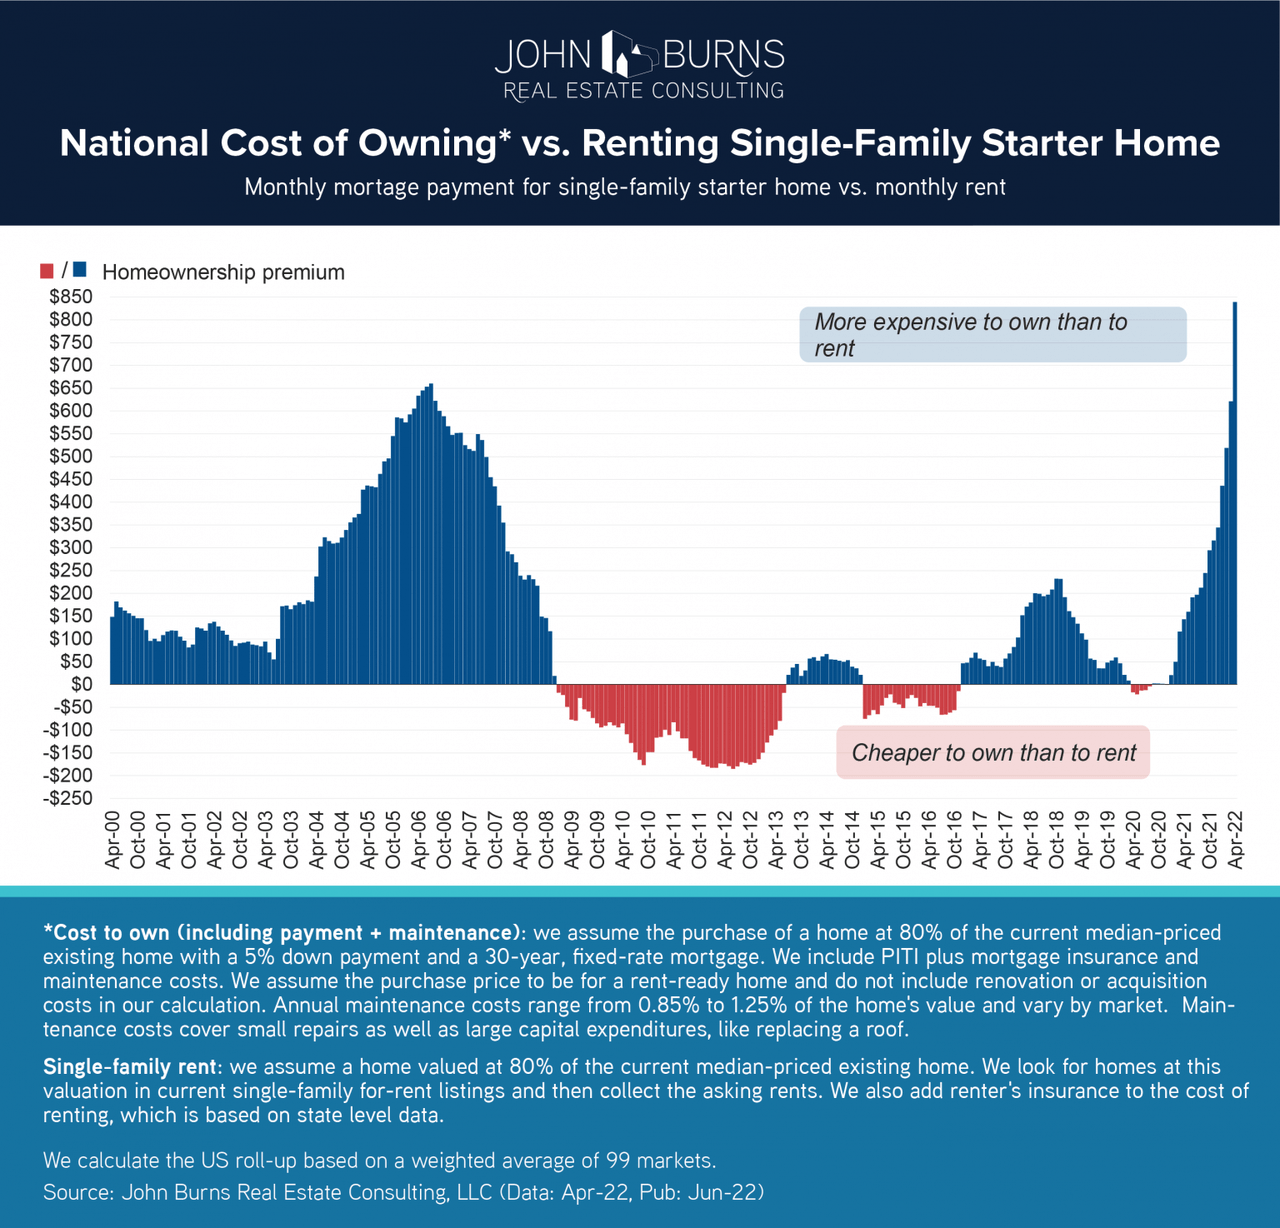
Now, owning a home costs $839 more per month than renting. This differential is almost $200 higher than at any time since the turn of the century.
Danielle Nguyen, senior research manager, John Burns
Of course, real estate demand varies widely from market to market. Here, though, is where INVH shines.
According to studies by real estate consulting firm John Burns, Raleigh-Durham, Nashville, Denver, Tampa, and Phoenix have the largest disparity in increasing homeownership costs versus that of renting.
Peruse the following graph listing the markets with the largest gap between the cost of renting versus owning, and compare that with the Invitation Homes chart of the REIT’s markets.
John Burns INVH 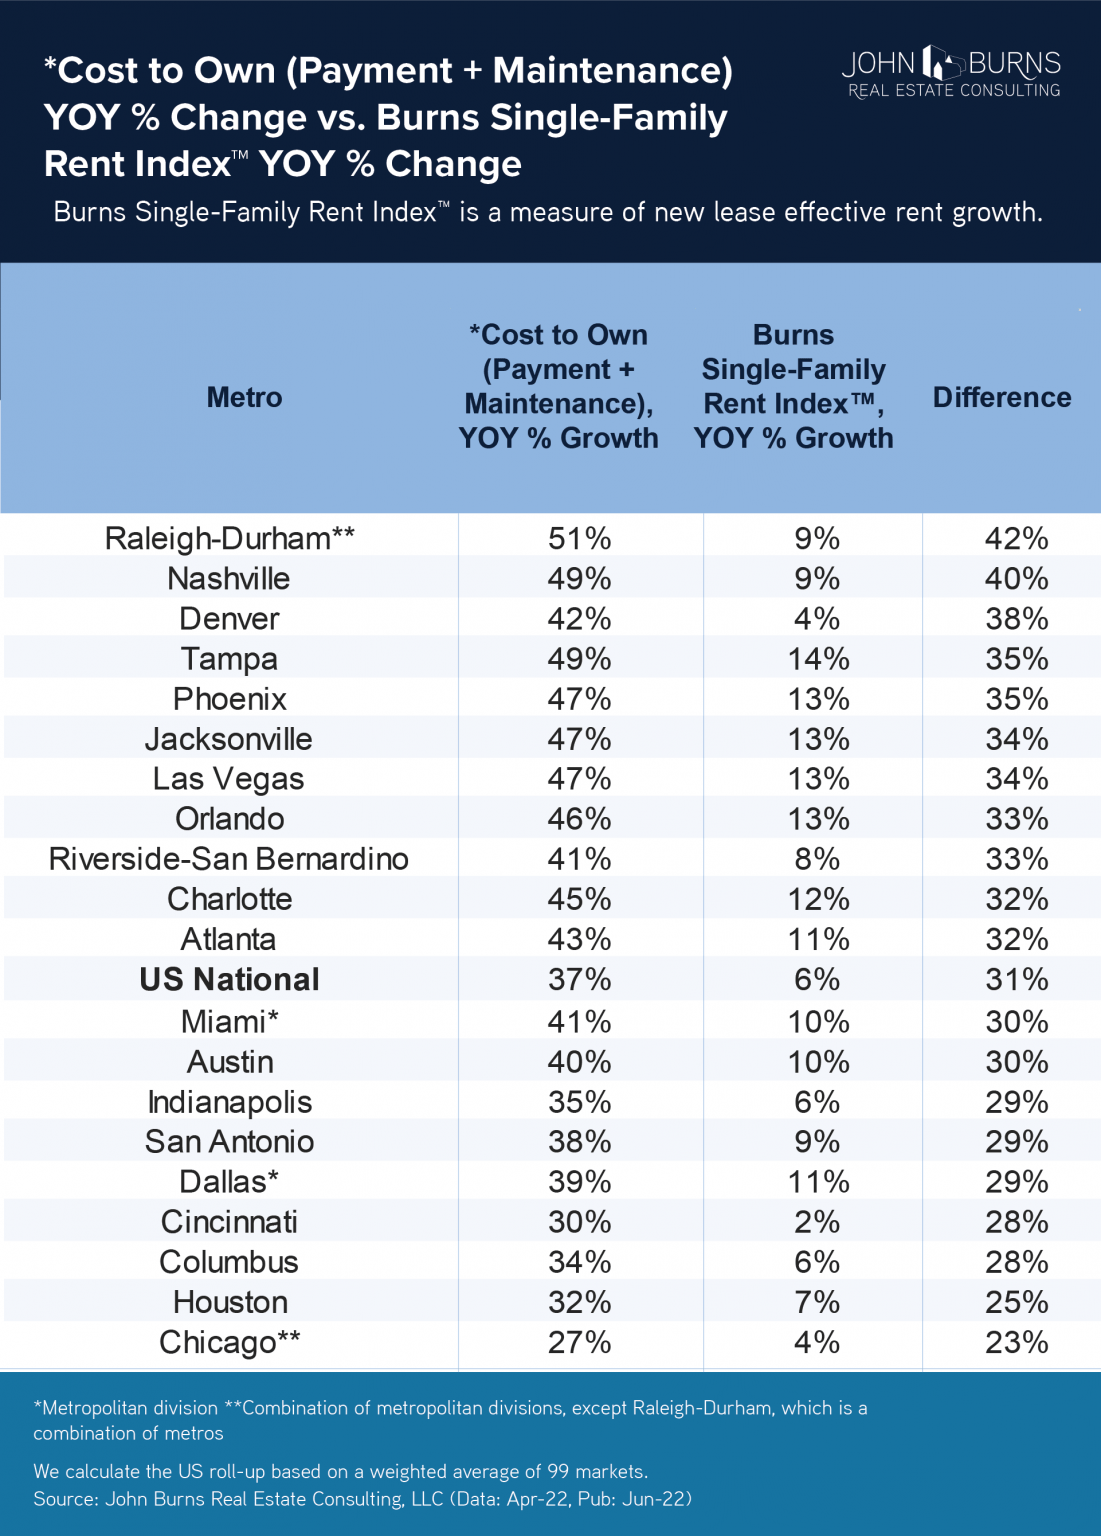
Note that Atlanta, Denver, Phoenix, Orlando, Las Vegas, and Tampa are all listed among the metro areas where the differential in the cost of owning compared to renting is above that of the national average. Now consider that those markets provide 47% of the Invitation Homes revenue.
Viewed from a slightly different perspective, a homeowner with a median U.S. family income must now budget 42% of their income to pay the average mortgage payment.
msn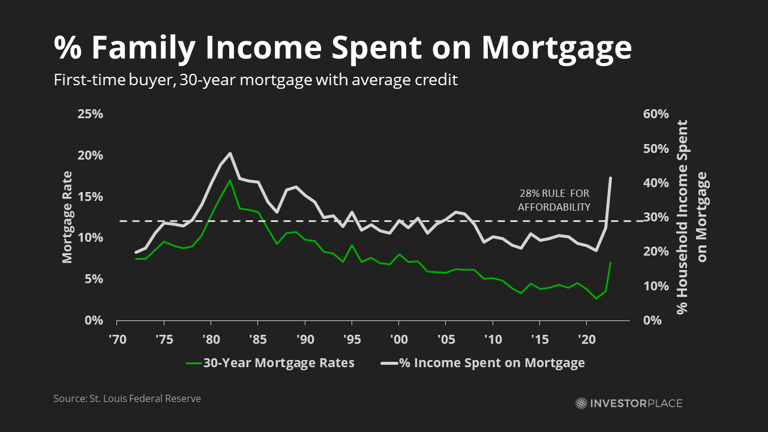
There are those that will pass this off as a transitory trend fueled by rising mortgage rates and a housing market that arguably appreciated at too rapid a pace; however, I would point to several secular trends that should support single family rentals for an extended period.
For one, the U.S. is suffering from an acute housing shortage. The most conservative estimate regarding the dearth in housing claims we are short two million homes.
On the other hand, a study by The National Association of REALTORS claims the U.S. has a supply shortfall of 5.5 million homes, and most estimates place the shortage of housing at a minimum of 3.8 million units.
Unfortunately, these stats only paint a partial picture of the magnitude of the problem faced by first time home buyers. That is because the shortage in overall housing does not take into account an acute shortage of entry-level homes.
In the early 80s, 40% of new construction consisted of entry-level homes. By 2020, the share of entry-level houses built by contractors had slipped to just 7% of new homes.
You can really draw a straight line from the 1940’s down to the most recent years… What was really striking to me was the consistency in the decline in the share of entry-level homes, irrespective of geography… It’s all over the US. It doesn’t matter where.”
Sam Khater, Chief Economist, Freddie Mac
This is occurring as 45 million Americans are in a demographic (ages 34 to 44) that defines the average first-time home buyer.
Furthermore, contractors are unlikely to increase the pace at which they construct entry level homes and for good reason.
According to a survey of the Associated General Contractors of America, 81% of contractors cite a shortage of skilled workers as a factor that increases building costs.
Now add ever increasing regulations and rising costs for land: the median price per acre of land upon which the average single-family home is built surged from $159,800 in 2012 to $203,200 in 2017. Weigh these input costs, and it is apparent that the price of a typical starter home does not provide reasonable profits for builders.
Homebuilding is our way out. However, there are many barriers, including higher land and labor costs, supply chain challenges, and rising regulatory fees.
Ali Wolf, Chief Economist, building consultancy firm Zonda
Moreover, the lack of housing supply is not the only trend that is INVH’s friend. As previously noted, the bulk of Invitation Homes markets are in Sun Belt states, and there is an enduring trend of Americans moving to those very states. Over the last decade, the Sun Belt recorded 75% of the total growth in the U.S. population.
The following graph illustrates the expected growth in the Sun Belt states over the next decade.
Clarion Partners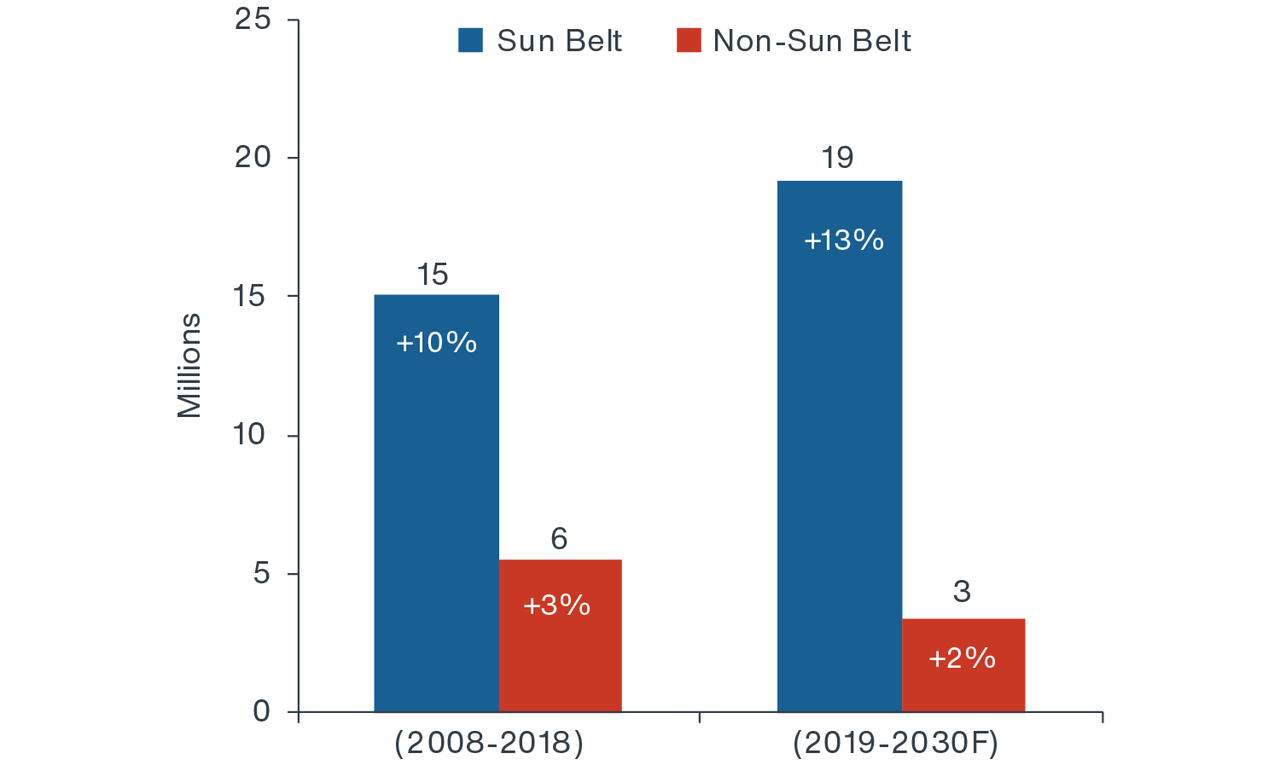
While sunny skies are beckoning folks to the Southern States, a surge in job formations also serves to draw emigrants to the Sun Belt. A study by Legg Mason shows the Sun Belt added 12 million jobs over the last decade versus 9 million for the rest of the U.S.
The following charts pinpoint the metro areas and states experiencing the greatest growth.
MATTHEWS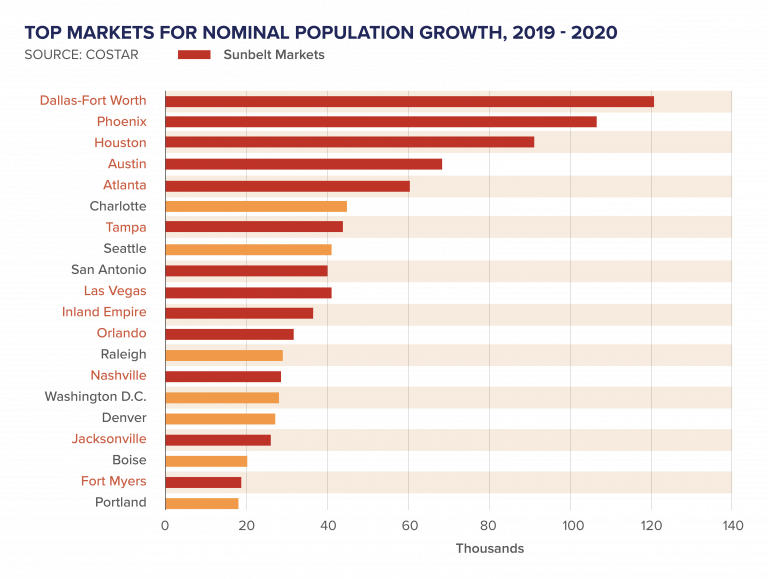
Once again, note that Dallas, Houston, Atlanta, Phoenix, Tampa, and Las Vegas are listed as the top ten metro areas experiencing rapid growth. Those cities are also markets in which INVH has a strong presence: 41% of the REIT’s total revenues are derived from those six markets.
That job growth and surge in population has led to a shortage of rental properties in the Sun Belt.
National Association of Home Builders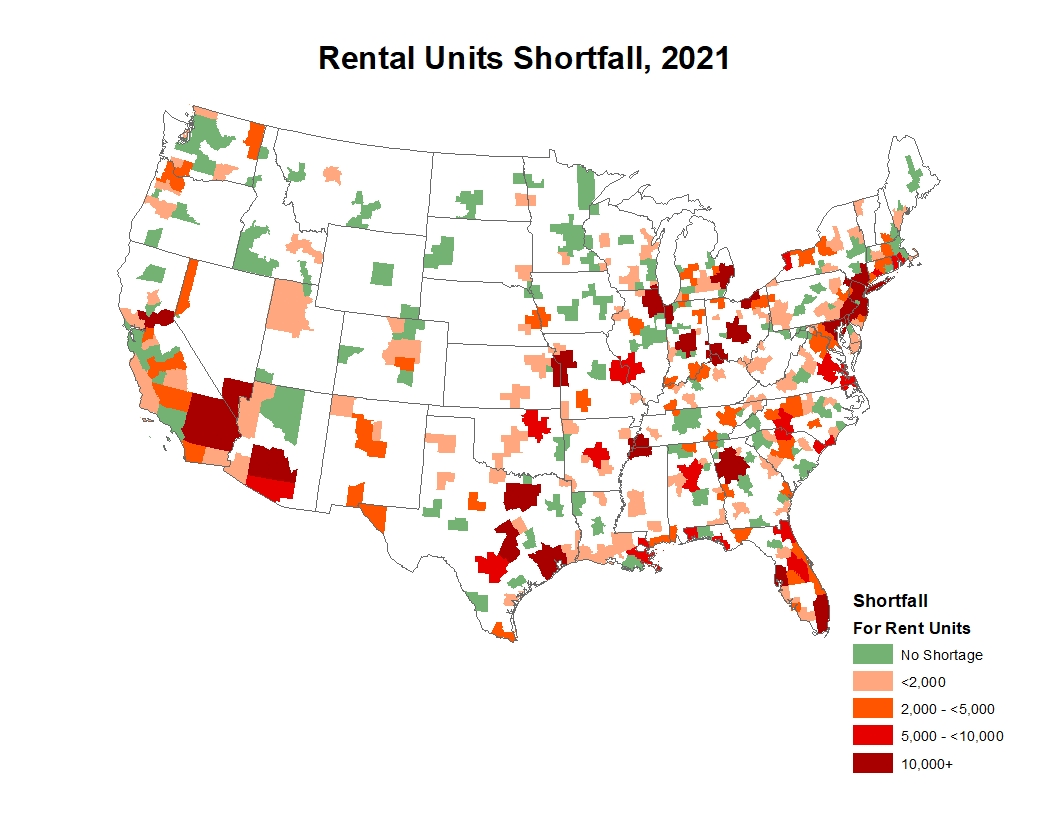
Now note Morningstar forecasts housing project starts will decrease 10% in 2023, followed by another 10% decline in 2024.
Debt, Dividend, And Valuation
INVH is rated BBB- by S&P, the lowest investment grade rating.
The company’s net debt-to-EBITDA ratio is 5.7x, with 99% of the REIT’s debt fixed or swapped to fixed, at a weighted average interest rate of 3.6%.
No debt is due until 2025. At the end of the Q3, the company’s liquidity totaled nearly $1.9 billion through a combination of unrestricted cash and undrawn capacity on a revolving credit facility.
The current yield is 2.94%, the AFFO payout ratio is a bit below 64%, and the 5-year dividend growth rate is 40.63%.
INVH trades for $29.90 per share. The average one year price target of the 16 analysts following the stock is $38.33.
The average price target of the 10 analysts that rated INVH following the last quarterly report is $36.30.
Is INVH A Buy, Sell, Or Hold?
The surge in home prices and increasing mortgage rates have priced many home buyers out of the market. Add to that a lack of entry-level housing, a slowdown in housing starts, and a surge in younger home buyers.
Furthermore, INVH is positioned to take advantage of enduring trends, particularly a shift of the U.S. population to the Sun Belt.
And last but not least, the cost of owning a home is now significantly higher than that of renting.
I struggled a bit with the stock’s current valuation. However, I weighed the REIT’s growth prospects, and I also took into account that the current yield is well above the average yield for every year in the company’s roughly half decade existence.
Weighing all of these factors, I rate INVH as a BUY.
I am not invested in INVH, but I will open a small position in the REIT when the market opens after the Christmas break.
Is This A Poison Pill For Investors?
I endeavor to provide information in each article that is not presented by other authors. My goal is to present negatives and positives for a stock in an unbiased way to assist readers in assessing a prospective investment.
I noted while perusing earnings calls that management claims clients rate the company as a “best in class resident experience.” However, when I researched customer reviews, I found a plethora of very poor ratings.
To replicate my research, simply search “invitation homes reviews.”
Digging a bit deeper, I found that as bad as the reviews are, they are significantly better than those of American Homes 4 Rent (AMH), the primary rival to INVH.
Although I consider this a strong negative, I believe the other factors I’ve presented in this piece outweigh the poor reviews. However, I present this information for your consideration.
Be the first to comment