

ogichobanov/iStock via Getty Images
Overview
In this series of articles, I will be reviewing Dividend Champions from a specific industry and selecting stocks as long-term buys, current holds, or stocks to avoid based on a variety of financial and valuation metrics. More information regarding the Dividend Champions list can be found here.
I believe that one of the best ways to improve is by looking back and reviewing your past work. Because of this for the first five articles of this series, I will be looking back at the prior articles I wrote on this subject five years ago. For Part 2, I will be looking at Dividend Champions from the Business Services industry (now named Commercial Services and Supplies in the current Dividend Champions listing). The related article from five years ago can be found here.
Prior Article Review
In the original article from 2017, there were 5 Business Services Dividend Champion stocks that I reviewed. Those stocks included:
- Automatic Data Processing (ADP)
- Brady (BRC)
- Cintas (CTAS)
- Jack Henry & Associates (JKHY)
- McGrath RentCorp (MGRC)
Based on the metrics I used to review the stocks, the top two scoring stocks were Jack Henry & Associates and Cintas. The two worst-scoring stocks were Brady and McGrath RentCorp. When looking at each stock’s total returns since the publication of the article, (similar to part 1) the scoring system performed well, but not as well as I would have liked to see.
Score Ranking vs Total Returns
In the table below, I am listing the 5 reviewed stocks in order of total returns since the original article publication five years ago and comparing that to the score ranking (1 is the highest, 5 lowest) it received at that time.
| Total Return since 2017 Article | Original Score Ranking | |
| Cintas | 184.70% | 2 |
| Automatic Data Processing | 122.00% | 3 |
| McGrath RentCorp | 118.10% | 5 |
| Jack Henry & Associates | 79.43% | 1 |
| Brady | 25.76% | 4 |
On the positive side of the results, my 2nd highest-scoring stock from the article, Cintas, has had the best performance in total returns since the publication of the 2017 article. Brady was the 2nd lowest-scoring stock from that article and has seen the lowest returns during this time period.
On the negative side, my highest-scoring stock, Jack Henry & Associates ranked fourth in terms of total returns. While my lowest-scoring stock, McGrath RentCorp performed better than expected based on its ranking, having the third-best returns during this time period.
Analyzing the Misses
In determining the rankings of the original article, I ranked each stock based on the following criteria: Revenue Growth, Earnings Growth, ROA, ROE, ROIC, Dividend Yield, PE Ratio, and Price to Book value.
Jack Henry & Associates
Similar to part 1 of this updated series of articles, I found that tweaking a few metrics would have provided more reliable results based on overall returns. For example, this stock ranked highest primarily due to top rankings in revenue/earnings growth and dividend growth. Shortening the time frame for revenue/earnings growth and weighing the dividend growth metric I believe would have improved overall results.
McGrath RentCorp
This stock score the lowest out of the five stocks and had very low rankings in terms of earnings growth and dividend growth, so the same updates to the metrics would have improved this ranking as well. McGrath also scored lowest in terms of ROA, ROE, and ROIC. While I don’t believe that these metrics need weighted, I do believe that adding additional metrics (detailed below) would have improved the overall results of this stock’s ranking as well as the other four.
Updating The Scoring System
I will be using a similar ranking system as I used 5 years ago with a few tweaks that I hope will only improve the results in terms of predicting future returns. Each of the metrics I outlined above will continue to be used; however, the following adjustments will be applied:
- Revenue/Earnings Growth – The time frame of these 2 metrics will be shortened from 5 years to 3 years to place more importance on recent growth
- Dividend Growth – This metric will be weighted so that its impact on the total score is reduced by 50%.
- PE Ratio – In the original article, I ranked the stocks based on the trailing PE ratio. For this new series of articles, I will be using its normalized PE ratio to help determine the company’s long-term value.
- Price to Book Value – This metric will be weighted in the same manner as dividend growth
In addition to these updates, I will be adding two additional metrics from YCharts to the rankings of these stocks:
- Fundamental Score – additional details on this score can be found here.
- Momentum Score – additional details on this score can be found here.
Stock Changes
As in the prior article, I will only be ranking Dividend Champion stocks. Out of the 5 reviewed from the original article, only 3 of those remain on the Dividend Champion stocks list (as of 9/30/2022) and they include:
However, three additional stocks have been added to the Dividend Champions list and they include:
The New Metrics
Revenue Growth
This chart shows the 6 stocks and their revenue growth over the past three years.
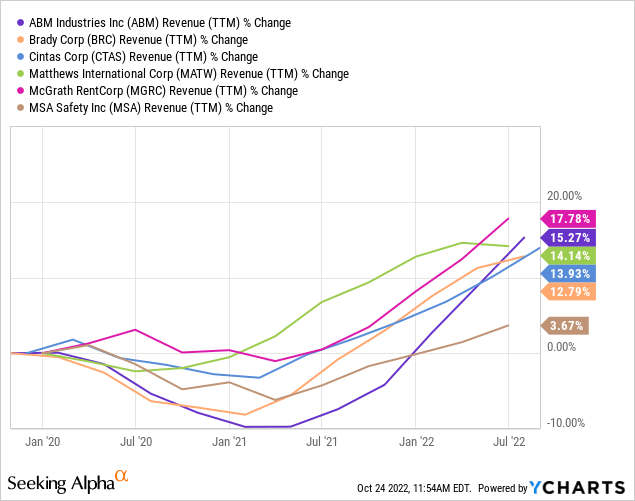
Looking at the chart, you can see that all six stocks have seen similar trends in terms of revenue growth during this time period. McGrath RentCorp has had the highest growth, while MSA Safety is really the only one of the six stocks to struggle with significant growth.
Earnings Growth
This chart shows the 6 stocks and their earnings growth over the past three years.
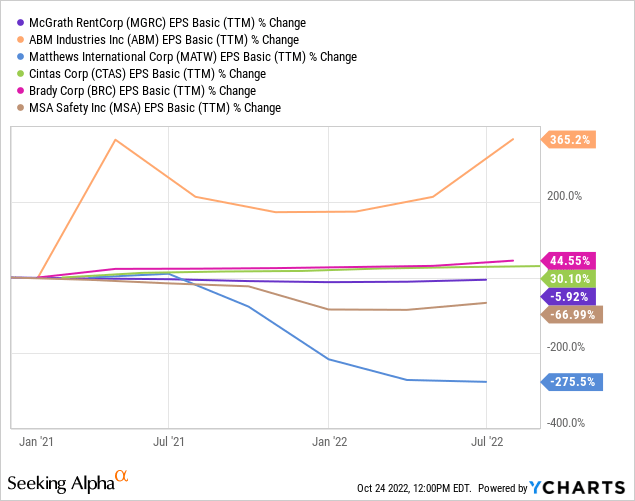
While revenue growth was fairly consistent between the six stocks, the opposite is true regarding earnings growth. ABM is on the top end of the spectrum with earnings growth of over 350% during this time period, while Matthews International is at the bottom end with a decline of earnings of 275% during the same time period.
Return on Assets
This chart shows the ROA values of the six stocks.
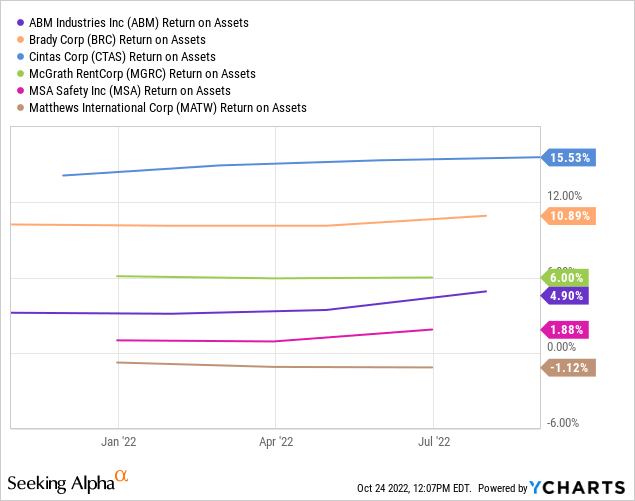
As you can see, Cintas has the highest ROA value while Matthews International is the only stock within the group to have a negative ROA value.
Return on Equity
This chart shows the ROE values of the six stocks.
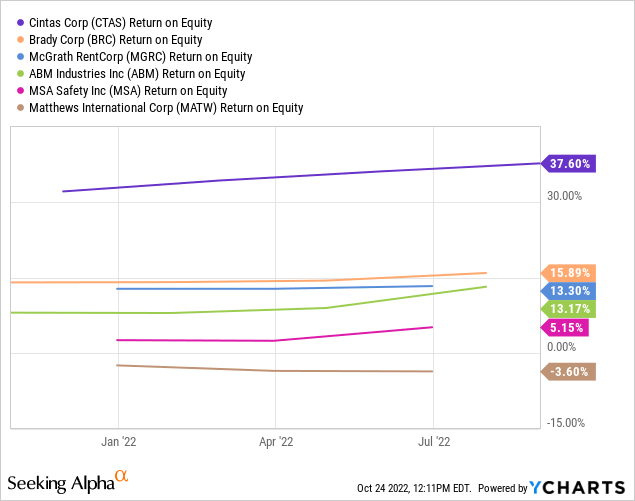
The ranking of ROE is the exact same as the ranking of ROA between these six stocks with Matthews International once again having the only negative value.
Return on Invested Capital
This chart shows the ROIC value of the six stocks.
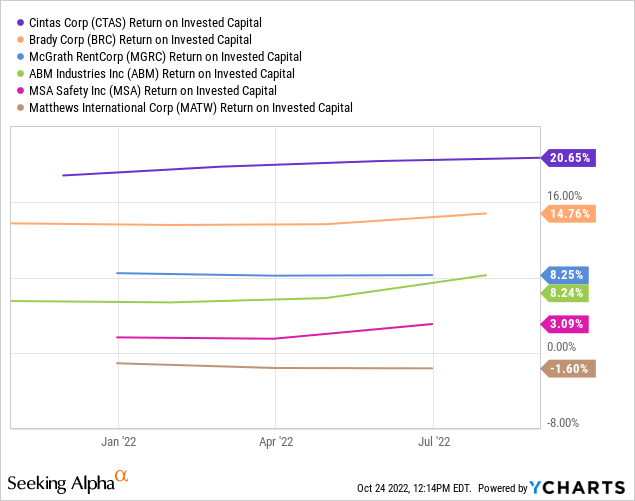
Unlike part 1 of this series in which the ROA, ROE, and ROIC rankings differed between the banking industry stocks, the ranking of these six stocks remains the same throughout with Matthews International having a negative return value for the third time.
Dividend Yield
This chart shows the dividend yield of the six stocks.
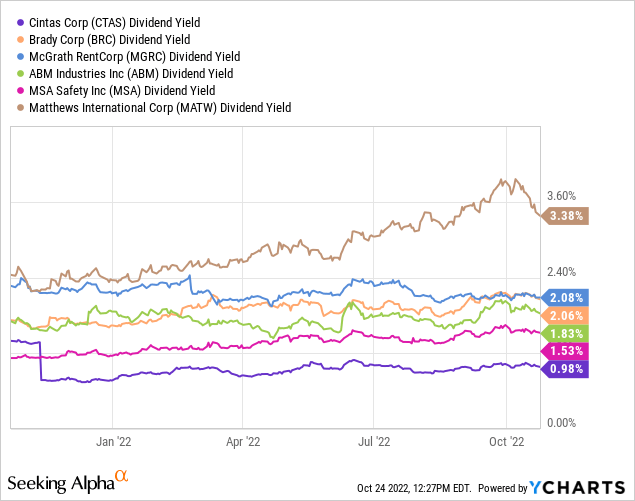
You can see from the chart that Matthews International is the only stock with a yield above 3% and Cintas is the only stock with a yield below 1%.
Dividend Growth
Below is the order of these stocks in terms of their 5-year dividend growth rate:
- Cintas – 24.64%
- McGrath RentCorp – 12.00%
- MSA Safety – 5.77%
- Matthews International – 5.29%
- ABM Industries – 2.78%
- Brady – 1.93%
Normalized P/E ratio
This chart shows the six stocks in terms of normalized P/E ratio.
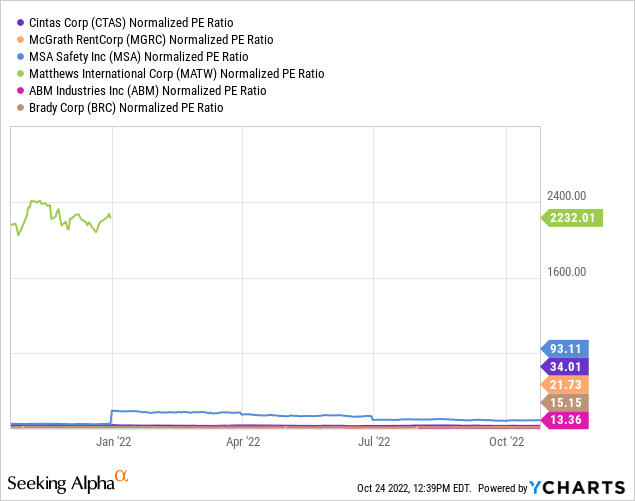
Based on the normalized P/E ratio, ABM Industries is the most attractively valued stock while Matthews International is the least attractively valued.
Price to Book Value
This chart shows the six stocks and their Price to Book Values.
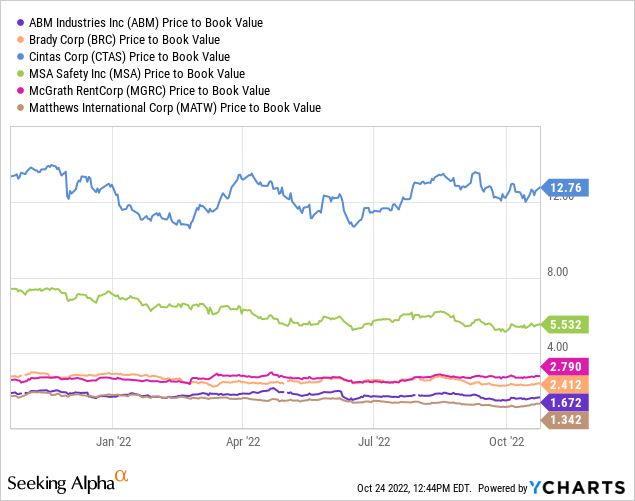
ABM Industries is once again the most attractively valued stock of the bunch based on Price to Book Value while Cintas comes in with the highest Price to Book Value.
Fundamental Score
In terms of Fundamental Score, two stocks have the highest available score of 10. Those two stocks are Cintas and McGrath RentCorp.
MSA Safety has a score of 9 and Brady has a score of 8.
Both ABM Industries and Matthews International have scores of 7.
Momentum Score
In terms of Momentum Scores, two stocks have a score of 9 (Cintas and McGrath RentCorp), two stocks have a score of 7 (Brady and ABM Industries), and two stocks have a score of 5 (MSA Safety and Matthews International).
Score Rankings
In the table below, you will see the 6 stocks sorted in terms of total overall scores. I used pretty much the same system I used in my prior articles with the few adjustments mentioned before. For example, the stock with the highest revenue growth will have a score of 6, while the stock with the lowest revenue growth will have a score of 1. These ranking scores are divided by two for both the Dividend Growth and Price to Book Value metrics. In addition, the two new metrics (Fundamental Score and Momentum Score) will not be scored based on ranking, instead, the actual scores will be added to each stock’s overall score to determine the rankings.
| Revenue Growth Ranking | Earnings Growth Ranking | ROA Ranking | ROE Ranking | ROIC Ranking | Dividend Yield Ranking | Dividend Growth Ranking | Normalized PE Ratio Ranking | Price to Book Value Ranking | Fundamental Score | Momentum Score | Total Score | ||
| CTAS | Cintas Corporation | 3 | 4 | 6 | 6 | 6 | 1 | 3 | 4 | 0.5 | 10.00 | 9 | 52.50 |
| MGRC | McGrath RentCorp | 6 | 3 | 4 | 4 | 4 | 5 | 2.5 | 2 | 1.5 | 10.00 | 9 | 51.00 |
| BRC | Brady Corporation | 2 | 5 | 5 | 5 | 5 | 4 | 0.5 | 5 | 2.5 | 8.00 | 7 | 49.00 |
| ABM | ABM Industries Incorporated | 5 | 6 | 3 | 3 | 3 | 3 | 1 | 6 | 3 | 7.00 | 7 | 47.00 |
| MSA | MSA Safety Incorporated | 1 | 2 | 2 | 2 | 2 | 2 | 2 | 3 | 1 | 9.00 | 5 | 31.00 |
| MATW | Matthews International Corporation | 4 | 1 | 1 | 1 | 1 | 6 | 1.5 | 1 | 2 | 7.00 | 5 | 30.50 |
Conclusion
The top 2 stocks
Looking at the table above, you can see that the two stocks with the highest overall scores include:
- Cintas – Total Score of 52.50
- McGrath RentCorp – Total Score of 51.00
Cintas was ranked 1st in ROA, ROE, and ROIC and was tied for the highest Fundamental and Momentum Scores. The only metric in which Cintas scored the lowest is Dividend Yield.
McGrath scored first in revenue growth and was tied with Cintas with the highest Fundamental and Momentum Scores. McGrath didn’t score last in any metric but was near the bottom when it came to the valuation metrics.
The bottom 2 stocks
The two lowest-scoring stocks include:
- MSA Safety – Total Score of 31.00
- Matthews International – Total Score of 30.50
MSA Safety ranked last in revenue growth, while Matthews International ranked last in earnings growth. Both stocks ranked in the bottom two across the ROA, ROE, and ROIC metrics, and both had the lowest Momentum Scores of 5.
The remaining 2 stocks
The remaining two stocks include:
- Brady Corporation – Total Score of 49
- ABM Industries – Total Score of 47
Looking at the scores of these two stocks compared to the top 2 and bottom 2 stocks, you can see that both Brady and ABM are closer to the top two stocks than they are to the bottom.
Final Thoughts
In terms of the bottom two stocks (MSA Safety and Matthews International), there is nothing about them that would cause me to select these stocks over the other four Dividend Champion stocks in this industry sector. Matthews International does have a decent dividend yield of over 3% but I don’t think that alone justifies holding this stock. MSA Safety doesn’t even have that, it’s yield is well under 2%, and considering its poor revenue/earnings growth, I think it should be avoided as well.
I feel that the other four stocks are all solid long-term investment options depending on the goals of the individual investor. While Cintas has the lowest dividend yield of these stocks, it also has the best dividend growth over the past five years. McGrath has had the highest revenue growth as well as the second-highest dividend yield and dividend growth.
ABM has had the highest earnings growth and appears to be the most attractively valued stock based on P/E ratio and Price to Book Value. Brady is also pretty solid all around ranking 2nd in 7 of the 12 metrics; however, in terms of total returns over the past five years, these two have underperformed compared to the other stocks in the list.
While I can’t predict with any certainty which one of these four stocks will have the best returns over the next five years, I do believe they will all perform well compared to overall market conditions and that they would make solid additions to any long-term portfolio. As always, I suggest individual investors perform their own research before making any financial decisions.
Be the first to comment