

natasaadzic
Investment Thesis
Last month, I suggested dividend investors add the iShares Core Dividend ETF (BATS:DIVB) to their watchlist. The reasons included an ultra-low 0.05% expense ratio, a modestly higher dividend compared to S&P 500 Index ETFs, and an attractive valuation and growth combination. However, shortly after my article was published, DIVB’s Index underwent an “exceptional” reconstitution that drastically changed its fundamentals for the worse. Therefore, I caution readers not to buy DIVB today and will suggest two other more suitable high-yield alternatives.
DIVB Overview
Strategy Discussion
DIVB tracks the Morningstar U.S. Dividend and Buyback Index, selecting securities based on total shareholder yield. Shareholder yield consists of a company’s twelve-month dividend yield and net buyback yield averaged over eight trailing quarters. Constituents must meet the following screens:
- be included in the Morningstar US Market Index, which represents approximately 97% of the investable market
- have a total shareholder yield above 0.1%
- have a total shareholder yield not in the top 5% of eligible securities
Avoiding companies within the top 5% of total shareholder yield is a new feature. In addition, the Index now includes securities that constitute 50% of the total shareholder payout dollars of the selection universe compared to 90% before. Constituents are still weighted based on total shareholder payout dollars and are subject to security and sector constraints, but these changes are significant. Today, 414 securities qualified compared to 339 before. However, gone are Apple (AAPL), Microsoft (MSFT), and Alphabet (GOOGL, GOOG), previously representing 11.30% of the portfolio. The Index also deleted Meta Platforms (META), Berkshire Hathaway (BRK.B), Visa (V), and UnitedHealth Group (UNH). That’s another 5.70% eliminated, making room for 243 new entrants with negligible weights between 0.002% and 0.21%. Below are the three steps in the selection process described in the Index Rulebook.
Morningstar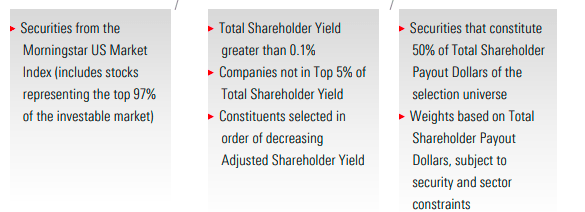
Sector Exposures and Key Holdings
I want to emphasize the impact of these seemingly minor changes. From a sector exposure perspective, DIVB is now 19% Financials and Technology and 9-10% Health Care, Industrials, Consumer Discretionary, Consumer Staples, and Energy. Overall, Technology exposure is 4% less as the new portfolio increased its exposure to semiconductor stocks at the expense of Systems Software, Tech Hardware, and Data Processing & Outsourced Services.
iShares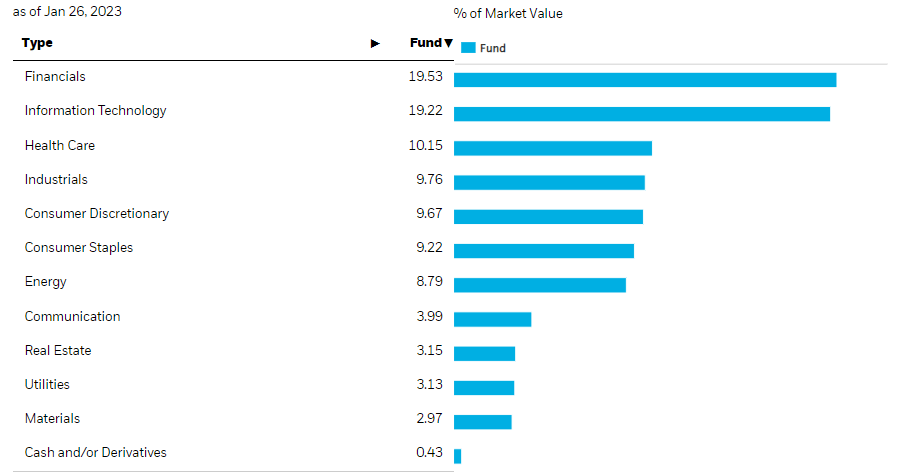
The top ten holdings total 25% of the portfolio. Oracle (ORCL), Broadcom (AVGO), and Exxon Mobil (XOM) are the top three, plus some low-beta securities included, like Procter & Gamble (PG) and Johnson & Johnson (JNJ).
iShares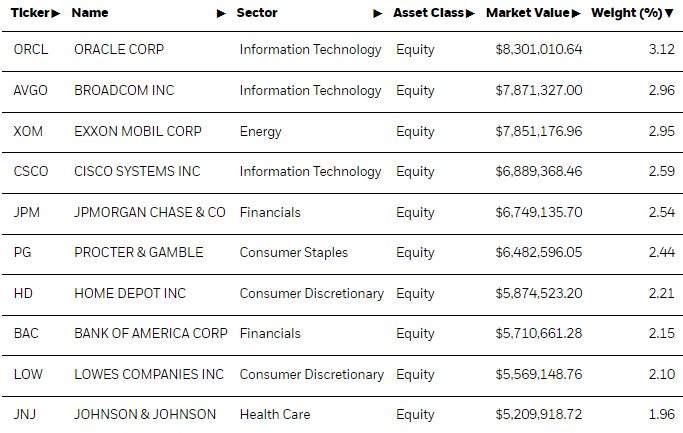
All these securities have dividend yields above 2%, except for Oracle. Its 1.43% dividend yield is aided by its previously-generous buyback program. In 2022, buybacks totaled $2.51 billion, or less than 10% of the $26.69 billion in 2021. Using eight quarters’ worth of data for buybacks may be well-intended, but this is one example of outdated information influencing the selections.
YCharts
Performance History
Since the selection process materially changed in December, historical performance metrics are not helpful. However, with that warning and to provide a complete analysis, consider how DIVB performed against the SPDR S&P 500 ETF (SPY), the Schwab U.S. Dividend Equity ETF (SCHD), and the Vanguard High Dividend Yield ETF (VYM). These are the three funds I will compare DIVB with fundamentally shortly.
Portfolio Visualizer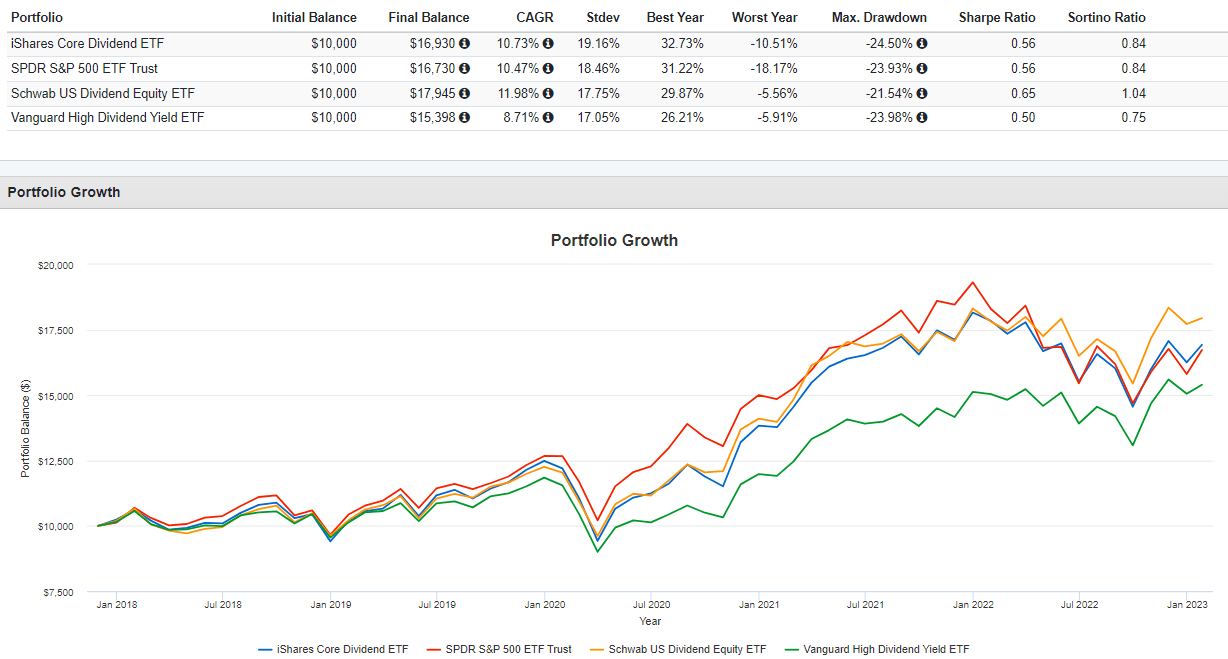
Overall, DIVB’s results were good, though one downside was slightly higher volatility and drawdown figures. Since December 2017, DIVB gained an annualized 10.73%, 0.26%, and 2.02% better than SPY and VYM but 1.25% worse than SCHD. On an annual basis, DIVB pad a relatively poor 2020 as “pandemic stocks” drove returns in higher-growth funds like SPY. However, DIVB recovered some of those losses last year, outperforming SPY by 7.66%.
Portfolio Visualizer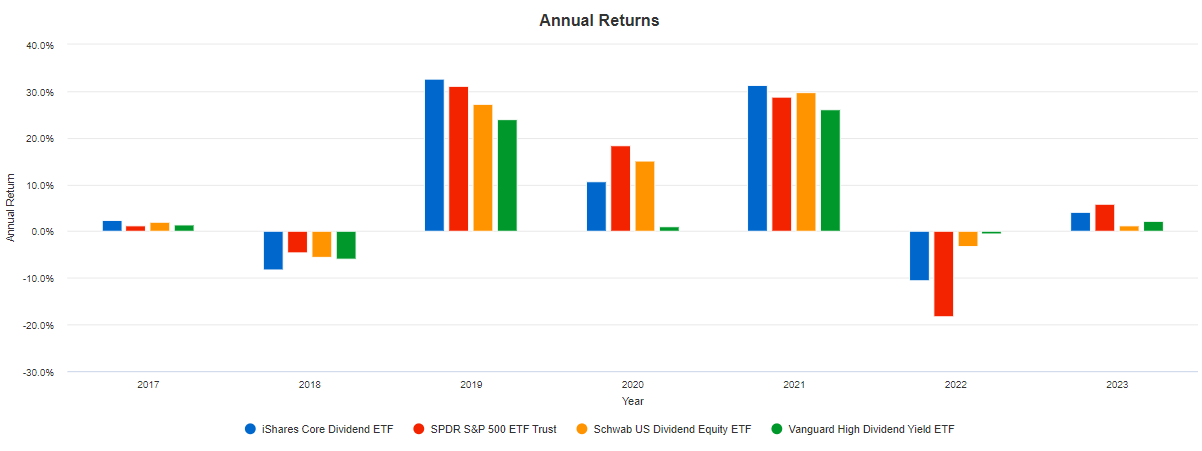
DIVB Analysis
Industry Fundamentals
Although DIVB has 414 holdings, 75.43% of the portfolio is covered by its top 25 industries. I’ve highlighted selected fundamentals in the following table, comparing DIVB with SCHD, VYM, and SPY.
The Sunday Investor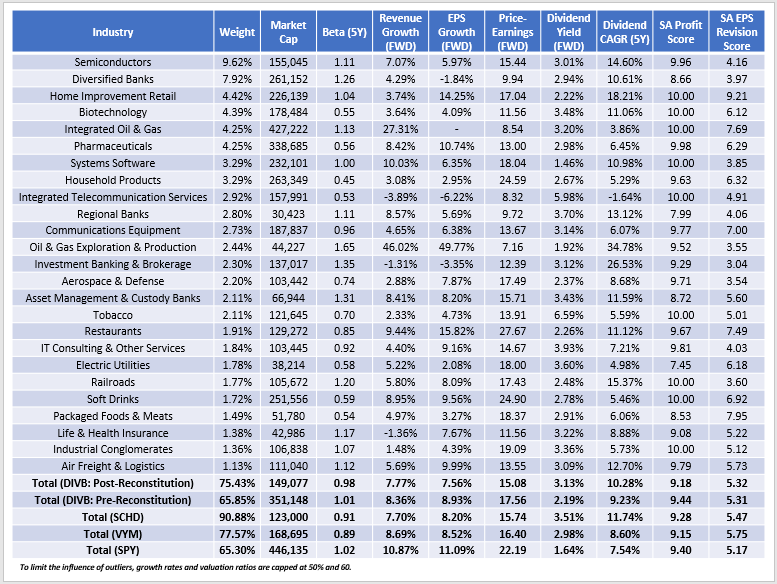
Concentration in these top 25 industries increased by about 10%, and the weighted-average market capitalization declined by about $200 billion after eliminating several mega-cap. The result is a portfolio better suited for income investors. DIVB’s gross dividend yield is 3.13% post-reconstitution, almost a point higher, and constituents have a 10.28% five-year dividend growth rate. The portfolio beta remains similar at 0.98 vs. 1.01 pre-reconstitution.
In a recent article, I criticized SCHD for its low 8.20% estimated earnings growth metrics, but DIVB pushes even further to just 7.56%. There are two contributing factors. First, the new portfolio is simply a lower-growth one. DIVB pre-reconstitution had an 8.93% estimated growth rate, a 1.37% drop. However, earnings growth rates for nearly all U.S. equities have sharply fallen over the last month as year-over-year comparisons normalize. Here are the most significant declines affecting DIVB since my December review.
- Wells Fargo & Co. (WFC): 132.41% to 2.34%
- Citigroup (C): 11.84% to -11.91%
- Bank of America (BAC): 25.29% to 1.77%
- JPMorgan Chase (JPM): 13.03% to -4.02%
- Texas Instruments (TXN): 9.91% to 0.79%
- Johnson & Johnson (JNJ): 8.91% to 3.42%
- Verizon Communications (VZ): 1.28% to -3.84%
- Union Pacific (UNP): 13.14% to 8.34%
- Morgan Stanley (MS): 5.32% to 1.13%
- Pfizer (PFE): 29.51% to 27.12%
Earnings expectations for Diversified Banks aren’t as strong as before, and it’s DIVB’s second-largest industry exposure area at 7.92%. Furthermore, the industry’s 3.97/10 weighted-average EPS Revision Score, derived from individual Seeking Alpha Factor Grades, is well below average. The Invesco KBW Bank ETF (KBWB) has outperformed SPY by about 4% YTD, but I’ve found the EPS Revision Score to be a good leading indicator, suggesting it’s not prudent to overweight them. Generally, rising interest rates benefit banks as their net interest margins expand, but rates likely won’t increase much more this year. The CME FedWatch Tool indicates a target rate range between 425-475 basis points in December 2023, which should pressure banks’ profits.
CME Group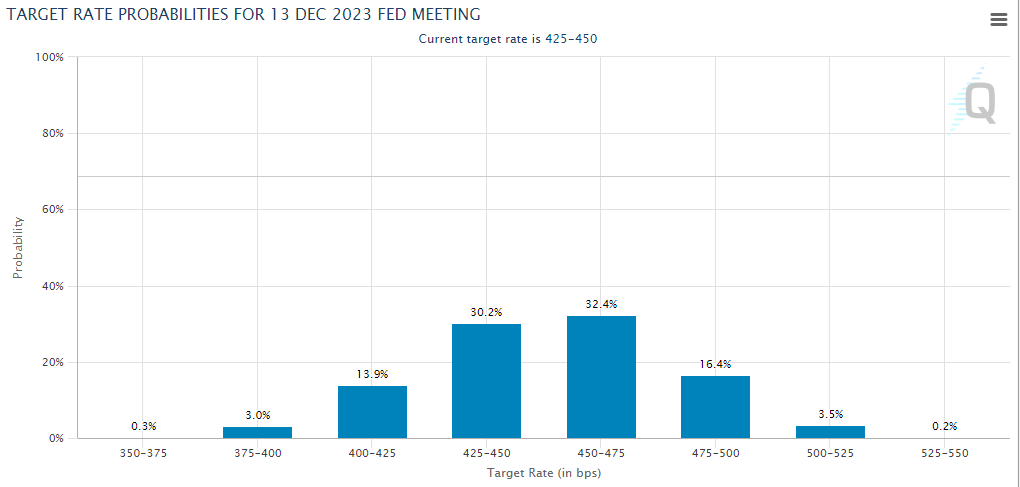
Dividends: DIVB Now Competes With High-Yield ETFs
Since DIVB’s estimated dividend yield climbed about 1%, it’s now a direct competitor to SCHD and VYM. It’s a tough category to compete in, and DIVB’s fundamentals aren’t as strong. A couple of points:
1. High-dividend ETFs typically have a defensive component to them. DIVB’s 0.98 five-year beta is too high and won’t offer much downside protection.
2. DIVB’s 3.13% gross dividend yield is 0.38% less than SCHD’s. Furthermore, its constituents’ five-year dividend growth rate is 1.46% less. SCHD still wins the dividend battle.
3. DIVB has a lower Profitability Score than SCHD (9.18/10 vs. 9.28/10), an unfortunate change from its 9.44/10 score pre-reconstitution. I liked that feature, and although the score is still excellent, it doesn’t stand out anymore.
4. VYM has an edge on earnings momentum based on its 5.75/10 EPS Revision Score, while DIVB has the lowest of the three dividend ETFs at 5.32/10.
Investment Recommendation
DIVB’s constituents radically changed in December, driven by two changes to the Index methodology. The top 5% of components based on shareholder yield are now removed, and the Index only represents the top 50% of total shareholder yield payout dollars compared to 90% before. Several mega-cap stocks were removed, making way for hundreds of smaller companies with negligible weightings. Even though the holdings count increased by 75, concentration in the top 25 industries jumped by 10%.
Income investors will likely cheer these changes, as DIVB’s estimated dividend yield is 1% higher at 3.08% after expenses. However, DIVB now competes with high-dividend ETFs like SCHD and VYM, which are superior. SCHD has the advantage on dividend yield, growth, and profitability, while VYM is the least volatile of the three and has the best earnings momentum. To be clear, DIVB’s 15.08x forward earnings valuation and 0.05% expense ratio are excellent features, but it’s too much of a low-growth ETF, and I suspect it will substantially underperform in a bull market. Therefore, I want to clarify that I don’t recommend buying DIVB at this time, and I look forward to discussing this further in the comments section below.
Be the first to comment