

Sometimes it can be difficult to really understand the popularity of certain companies, especially when you don’t partake in the services they provide. My fiancé recently gave me a better understanding of The Walt Disney Company (DIS) and I am not talking about their financials. The popularity of Disney is really a memory from my childhood but with the addition of Disney+, it has become an everyday reality with a library of shows that are streamed directly to the TV in our living room.
The first thing investors need to be aware of with Disney is that they are playing the long game and that any temporary setbacks are nothing more than buying opportunities. Even with a record-breaking year of movie releases ($11.1 billion at the box offices worldwide), significant park traffic, and an incredible Disney+ launch the stock is currently available at a price that has not been seen in nearly a year.
Although DIS doesn’t fit the normal company we look for in John and Jane’s portfolio, we feel it is reasonable to overlook its shortcomings because the long-term positives really emphasize why we are interested in Disney.
I believe there are two negatives when talking about Disney in the context of John and Jane’s portfolio and both of them are related to the dividend. First, the dividend yield is lower than we would normally like to see (even though it is currently higher than it has been historically) and the second being that Disney only pays its dividend on a semi-annual basis, which means that it is the only stock in the Taxable account that does not pay a dividend on a quarterly or monthly basis. In my opinion, the dividend yield is the biggest negative while the semi-annual dividend payments can be easily overlooked.
The most compelling component of Disney dividend history is that the company recently moved to become a Dividend Contender which means that the stock has paid increased dividends for at least 10 consecutive years. When we consider this it is also important to remember that the payout ratio sits at 33% which means that there is plenty of room for Disney to handle reduced earnings from situations like the coronavirus and to also increase the dividend payment annually by around 6-8%.
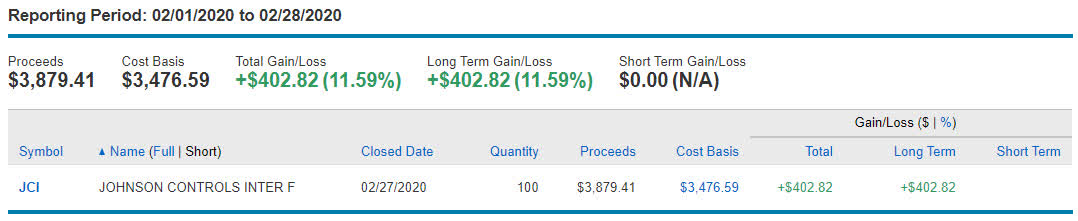
To add Disney came as we eliminated Johnson Controls (JCI) after they failed to provide any dividend growth in 2018 and 2019. We were continuing to let JCI ride prior to the market whirlwind but no dividend growth in 2018 and 2019 gave strong reason to put this company of the chopping block which John and Jane to replenish capital.
Client Background
John and Jane are two real people who asked me to help manage their retirement portfolios. It is important to understand that I am not a financial adviser and merely provide guidance for my clients’ accounts based on a friendship that goes back several years. I call them my clients for simplicity’s sake, but I do not charge them for what I do. The only request I made to them was that they allow me to anonymously write about them so that I can potentially help others who are wanting to achieve the same thing.
John retired in January of 2018 and is collecting social security along with other benefits while Jane is still working with aspirations of retiring in the next year. John and Jane have done an excellent job heading into retirement because they currently have no debt or mandatory monthly obligations other than what is expected (such as property taxes, water, etc.)
John and Jane have adopted my philosophy of focusing on cash flow from investments instead of drawing out large sums of money by selling shares of currently held investments. In a nutshell, what John and Jane want is a portfolio of stocks, bonds, and other investments that will provide a steady stream of growing and consistent dividend income that will supplement their income during retirement. At some point, it will be necessary for John and Jane to sell shares from their Traditional IRA, whereas the goal of the Taxable and Roth IRA is that they will never need to sell any shares (unless they want to) because the income generated will prevent them from needing to sell shares as a means of “funding their retirement.”
Here are some important characteristics to keep in mind about the Taxable Portfolio:
- Capital appreciation is the least important characteristic of this portfolio. This doesn’t mean we don’t care about it (because all investors do to some degree), but it does mean that we are less concerned about the day-to-day fluctuations of stock prices. Since the goal is to never sell (although I make occasional changes by eliminating or adding positions), a focus on capital appreciation doesn’t mean a lot when it comes to the game plan.
- In the past year, I have typically focused on stocks that paid a qualified dividend because they qualify for the lower long-term capital gains tax rate vs. ordinary dividends which are taxed as ordinary income. This has become less important now that 2018 was John’s first year of retirement. Changes in the tax brackets also support this approach because the ranges have been expanded and include basically all of their income in the 22% bracket. (Qualified dividends are subject to a 15% tax so the difference has become less-important).
Dividend And Distribution Increases
A total of three companies paid increased dividends/distributions or a special dividend during the month of February in the Taxable account and includes the following:
- Enterprise Production Partners (EPD)
- Hormel Foods (HRL)
- Realty Income (O)
- Phillips 66 Partners (PSXP)
- AT&T (T)
- Westlake Chemical Partners (WLKP)
Enterprise Production Partners – EPD continues to demonstrate that it is built to last based on strong fundamentals including 1.70x distributable cash flow coverage (DCF) or a payout ratio of 59%. Currently, EPD carries an investment-grade S&P Credit Rating of BBB+ and has continued to grow the distribution quarterly (62 consecutive quarters) and has a long-term track record of 21 consecutive years of distribution increases. At this point, investors should be very well aware that management has no intention of losing its distribution streak as it nears the coveted title of dividend champion in 2024. EPD shares closed at a price of $22.42/share or a price/operational cash flow ratio of 7.42x (which is well below the 10 year average of 13.02x). We plan on adding additional shares of EPD to the Taxable portfolio at some point over the next several days now that the stock is selling at a multiple that has not been seen since the Great Recession.
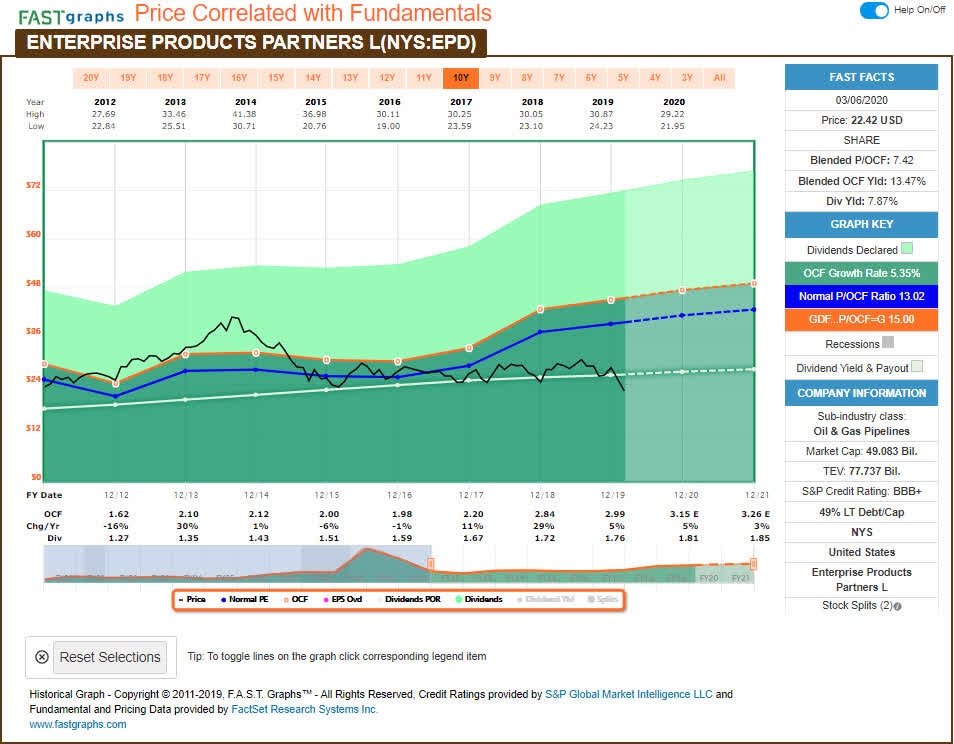 The distribution was increased from $.4425/share per quarter to $.445/share per quarter. This represents an increase of .6% and a new full-year payout of $1.78/share compared with the previous $1.77/share. This results in a current yield of 7.94% based on a share price of $22.42.
Hormel Foods – Like most stocks, HRL has taken a hit over the last few weeks, although it now looks like it’s a safe haven for investors who have begun redirecting cash towards safer consumer staples stocks. Other SeekingAlpha authors have noted that HRL’s current valuation is too pricey (and is an opinion that I happen to agree with) which is why I would not consider adding any shares until the price drops below $36/share or a P/E ratio of 20x. This dividend increase marks HRL’s 53rd year of consecutive dividend increases.
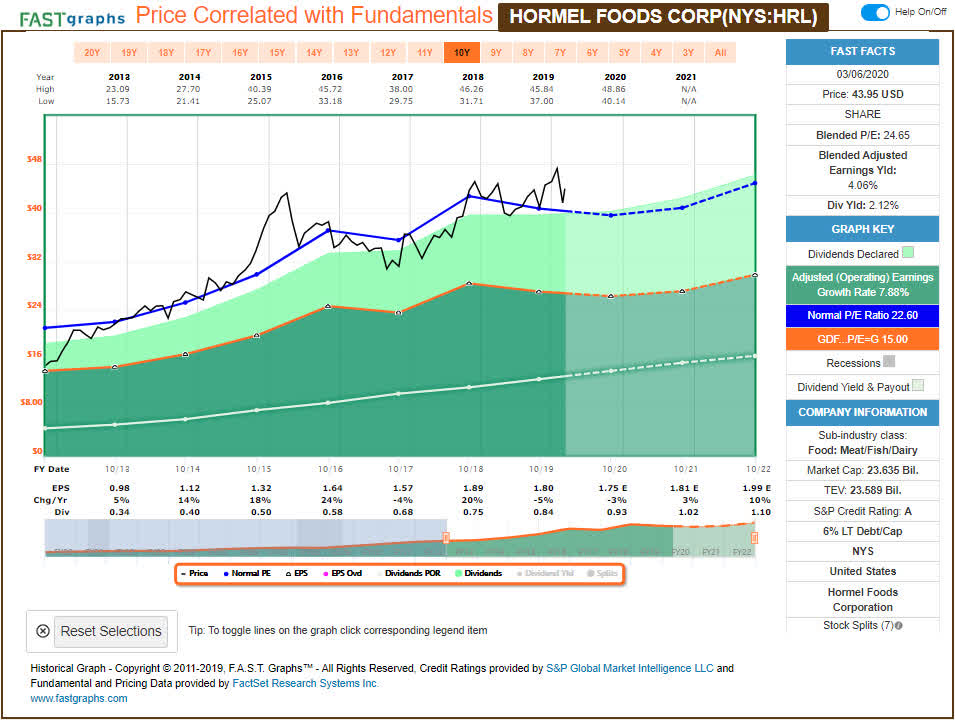 The dividend was increased from $.21/share per quarter to $.2325/share per quarter. This represents an increase of 10.7% and a new full-year payout of $.93/share compared with the previous $.84/share. This results in a current yield of 2.12% based on a share price of $43.95.
Realty Income – Normally, doing updates on stocks that have increased their dividends is really exciting, however, I never thought that Realty Income could increase its dividend so regularly that I would literally run out of things to talk about for this dividend champion. Realty Income increases the dividend on its common shares quarterly (January, April, July, October) but has always assigned its large increase during the month of February. Realty Income currently has a valuation that is so high it would seem ridiculous for investors to continue purchasing shares. Even management knows that the stock is richly valued which is why they recently closed on a 9 million share common stock offering at a price of $77.40 per share.
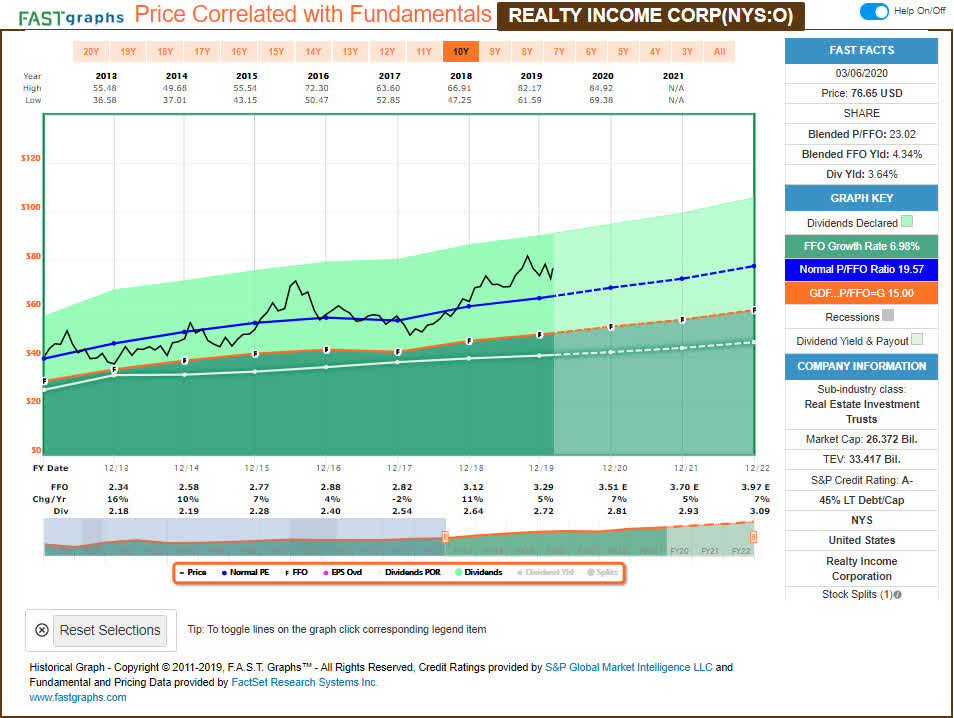 The dividend was increased from $.2275/share per month to $.2325/share per month. This represents an increase of 2.2% and a new full-year payout of $2.79/share compared with the previous $2.73/share. This results in a current yield of 3.64% based on a share price of $76.65.
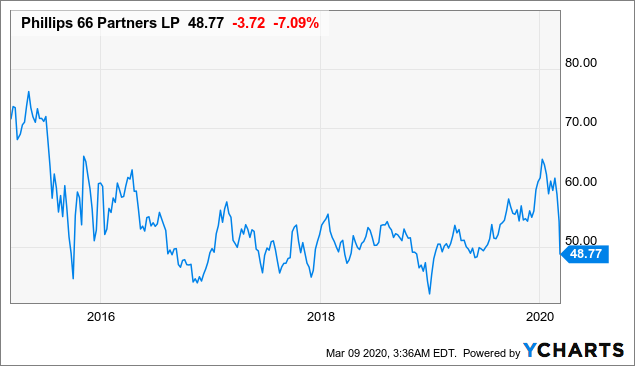
Phillips 66 Partners – PSXP has tumbled from a share price of almost $62/share nearly 3 weeks ago down to its current price of $48.77/share. In my article The Retirees’ Dividend Portfolio – John And Jane’s November Taxable Account Update: Large Expenditures In Retirement I discussed price support at around $54/share (which obviously no longer holds true) and I would say that investors who are interested in PSXP should consider any price below $50/share to be an attractive entry point.
 Data by YCharts
The distribution was increased from $.865/share per quarter to $.875/share per quarter. This represents an increase of 1.2% and a new full-year payout of $3.50/share compared with the previous $3.46/share. This results in a current yield of 7.18% based on a share price of $48.77.
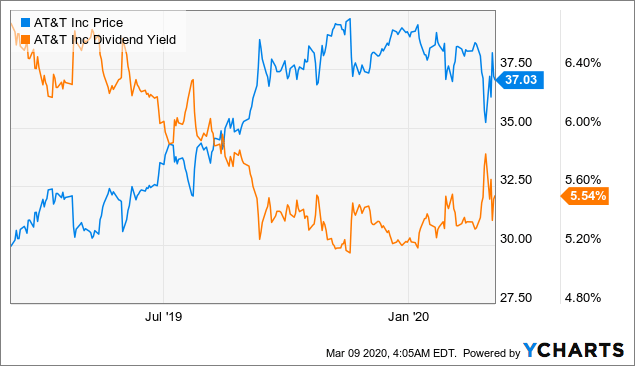
AT&T – Amid all of the bad news lately, AT&T was able to affirm guidance and announced an accelerated share buyback program for a total of $4 billion or the equivalent of more than 108 million shares at the current price of $37.03/share. AT&T has a poor history of making financially prudent decisions that resulted in lackluster returns for its investors but the Time Warner (TWX) purchase appears to be one of the better decisions the company could’ve made. AT&T currently trades at a P/E ratio of 10.35x which is well below its 10-year average P/E ratio of 13.07x. We would consider adding to John and Jane’s position in the event that AT&T’s share price drops below $33/share.
 Data by YCharts
The dividend was increased from $.51/share per quarter to $.52/share per quarter. This represents an increase of 2% and a new full-year payout of $2.08/share compared with the previous $2.04/share. This results in a current yield of 5.62% based on a share price of $37.03.
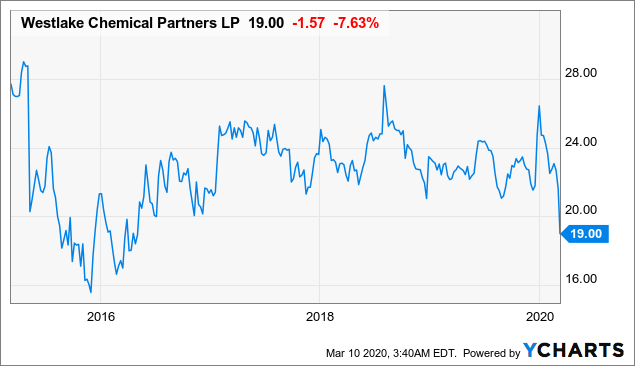
Westlake Chemical Partners – Another quarter goes by and WLKP raises its distribution again making it the 20th consecutive quarterly distribution increase. For those who are unfamiliar with the name the safety WLKP provides is in its 95% take-or-pay agreement that protects the partnership from margin volatility. Like many other stocks, WLKP looks extremely attractive having crossed the $20/share price which hasn’t been seen since October 2016.
 Data by YCharts
WLKP’s distribution was increased from $.4646/share per quarter to $.4714/share per quarter. This represents an increase of 1.5% and a new full-year payout of $1.89/share compared with the previous $1.86/share. This results in a current yield of 9.92% based on a share price of $19.00.
Positions
The Taxable account currently consists of 44 unique positions as of market close on March 9th, 2020. Stock market volatility at the end of February created a buying opportunity for a number of stocks in John and Jane’s Taxable portfolio (which is why there were a number of small purchases we chose to capitalize on). As you will note, some of these positions were jumped on too quickly and are now available for purchase than the price we paid for them.
- Simon Property Group (SPG) – 10 Shares @ $133.45/share.
- Exxon Mobil (XOM) – 25 Shares @ $60.83/share.
- Ryder System (R) – 10 Shares @ $47.00/share.
- EPR Properties (EPR) – 10 Shares @ $69.02/share.
- Schlumberger (SLB) – 25 Shares @ $33.03/share.
- VF Corporation (VFC) – 10 Shares @ $79.02/share.
- EPR – 25 Shares @ $63.96/share.
- Old Republic International (ORI) – 25 Shares @ $21.29/share.
- Archer Daniels Midland – (ADM) – 50 Shares @ $40.18/share.
- Walt Disney Company (DIS) – 10 Shares @ $119.58/share.
- ORI – 125 Shares @ $20.85/share.
- Apple REIT (APLE) – 50 Shares @ $13.30/share.
- EPR – 15 Shares @ $56.19/share.
- DIS – 5 Shares @ $114.79/share.
- McDonald’s (MCD) – 5 Shares @ $189.95/share.
We sold shares of the following stocks during the month of October.
- Johnson Controls (JCI) – 100 Shares @ $38.79/share.
 Source: Charles Schwab
We sold out of JCI in both the Taxable account and Jane’s Retirement account primarily because the stock has never been a core holding and the lack of a dividend increase even as the merged company has become more successful is disappointing. We used the opportunity to pick up Disney which looks attractive at these levels and has a strong growth potential going forward given their investments in film and Disney+.
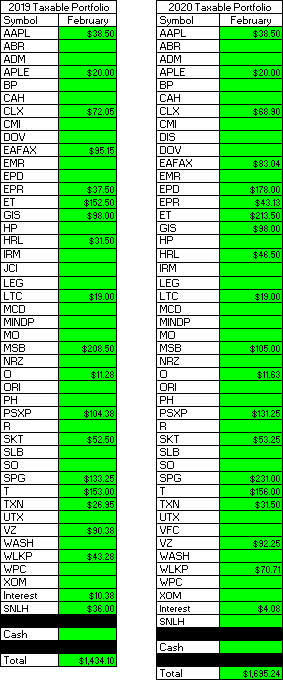
February Income Tracker – 2019 Vs. 2020
Income for the month of February was up modestly year-over-year and should see an income boost over the next several months as the shares purchased begin to deliver their dividends. We added to quite a few positions during the month of February (specifically towards the end of February) as many stocks have reached their 52-week-low.
SNLH = Stocks No Longer Held – Dividends in this row represent the dividends collected on stocks that are no longer held in that portfolio. We still count the dividend income that comes from stocks no longer held in the portfolio even though it is non-recurring.
Source: Consistent Dividend Investor, LLC.
Here is a graphical illustration of the dividends received on a monthly basis. I have begun updating the chart to also reflect the dividends earned in 2018, 2019, and 2020.
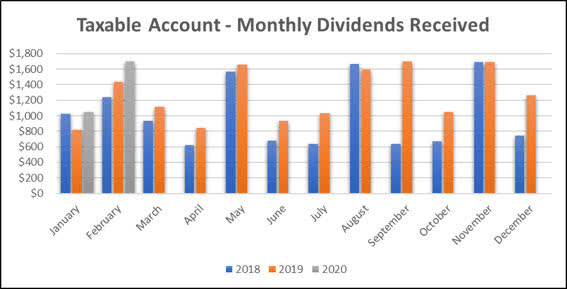
Source: Consistent Dividend Investor, LLC.
I am experimenting with new charts that give a different perspective on the dividend income received. I expect that these charts will provide more value as the dividend updates for 2020 start to take shape. Let me know if you have any suggestions in the comments about potential graphs and/or tables that you believe would add more value.
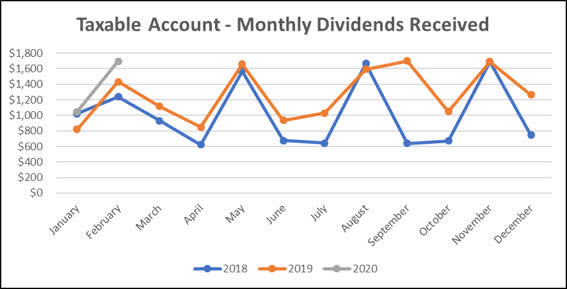 Source: Consistent Dividend Investor, LLC.
Going forward, I expect that the dividend income trend will more closely resemble the orange line (with the total dollar amount of dividends generated being slightly higher than it). The blue line has more peaks and valleys in it due to the fact that not all capital had been invested by the end of 2018.
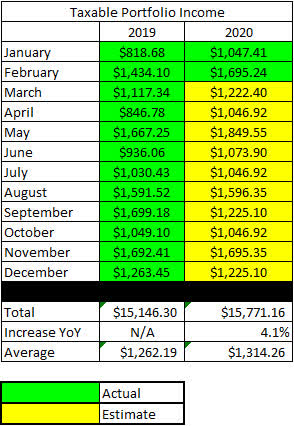
Based on the current knowledge I have regarding dividend payments and share count, the following table is a basic prediction of the income we expect the Taxable Portfolio to generate in 2020 compared with the actual results from 2019. This table will continue to be updated as the year goes on with the actual amount of dividends earned in a specific month which will also include any dividend raises that have not been announced (yet) and will also reflect the income generated by additional purchases. This table will also reflect the decrease in dividend income in the event there is a dividend cut and/or we reduce exposure to a position. As a general rule, we do not typically sell out of positions in the Taxable account and therefore it is unlikely that we will see a dividend decrease because of this.
 Source: Consistent Dividend Investor, LLC.
**Please note that my dividend income during the month of February and 2019 was originally stated as $1555.20 when in fact, it was actually $1434.10. A slight adjustment was also made to the dividend income in the month of May because the income generated was $10 higher than the previously stated dividend income of $1657.60.
Like many investors out there, John and Jane’s Taxable portfolio saw its account balance dropped significantly in the last week of February (and continued to drop through the first week of March). As a result of market volatility, account balances were down nearly $32k from the end of January to the end of February.
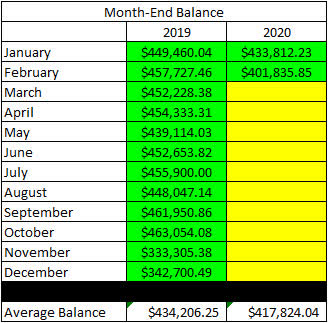 Source: Consistent Dividend Investor, LLC.
In an effort to be transparent about John and Jane’s Taxable account I like to include an unrealized Gain/Loss summary. The numbers used are based on the closing prices from March 9, 2020.
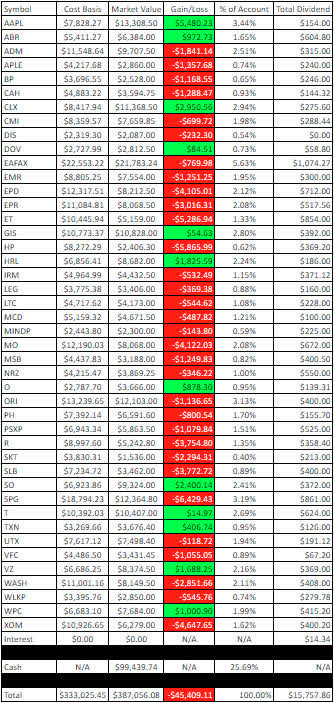
Source: Consistent Dividend Investor, LLC.
In the February 2019 Taxable account update, John and Jane were sitting on unrealized capital gains of $8,316.63 and are currently sitting on unrealized capital losses of -$45,409.11. The figures used in the image above are accurate as of March 9th, 2020.
Conclusion
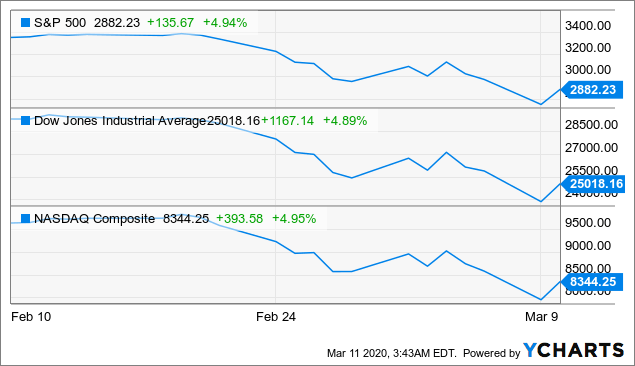
Market volatility has been pretty incredible because of the sheer magnitude of the day-to-day drops/increases in the major indexes.
 Data by YCharts
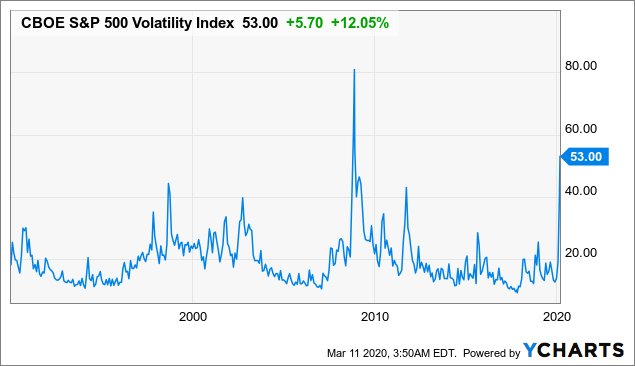
As a response, we are seeing nearly every major central bank around the world cutting interest rates and at least exploring some form of stimulus in an attempt to calm the markets. For those who have read my work before, it is well-known that I am a big believer in the value of the VIX index that acts as a fear index for the market.
 Data by YCharts
The VIX provides some interesting insight into market volatility.
- The VIX index rarely exceeds 40 and other than the financial crisis (2008), a score above 40 doesn’t last long.
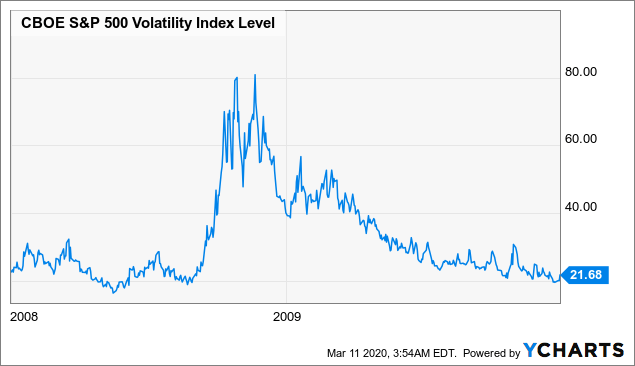
- The chart below gives a magnified look at the VIX from January 1, 2008, two January 1, 2010. During this time we can see that the VIX continued to exceed a score of 40 for somewhere between 6-9 months in total.
 Data by YCharts
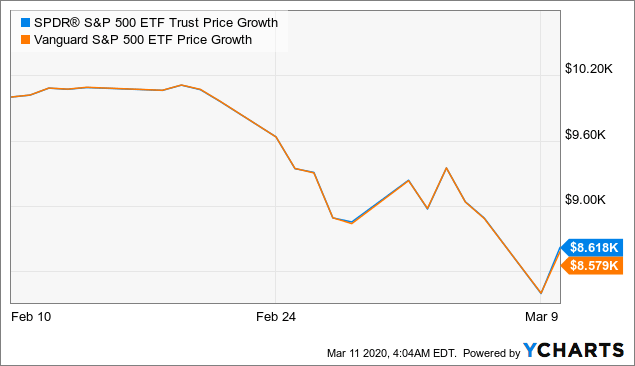
The point of all of this is that volatility is temporary and even during circumstances like the 2008 financial crisis, investor uncertainty was largely subdued and pushed into remission in a matter of months. It is my opinion that the current situation we’re in is largely overhyped (specifically when talking about the coronavirus). I have mentioned in previous articles that I expect things will get worse before it gets better which means that dividend investors need to remind themselves that it is situations like this that demonstrate why this type of strategy alleviates the stress created by major drops in the market.
The chart below regarding the S&P 500 hits the point home that investors who are heavily dependent on capital appreciation have seen 14% of their wealth destroyed in just the last month alone. The chart below represents the growth of $10,000 over the last month for the SPDR S&P 500 ETF Trust (SPY) and the Vanguard S&P 500 ETF (VOO).
 Data by YCharts
Those who have prudently saved and retained a modest cash reserve should see the current market as an opportunity to purchase stocks at prices near the 52-week-low. While we should expect some impact on most companies’ earnings because of the coronavirus, I do not believe the hit will have a profound effect on most companies.
For those who have previously followed my work, they should remember that I try to do a makeover for these articles at the beginning of each year and most of the changes come from those who read and comment on my articles. I have already made a few changes but would love to hear feedback on any additional changes that would create more value for those who read my work.
What does your dividend growth portfolio look like? I’d love to hear feedback on your personal strategy and potential stocks you think I should consider.
In John and Jane’s Taxable account, they are currently long the following mentioned in this article: Apple (AAPL), Arbor Realty (ABR), Archer-Daniels-Midland (ADM), Apple REIT (APLE), BP (BP), Cardinal Health (CAH), Clorox (CLX), Cummins (CMI), The Walt Disney Company (DIS), Dover Corporation (DOV), Eaton Vance Floating-Rate Advantage Fund A (EAFAX), Emerson Electric (EMR), Enterprise Product Partners (EPD), EPR Properties (EPR), Energy Transfer (ET), General Mills (GIS), Helmerich & Payne (HP), Hormel (HRL), Iron Mountain (IRM), LTC Properties (LTC), Leggett & Platt (LEG), McDonald’s (MCD), Mitcham Industries Preferred Series A (MINDP), Altria (MO), Mesabi Trust (MSB), New Residential (NRZ), Realty Income (O), Old Republic International (ORI), Parker-Hannifin (PH), Phillips 66 Partners (PSXP), Ryder Corporation (R), Tanger Factory Outlet Centers (SKT), Schlumberger (SLB), Southern Corp. (SO), Simon Property Group (SPG), AT&T (T), Texas Instruments (TXN), United Technologies (UTX), VF Corporation (VFC), Verizon (VZ), Washington Trust (WASH), Westlake Chemical (WLKP), W. P. Carey (WPC), and Exxon Mobil (XOM).
Disclosure: I am/we are long ADM, APLE, EMR, EPR, MCD, T, TXN, VFC. I wrote this article myself, and it expresses my own opinions. I am not receiving compensation for it (other than from Seeking Alpha). I have no business relationship with any company whose stock is mentioned in this article.
Editor’s Note: This article covers one or more microcap stocks. Please be aware of the risks associated with these stocks.
Be the first to comment