

Brett_Hondow
It’s been a tough year for restaurants and especially for investors in restaurant stocks, with the index suffering a more than 35% drawdown from its 2021 highs at its summer lows. However, the AdvisorShares Restaurant ETF (EATZ) has recovered nicely since, up 13% last month and more than 17% off its lows. This can partially be attributed to the pullback in gas prices, which provided relief in at least one area for consumers amid a year of shrinking discretionary budgets. Unfortunately, while many quick-service names are trading near their highs, Dine Brands (NYSE:DIN) hasn’t seen nearly as impressive of a recovery.
In fact, Dine Brands is still down over 30% from its pre-COVID highs and 5% for the year, outperforming many of the weaker casual dining names, but trailing quick-service leaders like McDonald’s (MCD) and Restaurant Brands International (QSR). While this underperformance relative to trade-down beneficiaries makes sense, Dine Brands is well-positioned within the casual dining category, benefiting from affordability relative to most concepts and seeing less impact on earnings from inflationary pressures due to its fully-franchised model. So, while casual dining names may not be out of the woods completely, I continue to see Dine Brands as a solid buy-the-dip candidate.
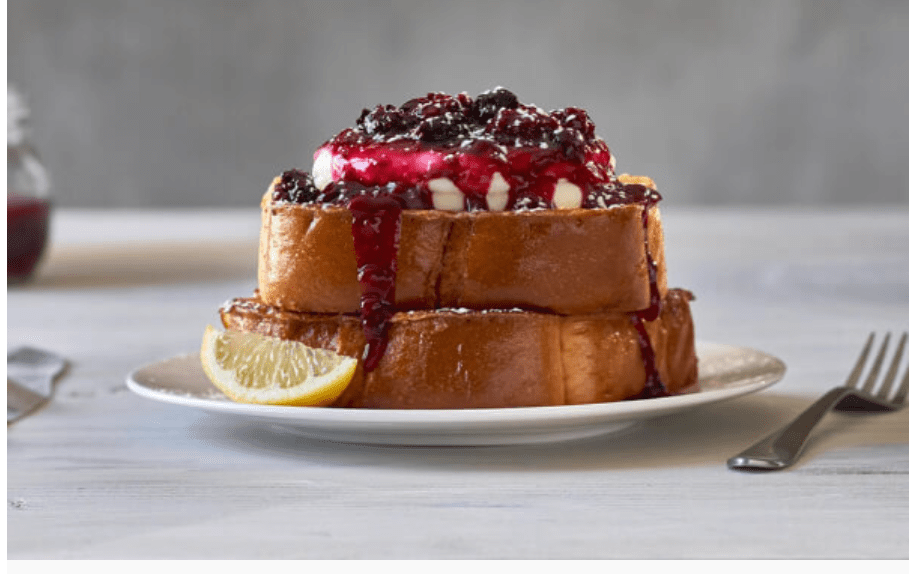
Thick N’ Fluffy Fresh Toast – IHOP Menu (Company Website)
Q3 Results
Dine Brands released its Q3 results earlier this month, reporting quarterly revenue of $233.2 million, a 2% increase from the year-ago period. The higher revenue was driven by positive comparable restaurant sales at its two brands (IHOP and Applebee’s), with IHOP reporting same-restaurant sales growth of 1.9%, and Applebee’s reporting same-restaurant sales growth of 3.8%, translating to a 16.9% increase on a three-year basis (relative to Q3 2019 pre-COVID). While the positive same-restaurant sales figures certainly outperformed laggards like Red Robin (RRGB) at just ~6.0% comp sales growth in the same period (Q3 2022 vs. Q3 2019), same-restaurant sales growth severely lagged pricing of ~7% (Applebee’s) and ~11% (IHOP) on a year-over-year basis.
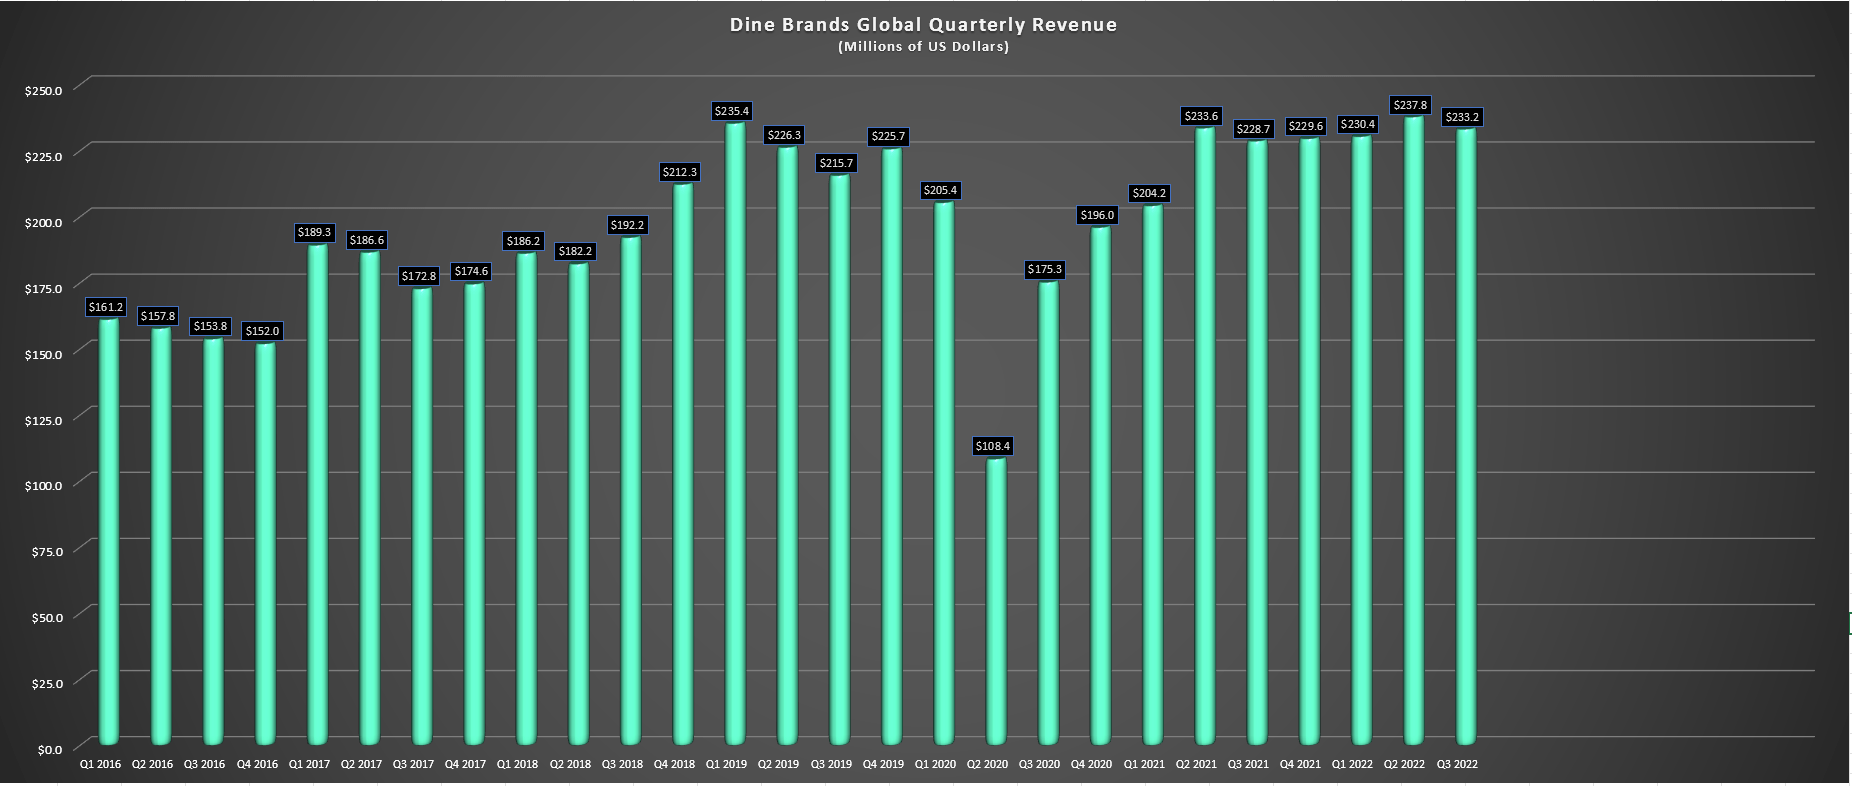
Dine Brands – Quarterly Revenue (Company Filings, Author’s Chart)
Although this may appear disappointing, it’s important to note that Q3 was a rough quarter for the industry. Black Box Intelligence reported a 4.6% decline in traffic in Q3, and September was the seventh consecutive month of declining traffic. This should not be any surprise given the current state of affairs, with dwindling personal savings rates, weakening consumer confidence, and many diners having to stare down higher menu prices each time they head out to treat themselves. So, while Applebee’s numbers could have been better, the industry has been up against considerable headwinds. Meanwhile, in the case of IHOP, the company is still working to get more restaurants back to a 24/7 or 24/2 basis.
Digging into the results a little closer, IHOP is still on track to see low single-digit unit growth for the year (35-45 net new openings), though the company has had to reel in its previous estimates of 50-65 net new openings due to permitting/construction delays. On the positive side, its International Bank of Pancakes loyalty program (ability to earn “Pan-coins” with every order and trade them for free food) is tracking ahead of its goal of 2.5 million members for the year, boasting 3.3 million sign-ups year-to-date. Finally, the company has seen a continued improvement in restaurants offering 24/2 or 24/7 hours, and its virtual brands are helping to provide incremental sales in these late-night hours (Thrilled Cheese & Super Mega Dilla).
Moving to Applebee’s, the company continues to see a nice lift from off-premise sales, translating to per restaurant average weekly sales of ~$12,800. The stickiness of off-premise sales has prompted the company to continue opening drive-thru windows, with its 10th opened thus far. While the company is expected to see negative net new openings on a year-over-year basis in a continued trend of portfolio optimization, its remaining restaurant base continues to see steadily growing average unit volumes, which have improved from $2.6 million at year-end 2021 to ~$2.75 million despite the industry-wide headwinds. Meanwhile, the company hopes to return to a trend of net new openings by 2024. It is worth noting that while it will see net new closures for FY2022, this is the fewest amount of Applebee’s closures in a decade.
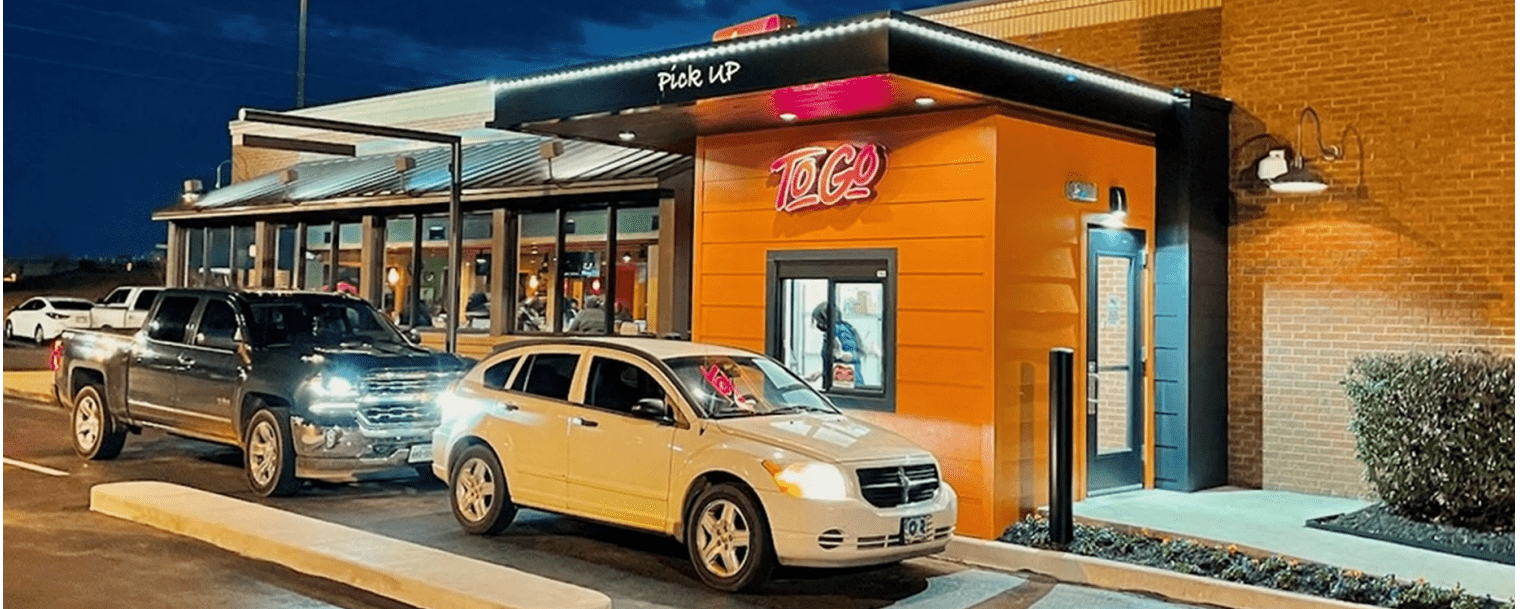
Applebee’s To-Go Windows (Company Presentation)
Subsequent to quarter-end, Applebee’s sold its 69 company-owned restaurants in the Carolinas to existing franchisee Thrive Franchise Group, returning the company to a 100% franchised model, a significant differentiator vs. most casual dining peers. Meanwhile, the company took advantage of continued share price weakness in the quarter and year-to-date, buying back ~141,000 shares at ~$67.40, and ~$114 million in shares year-to-date, representing one of the largest buy backs for any company on a year-to-date basis (9% of float). I see this as a smart move given that this weakness looks temporary and it’s nice to see the company buying back shares in an opportunistic manner at attractive valuations levels vs. unloading on share buybacks at unfavorable levels like Zumiez (ZUMZ).
Overall, Dine Brands Q3 performance was solid when adjusting for the clear headwinds and while consumers remain under pressure, both brands continue to offer value and rank highly from an affordability standpoint with a barbell strategy that allows for premium items, but also value items to ensure they’re not pricing less affluent customers out of casual dining. Applebee’s President John Cywinski noted that franchisees have been taking a delicate balance between covering margins and maintaining Applebee’s leading affordability, which is exactly what investors want to see given that the combination of consistent food, great service and affordability is what’s essential to the long-term thesis.
Industry-Wide Trends
Moving to industry-wide trends, there’s no secret that it’s been a very tough operating environment, and as noted by Black Box, traffic was down nearly 5.0% in Q3, with September traffic down 3.6% year-over-year, erasing much of the recovery in August. The lower traffic can be attributed to rising gas, grocery, mortgage/rent, and utility costs, though the pullback in gas prices has certainly helped. The problem is that with personal savings rates at multi-decade lows, equity prices well off their highs and housing prices teetering, the reverse wealth effect is in full force, and consumers are feeling a lot less rich. The result is that they’re likely to drop a restaurant visit that they might have otherwise made in a normal year or instead of skipping a visit, they may choose to trade down to avoid breaking the bank.
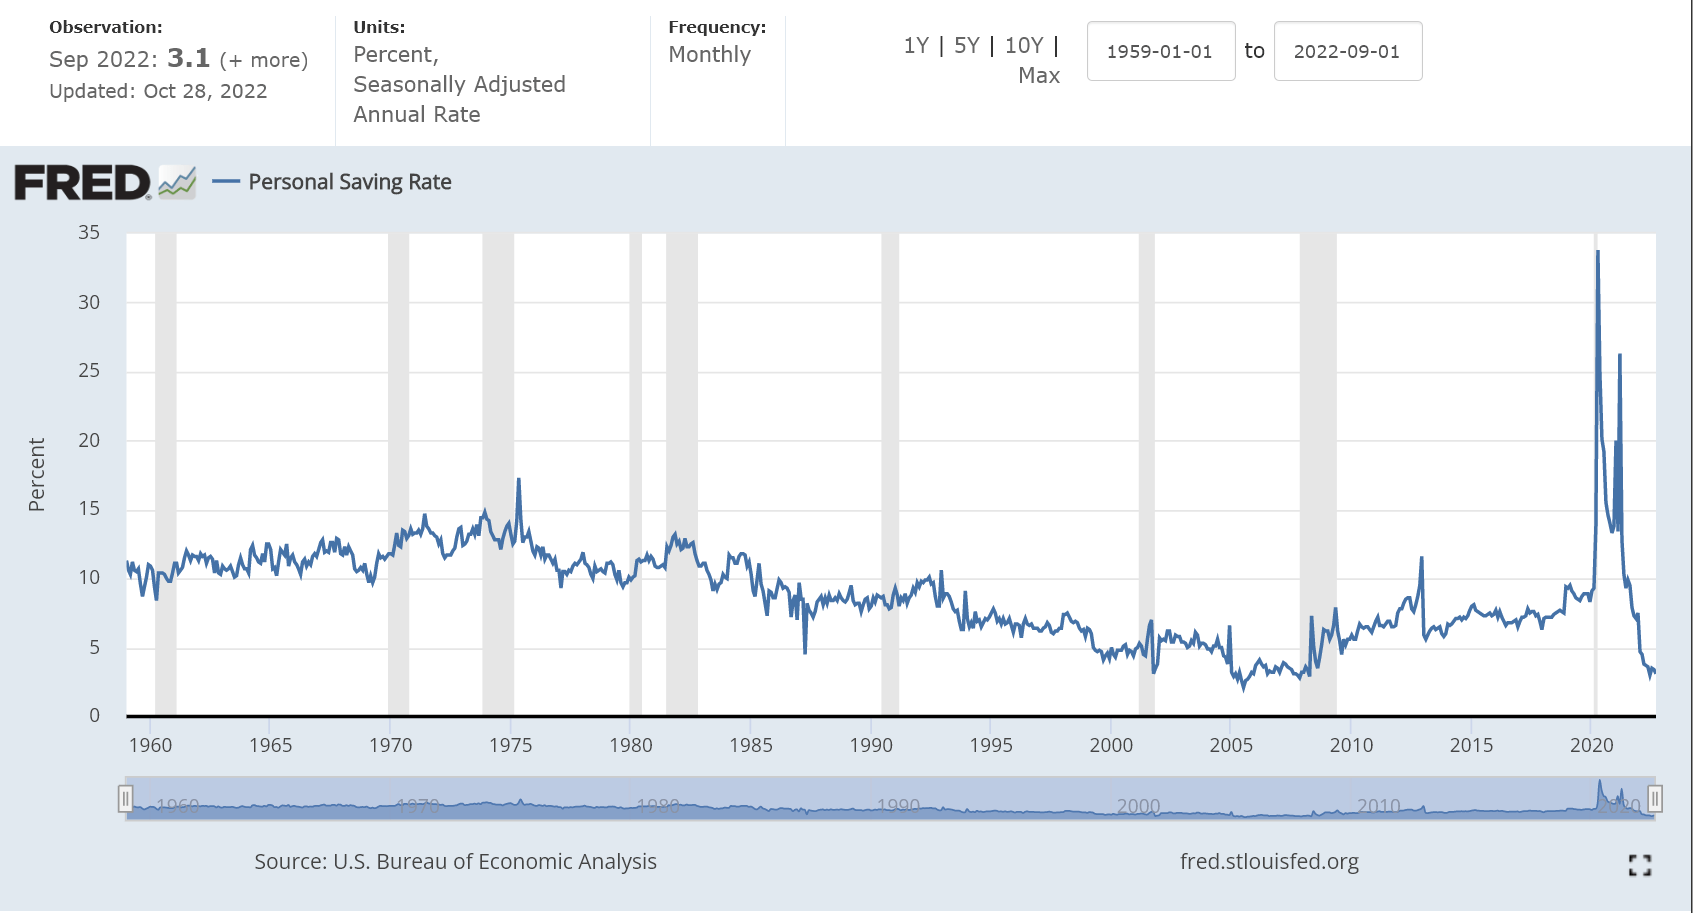
Personal Savings Rates (Fred.StLouisFed.Org)
Compounding issues, inflationary pressures continue to remain in place which has led to restaurant brands having to continue raising menu prices to protect margins at a time when consumers are less anxious to spend. The silver lining is that inflationary pressures appear to be moderating in some areas based on commentary from the Q3 Earnings Season. Applebee’s confirmed this in its Q3 Earnings Call, noting that cost of goods inflation dipped from 23% in H1 2022 to expectations of 13% in H2 2022. IHOP also saw some improvement in the rate of change in its cost of goods, but the decline was more modest (19% vs. 21%), and was related to the high cost of eggs, and the higher cost of grain prices. The combination of a weaker consumer backdrop against steadily rising menu prices is obviously not ideal and could contribute to a tough winter for casual dining.
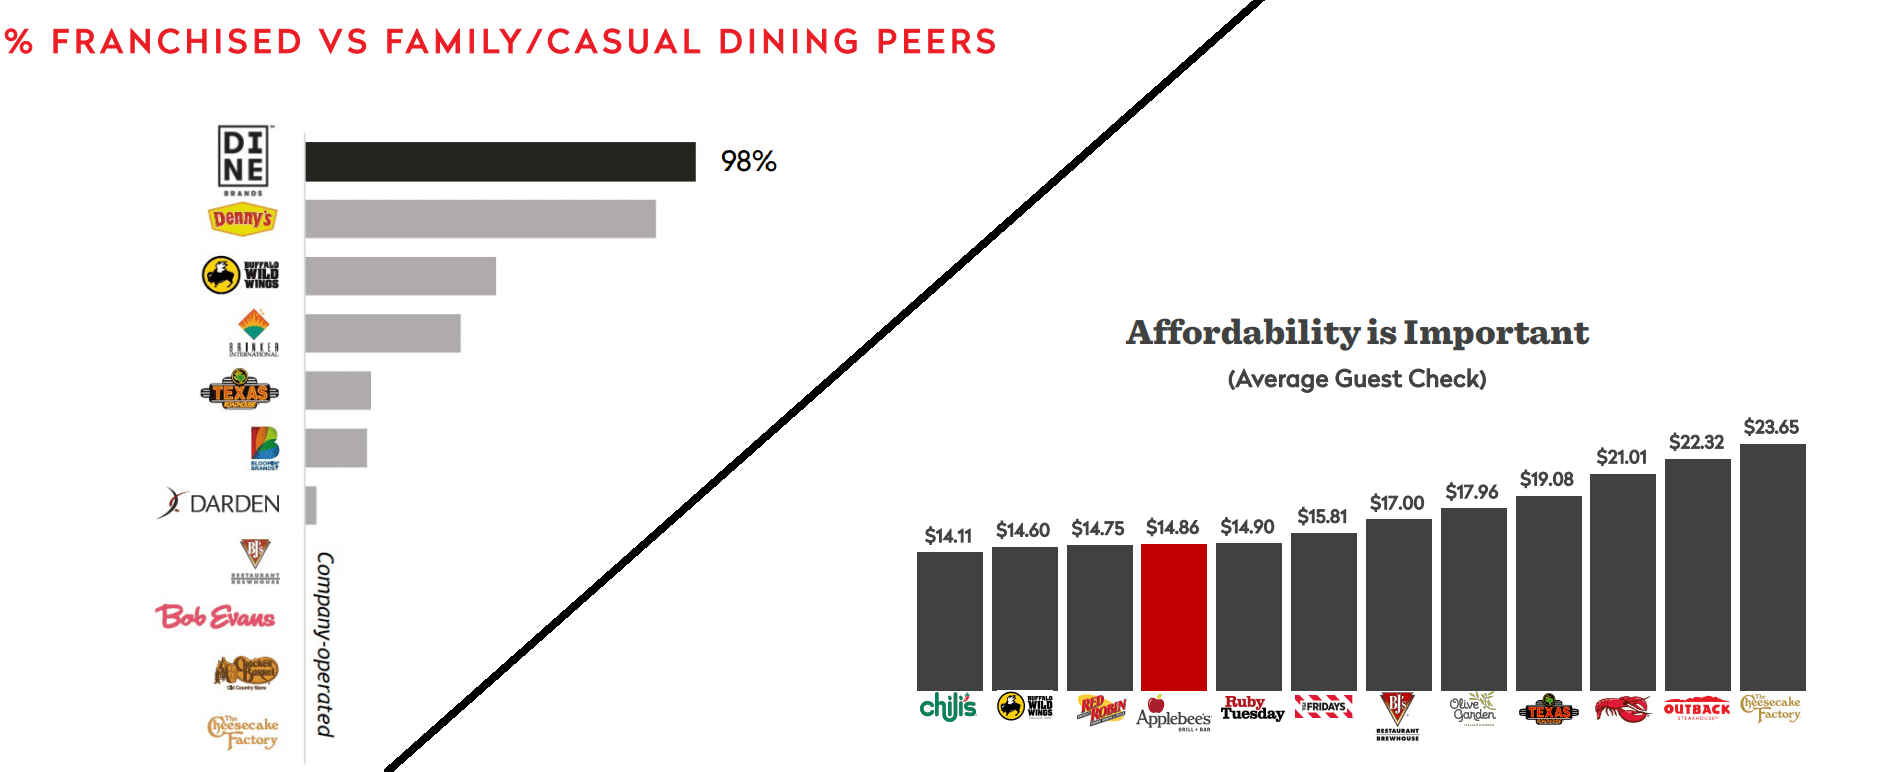
Dine Brands / Applebee’s – % Franchised & Affordability (Company Presentation)
That said, while this trading-down that we’re already seeing with higher-income shoppers heading to Walmart (WMT) to shop for groceries is not positive for casual dining brands that could continue to see trading down, check management, or skipped visits altogether, Dine Brands is unique. For starters, the company is one of the most affordable brands in casual dining and is also one of the most iconic. As the chart above shows, Applebee’s ranks exceptionally well against other brands like Red Lobster, Texas Roadhouse (TXRH), Outback (BLMN), and Olive Garden (DRI) with an average check below $16.00 even after factoring in menu pricing. This still adds up for a family visit, but it’s much easier to stomach than a $100.00+ bill before tip at brands like Cheesecake Factory (CAKE).
Meanwhile, from a margin standpoint, Dine Brands is much more insulated than its peer group which has seen a massive hit to earnings due to weaker margins at company-owned restaurants. In Dine Brands case, the company has a fully-franchised model following its sale of its remaining 69 Applebee’s restaurants, leading to the company having a much better earnings trend than some of its peers like Brinker (EAT) and Red Robin vs. FY2019 levels. In fact, while FY2022 annual EPS is set to sink 7% to estimates of $6.07, annual EPS is expected to hit a new high of $7.07 in FY2023 and $7.88 in FY2024, with FY2024 helped by continued net new unit growth.
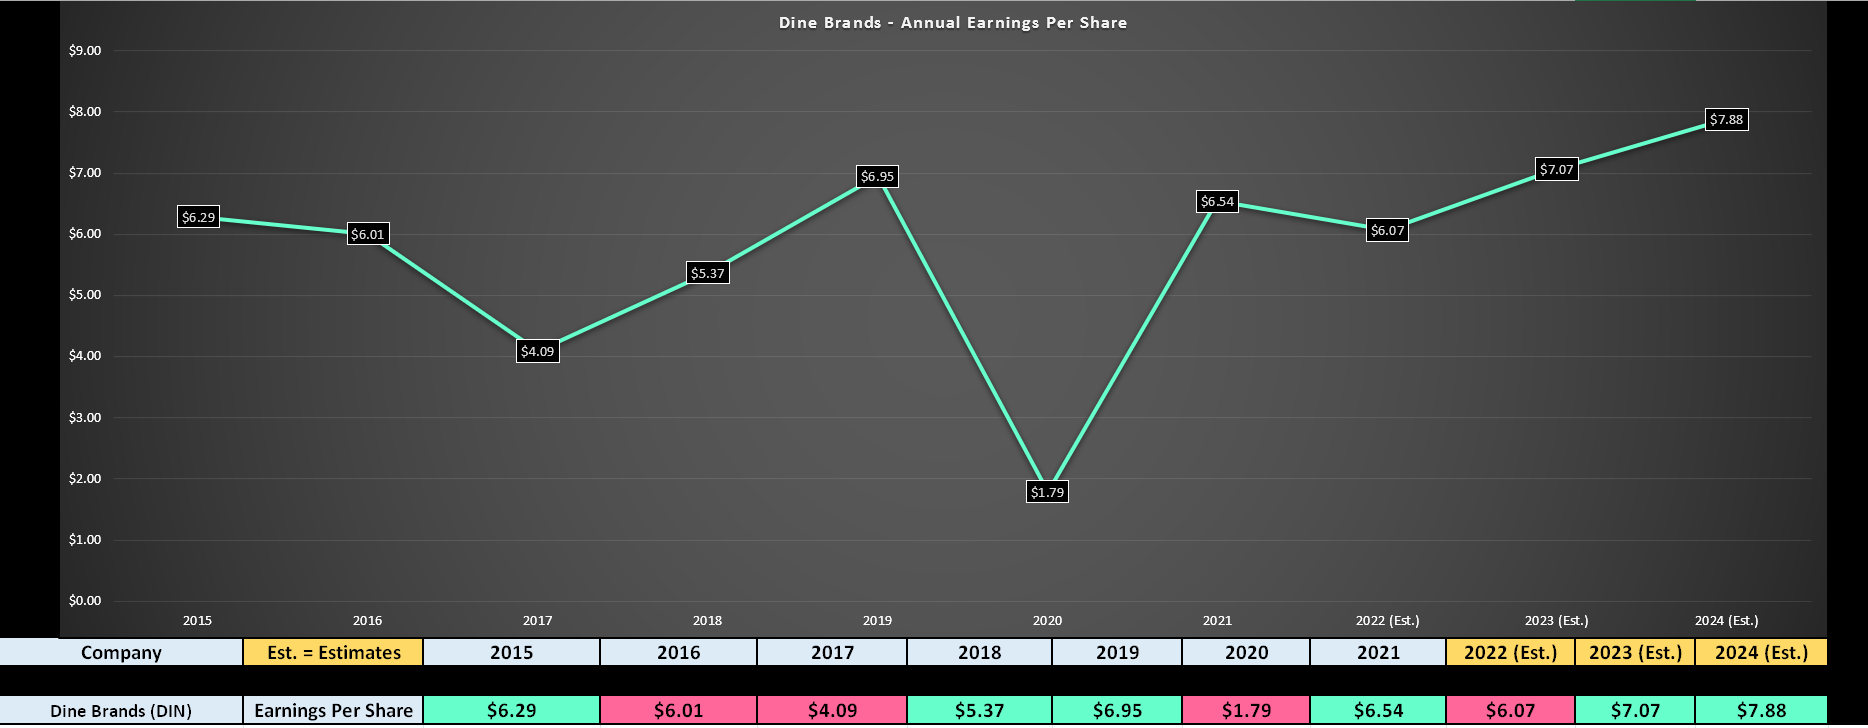
Dine Brands – Earnings Trend (YCharts.com, Author’s Chart, FactSet)
One could argue that annual EPS has essentially gone nowhere since FY2019 ($6.95) and that a ~2.5% compound annual EPS growth rate is nothing to get overly excited about here. While a fair point, especially given that earnings have been buoyed by share buybacks, the environment is near unprecedented and Dine Brands has actually performed quite well given the challenges. So, while I wouldn’t call the company an industry leader like Texas Roadhouse that is on track to nearly double annual EPS from FY2019 levels (FY2023 estimates: $4.80 vs. $2.46), investors are getting a much more reasonable valuation for Dine Brands at ~10.2x FY2023 earnings estimates.
Valuation & Technical Picture
Looking at the below chart, Dine Brands has historically traded at ~14.2x earnings, and it currently trades at just ~10.2x FY2023 earnings estimates at a share price of $72.00. This would normally suggest a very attractive buying opportunity in a normal environment, given that DIN is paying an attractive dividend yield (~2.80%) and trading at a deep discount to its historical multiple. That said, the industry does not look to be out of the woods just yet even if Dine Brands’ franchisees remain healthy. Given these headwinds, I think a more conservative earnings multiple is 12.1x earnings (15% discount to 15-year average).
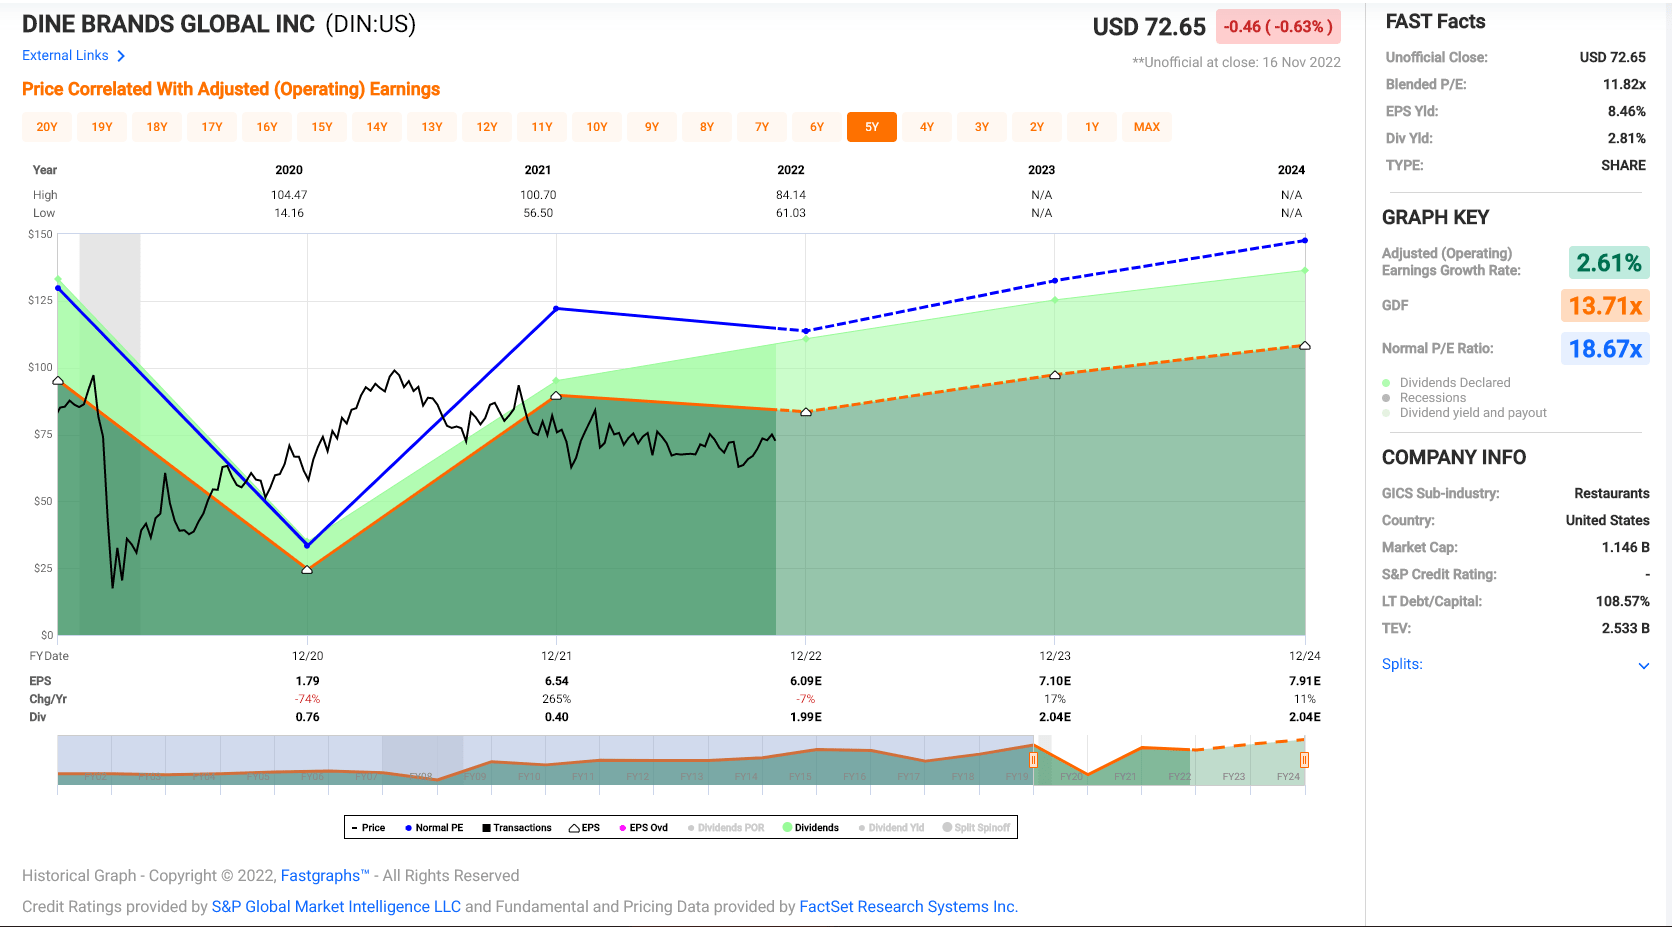
Dine Brands – Historical Earnings Multiple (FASTGraphs.com)
Based on FY2023 annual EPS estimates of $7.07 and what I believe to be a conservative earnings multiple of 12.1, I see a fair value for Dine Brands of $85.55, translating to a 19% upside or ~22% upside on a total return basis vs. its 12-month price target. While this is a reasonable upside case especially given that I believe an earnings multiple of 12.0 is conservative for a company with a mostly franchised model, I prefer a 30% discount to fair value to justify entering new positions. So, while I see DIN as a top-10 name in the restaurant space, the ideal buy zone is closer to $63.00 (30% discount to fair value [+] expected shareholder returns in the period). Hence, I don’t see a low-risk buying opportunity just yet.
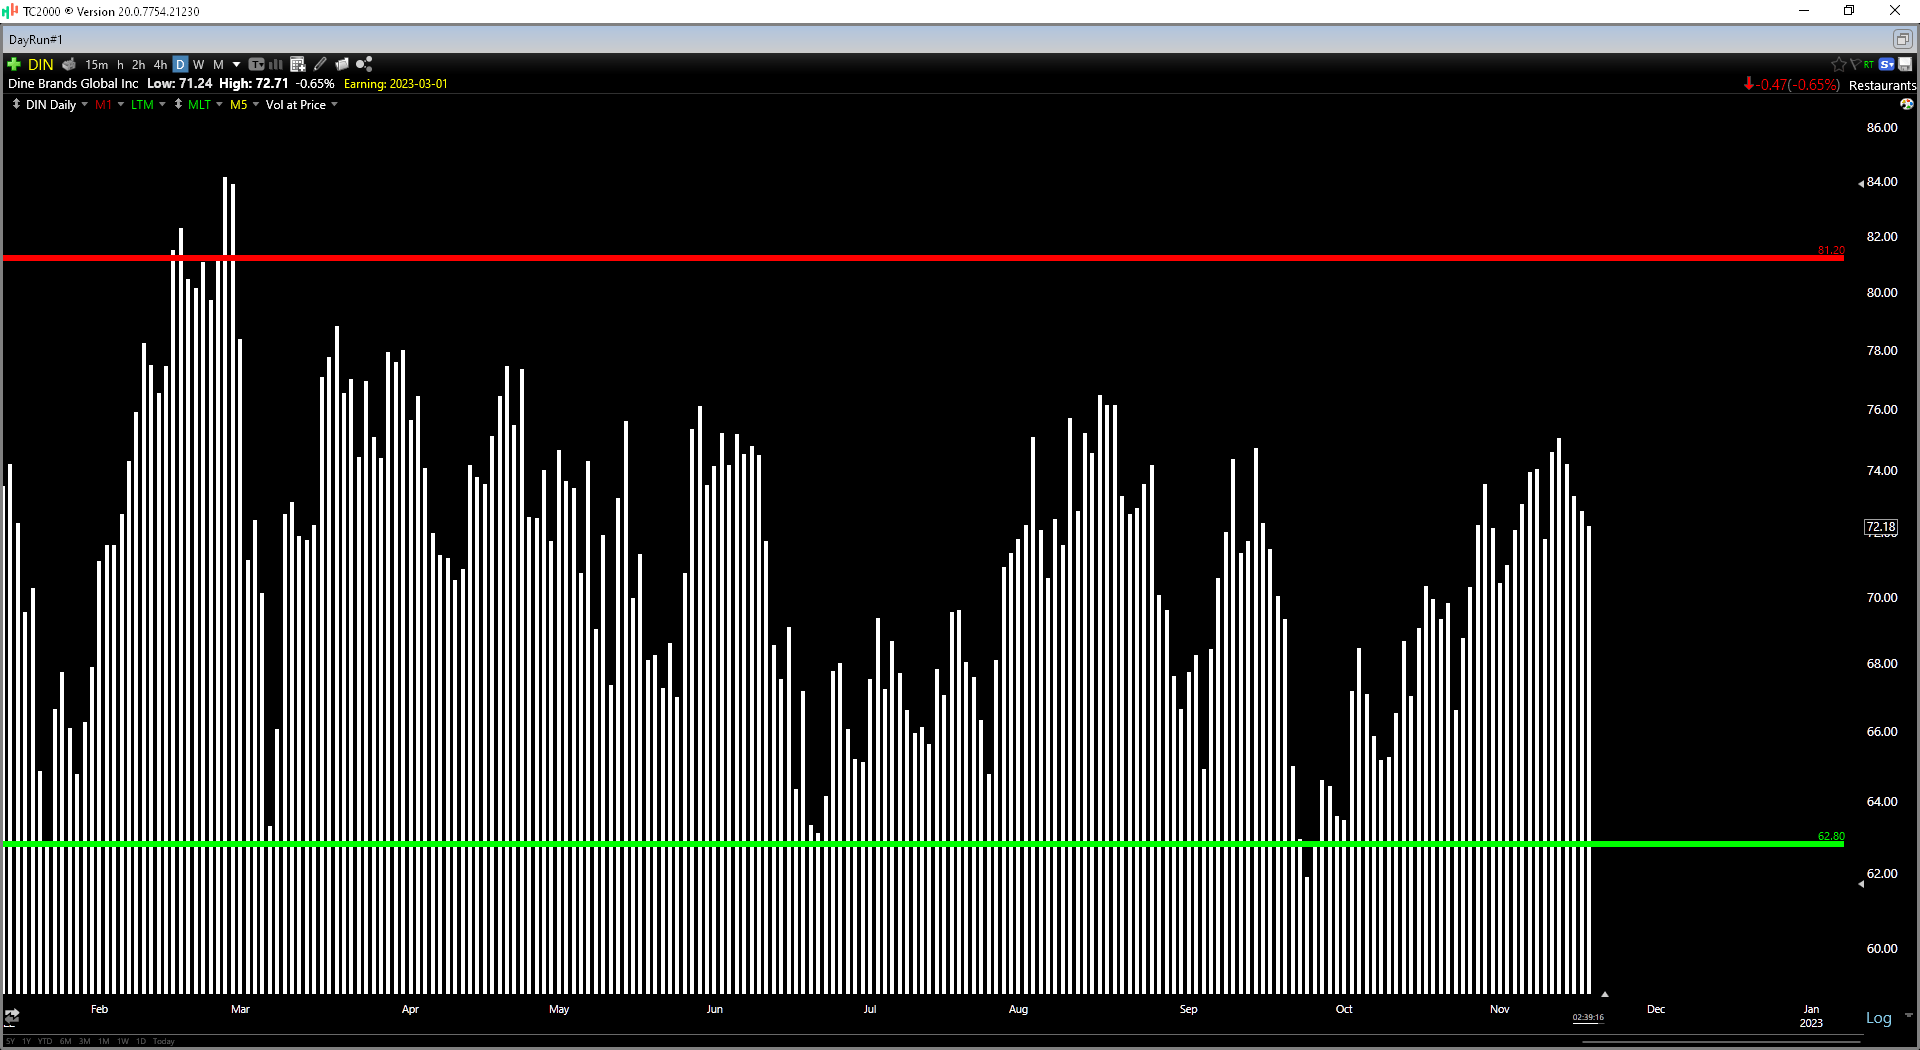
DIN Daily Chart (TC2000.com)
Moving over to the technical picture, we can see that DIN has strong support at $62.80, and its next strong resistance level comes in at $81.20. Regarding small-cap names, I prefer a minimum of a 4.0 to 1.0 reward/risk ratio to justify entering new positions. With DIN trading at $72.00, the stock is currently sitting near the middle of this range with a current reward/risk ratio of 1.0 to 1.0. The current technical setup corroborates the view that the stock is not yet in a low-risk buy zone, suggesting that patience for lower prices is needed to set up a trade/investment with a higher probability of success.
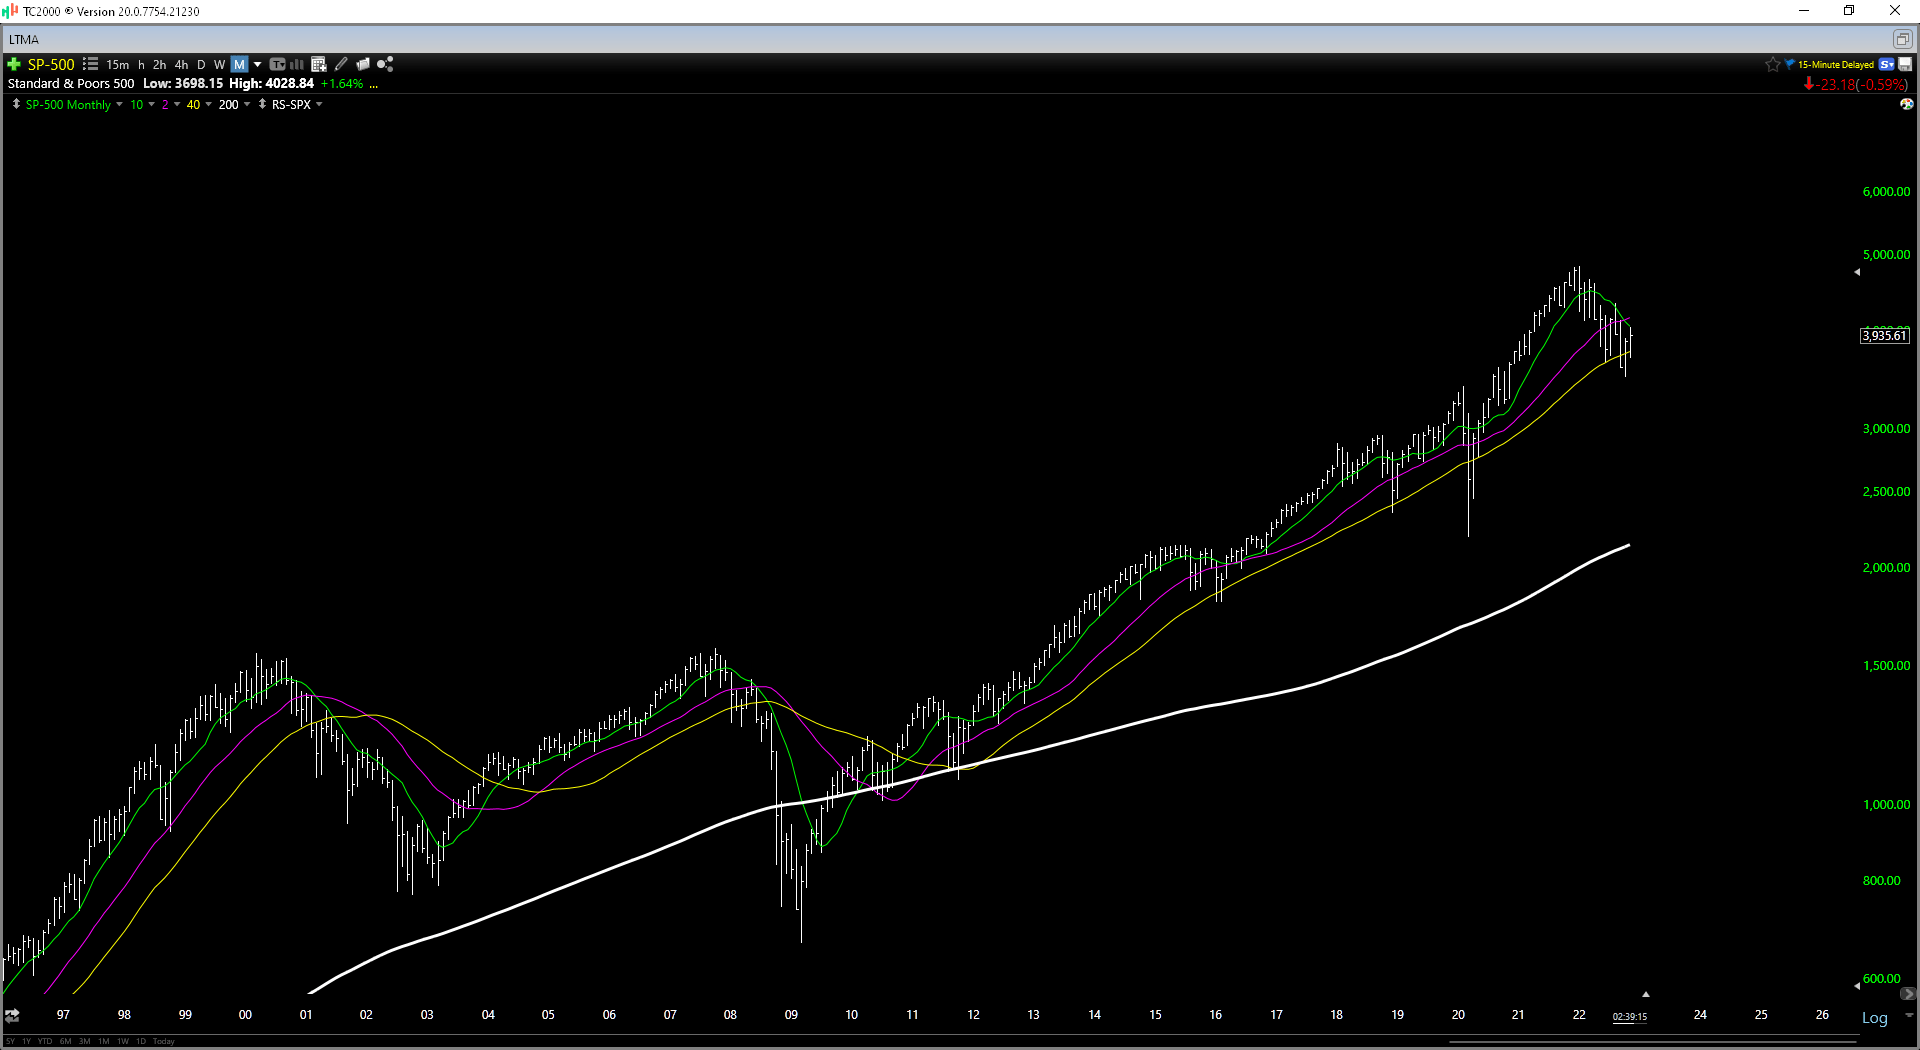
S&P-500 Monthly Chart (TC2000.com)
Obviously, I could be wrong in my assessment here. If we use a similar earnings multiple for Dine Brands to its 5-year average (~18.0) and apply the same 15% discount (15.3x earnings) for the challenging environment, the stock would be significantly undervalued with a fair value north of $100.00. However, I prefer to be as conservative as possible with valuing stocks when the S&P-500 is in a cyclical bear market (below primary monthly moving averages, as shown above). In fact, I don’t see any need to put capital at risk unless a stock is at levels where it’s practically being given away (with one example being Restaurant Brands International (QSR) below $50.00 per share. So, while I see DIN as reasonably valued, the ideal buy zone comes in at $63.00.
Summary
Dine Brands had a decent Q3 performance and while it certainly hasn’t knocked it out of the park like First Watch (FWRG) with continued traffic growth, the company is doing a solid job of navigating the difficult operating environment. That said, I prefer buying stocks at a deep discount to fair value or passing entirely, and I don’t see enough of a margin of safety here just yet at $72.00. So, while I see DIN as a name to keep on one’s watchlist, I wouldn’t get interested in starting a new position unless the stock slipped below $63.00 per share.
Be the first to comment