

Torsten Asmus
Love me two times
The CPI report for November will be released on Tuesday, December 13th, and the consensus expectations are: the CPI will fall from 7.7% to 7.3% yoy and the core CPI will fall from 6.3% to 6.1% yoy.
Note, the inflation numbers in the October CPI report were lower than expected, which was the first positive sign that the inflationary shock of 2022 is possibly easing faster than expected. As a result, the market started pricing a less aggressive monetary policy tightening, which increased the possibility of a soft landing.
However, the Fed Chair Powell has been clear that he needs to see a “couple of” positive surprises in the inflation readings before assuming that the inflation peak has been reached and that inflation will continue to trend downwards towards the 2% target.
Thus, the November CPI report is potentially that second confirmatory data point, and thus, it has extremely important market implications.
However, the Cleveland Fed InflationNowcast is predicting that the November CPI numbers will be higher than expected, with the CPI at 7.49% (7.3% consensus) and core CPI at 6.26% (6.1% consensus). Note, the InflationNowcast failed to predict the softer than expected October CPI readings, although it has been very reliable in 2022.
Cleveland Fed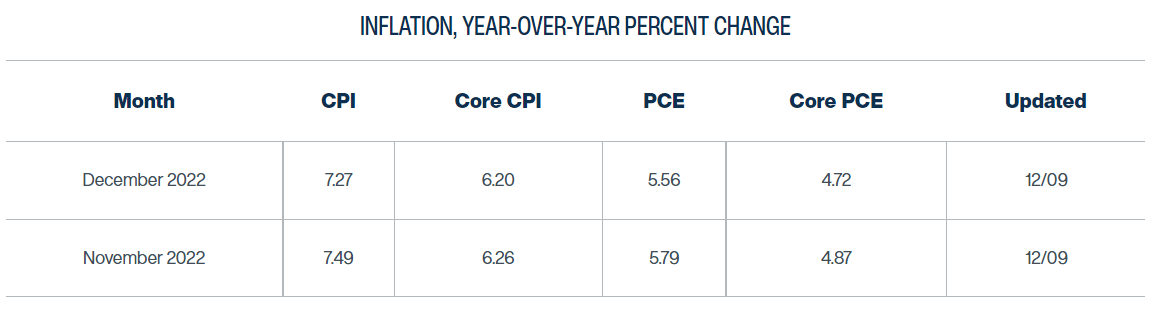
The market implications are huge. The failure to get the second confirmatory data point resets the count and postpones the Fed’s pivot, and thus, sharply reduced the probability of a soft landing in 2023.
Let’s dig deeper into the inflation dynamics
The Fed Chair Powell stated in his speech at the Brookings Institute on November 30th:
While October inflation data received so far showed a welcome surprise to the downside, these are a single month’s data, which followed upside surprises over the previous two months. As figure 1 makes clear, down months in the data have often been followed by renewed increases. It will take substantially more evidence to give comfort that inflation is actually declining. By any standard, inflation remains much too high.
This is the Figure 1 from the Powell’s speech, showing the post-covid spike in PCE inflation.
The Fed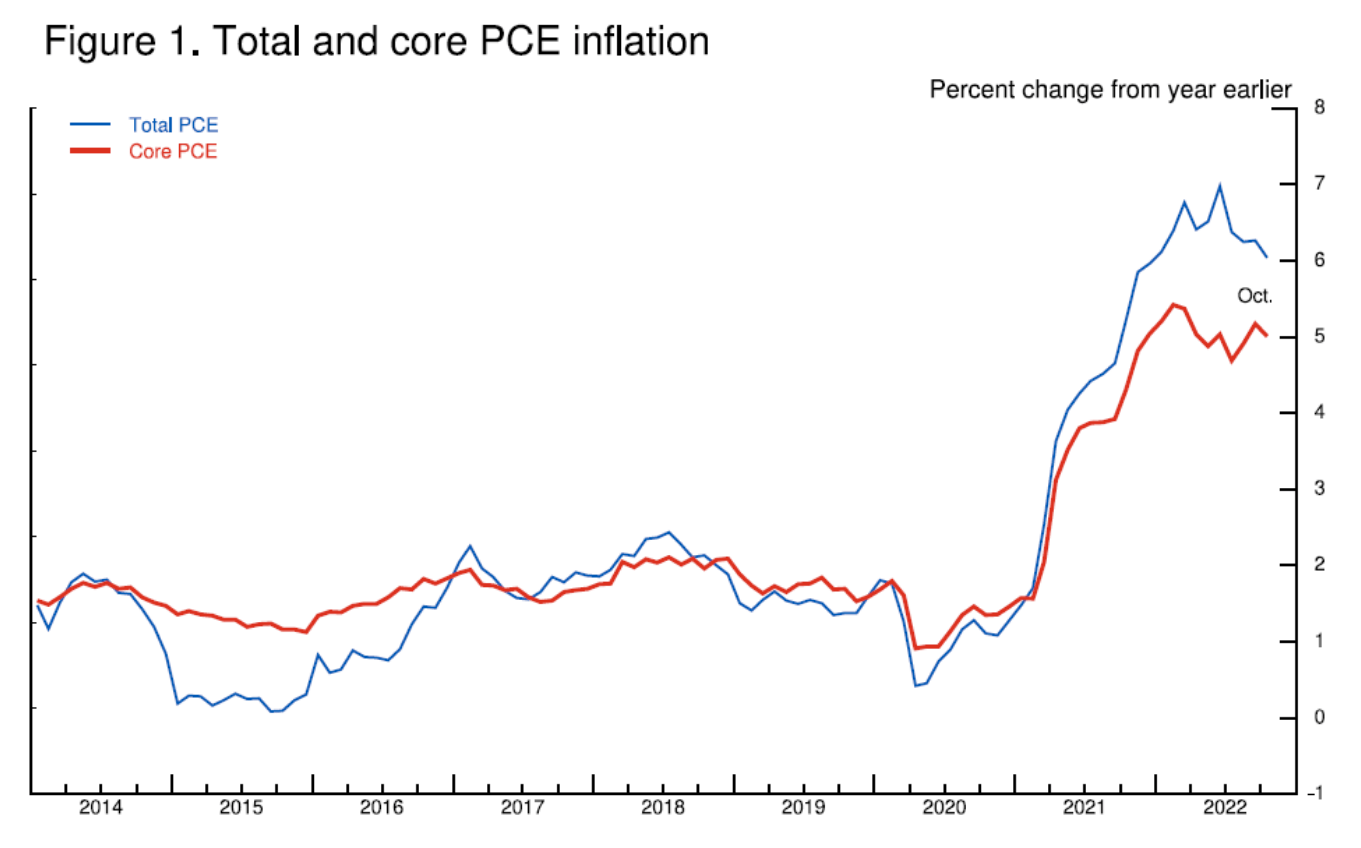
The Fed’s preferred inflation metric is the core PCE inflation, which has three parts: the core goods inflation, the housing services inflation, and the core services inflation.
Powell shows in Figure 2 that the core goods inflation (red line) has been falling, as the covid-related supply chain bottlenecks improved, and it’s likely to keep falling. The housing services inflation is still rising (light blue line), however, Powell predicts that the housing inflation will also fall as the new leases are falling (shown in Figure 3). The major problem is the core services inflation (dark blue line), which has been persistently around 5%, and it’s less likely to fall.
The Fed
The Figure 3 shows that the leading indicators of the housing service inflation, or the new leases, have been falling sharply, which confirms that the housing inflation will also sharply fall in 2023.
The Fed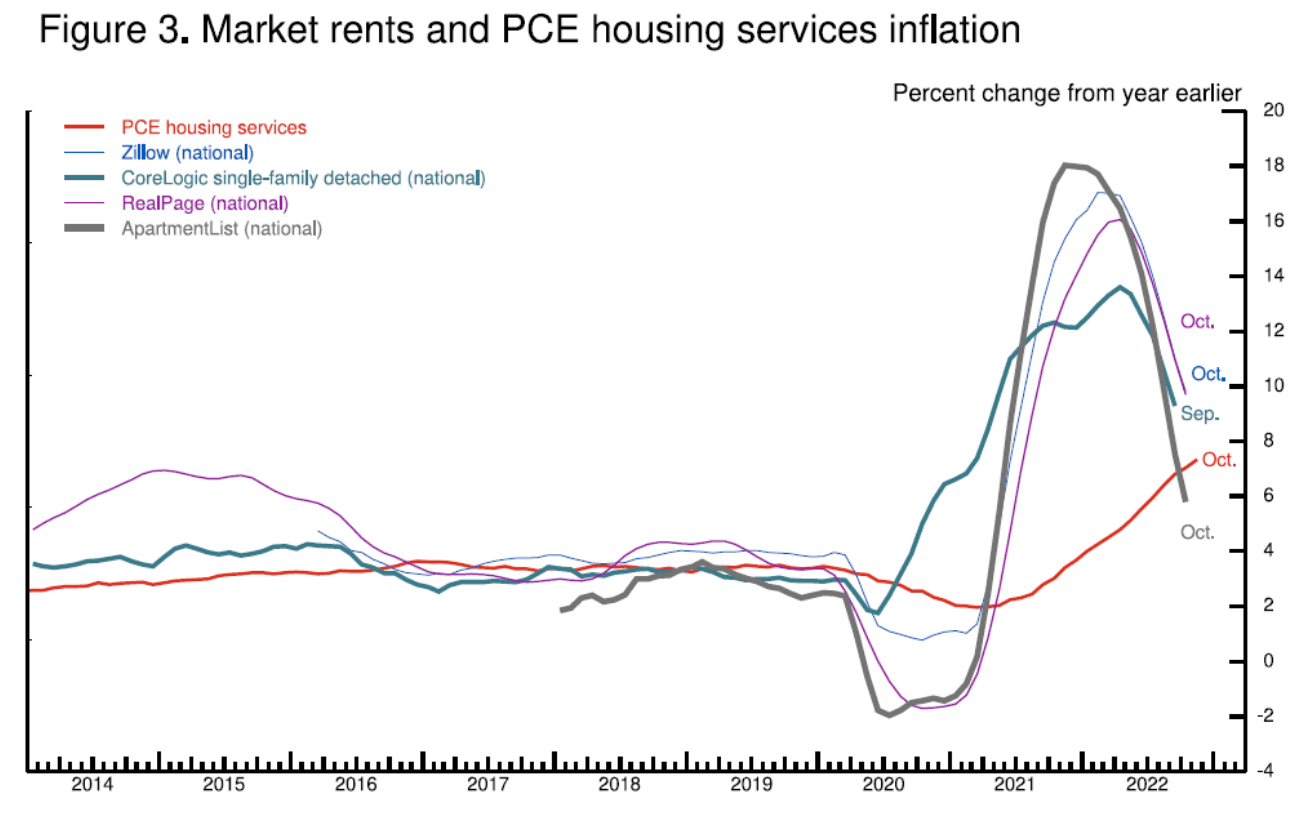
The core services inflation depends on wages, which depend on supply-demand for workers. The Figure 5 in Powell’s speech shows the jobs-worker gap, or the number of available jobs, which include jobs openings and employment, and the labor force, since 1980.
Note, historically, as the number of jobs approaches (red line) in the labor force (blue line), the economy enters a recession shortly thereafter. Currently, we are in an extreme situation where the number of available jobs is actually much higher than the labor force.
The Fed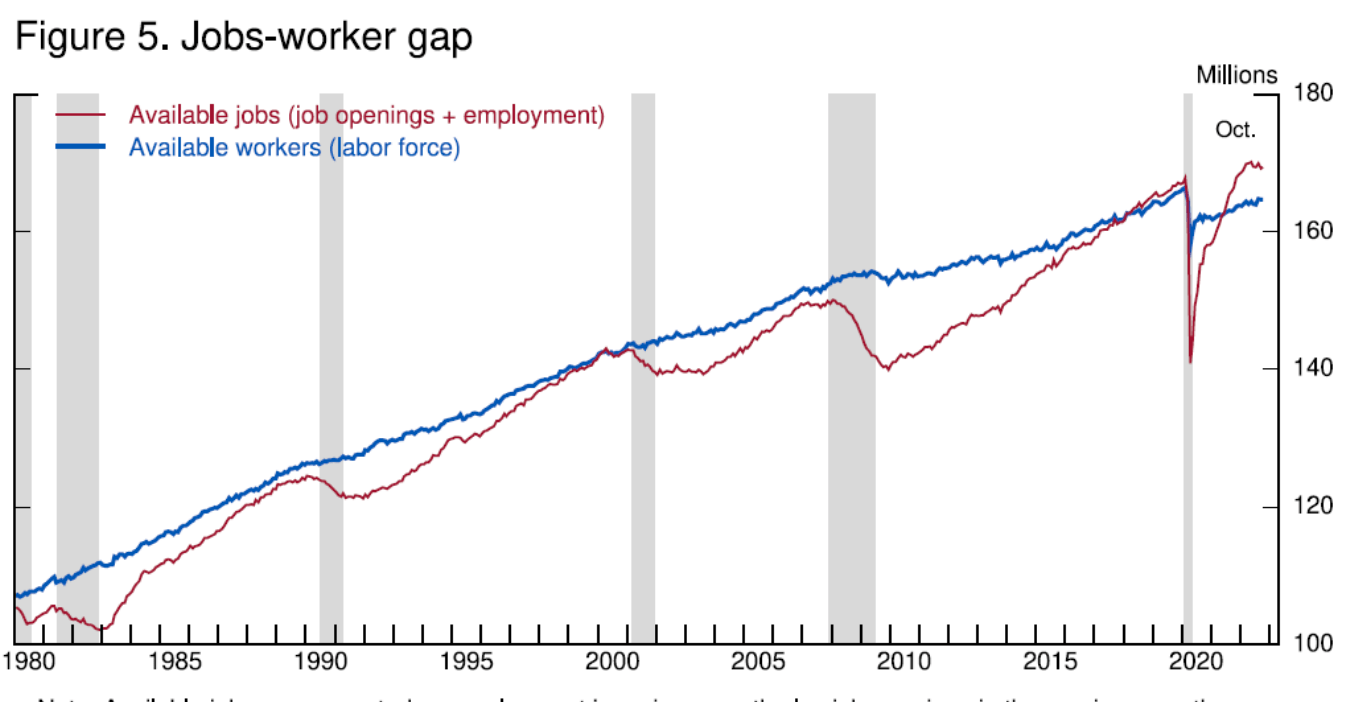
Obviously, given that the number of jobs available exceeds the labor force, the wages are rising. The Figure 6 from Powell’s speech shows the trend of rising average hourly earnings (light blue line), which just reached the news cyclical high of 6.1% for November (not updated on this chart).
The Fed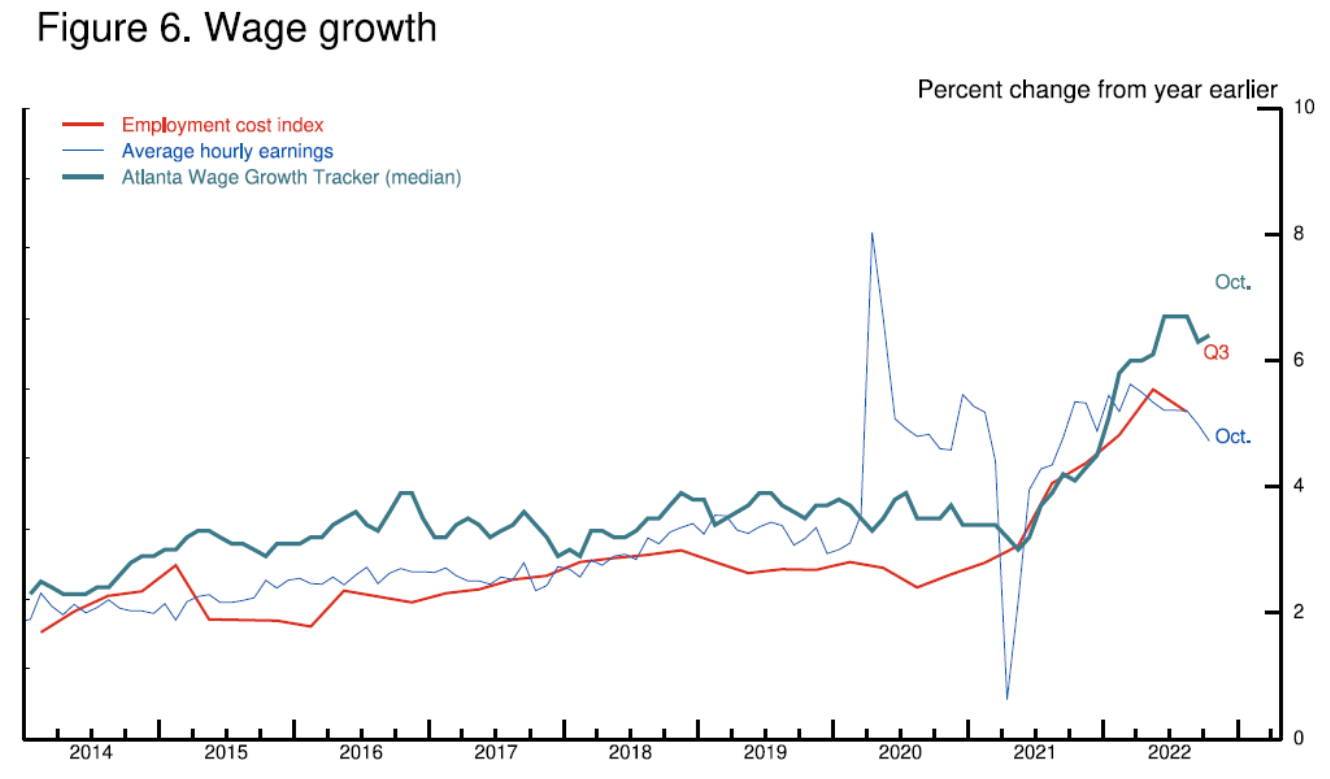
The labor force is still below the pre-covid levels due to several reasons, such as 1) pre-mature retirements enabled by the rising stock market and housing prices, 2) health-related reasons, including excess covid related deaths, 3) and also stricter immigration laws. The demand for labor is high, partially due to deglobalization-related onshoring.
These trends are likely irreversible over the near term, as the labor rate participation is unlikely to increase, and the deglobalization-related policies of stricter immigration and onshoring are unlikely to be changed.
Thus, the jobs-worker gap is unlikely to narrow naturally, and it will require a very sharp increase in the unemployment rate to bring the balance to the labor market – which means a very deep recession.
The major risk of rising wages is the wage-price spiral – as wages continue to rise, the services inflation will continue to rise, but also it could also cause the increase in goods services, and the housing services inflation.
What to expect from the November CPI report?
Wall Street expects a very sharp drop in inflation in 2023. For example, ING expects the US CPI at 2.2% in 4Q2023.
ING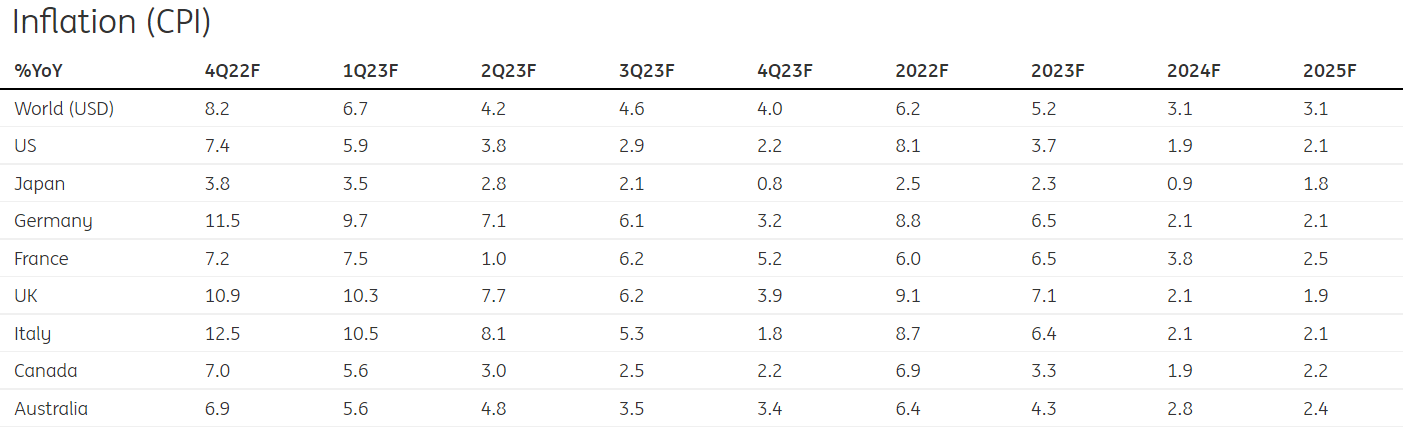
The November 2022 CPI report could prove to be the second data point that confirms the downtrend in CPI towards 2%, as ING expects.
However, analysts who see the inflation sharply falling are ignoring the job-worker gap. Given the most recent data, the labor market balance is still well out of balance. The CPI Report is a lagging indicator; thus, it does not provide any information about the possible risk of wage-price spiral inflation.
Thus, any possible positive surprise in CPI is fundamentally irrelevant. However, a negative surprise will only confirm that inflation is much more persistent than what Wall Street currently expects. Note, Fed’s inflation nowcast is predicting a negative surprise.
The impact of stock market
In this article, I will analyze the ETF that tracks the Dow Jones Industrial Average (NYSEARCA:DIA). Unlike S&P 500 (SPY), Dow Jones in a price-weighted index, where the stock with the highest price affects the index value the most. S&P500 is a value-based index, where the stocks with the highest market cap affect the index value the most.
Thus, DIA tracks the index of 32 stocks, where UnitedHealth (UNH) represents almost 11% of the index. DIA is very different from SPY, which is heavily weighed by big tech, like Apple (AAPL).
Seeking Alpha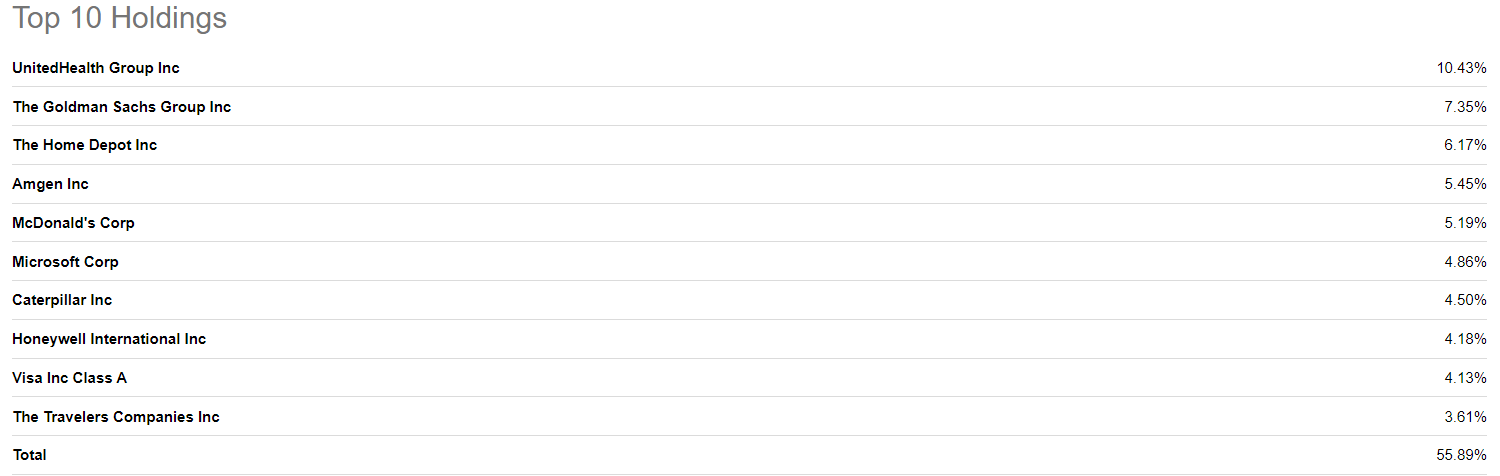
It is very interesting that DIA is actually more overvalued than SPY, with the ttm PE ratio of nearly 21 and forward PE ratio of nearly 19. Historically, DIA is very expensive, and this cannot be blamed on the big-tech bubble. Note, DIA is down by only 8% YTD.
Thus, we have a very overvalued broad stock market, waiting the second data point that inflation is falling, hoping for a soft landing in 2023.
However, the reality is very different – the risk of wage-price spiral is very high, and the CPI report will not provide any leading information about this issue. Any random positive surprise in CPI and the resulting spike in the stock market is the opportunity to sell.
The only resolution of the imbalance in the labor market is a very sharp increase in the unemployment rate – and thus, a deep recession. Note, ING does predict a recession in the second half of 2023, with -0.4% and -0.6% real GDP growth in Q3 and Q4 for 2023.
ING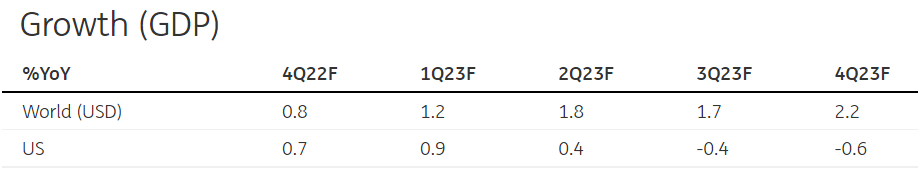
Given the expected recession, the DIA earnings are likely to decrease, and the valuation multiple has to contract. Thus, I rate DIA as a sell. The positive CPI report for November will not affect this rating.
Be the first to comment