


Richard Drury/DigitalVision via Getty Images
Written by George Spritzer, co-produced by Alpha Gen Capital
(Data below is sourced from the Delaware Investments website unless otherwise stated.)
The Delaware Enhanced Global Dividend and Income Fund (NYSE:DEX) was formed in June, 2007. It is a relatively small fund with about $117 million in common assets. Managed assets, including use of leverage, are about $170 million.
Investment Objective: DEX seeks current income with a secondary objective of capital appreciation.
Fund Strategy
- Invests globally in dividend-paying or income generating securities across multiple asset classes including: large cap equities, real estate operating companies and REITS and debt securities such as government bonds, investment grade and higher risk high yield corporate bonds and convertible bonds.
- Uses enhanced income strategies such as dividend capture trading, option overwriting, dividend growth, capital gains and currency forwards.
DEX – Asset Allocation (as of 12/31/2021)*
|
High yield bonds |
26.11% |
|
International equity |
31.70% |
|
Large-cap value |
6.19% |
|
Emerging markets fixed income |
11.57% |
|
Convertible securities |
9.10% |
|
Emerging markets equity |
6.45% |
|
Other |
1.94% |
* As a percent of total managed assets
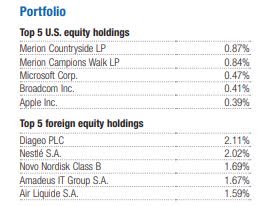
DEX Equity Holdings (Delaware Macquarie web site)
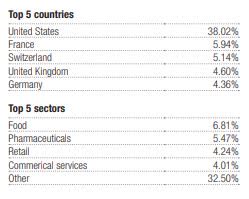
DEX Sector Country Breakdown (Delaware Macquarie web site)
DEX -Institutional Ownership
Institutional investors own 33.75% of the shares outstanding. The top two institutional investors are Saba Capital who owned $9.5 million and SIT Investment Associates who owned $6.3 million as of 12/31/2021. Saba is a well known activist investor and SIT will often support activist activities.
Some other DEX holders who would also tend to support activism are Shaker Financial $2.1 million and Bulldog Investors $1.7 million.
Source: nasdaq.com
DEX Investment Performance: NAV Return as of 3/29/2022)
YTD – 4.93%
1-Year + 2.82%
3-Year + 6.26% annualized
5-Year + 4.91% annualized
10-Year + 6.27% annualized
DEX – Three Year Discount History
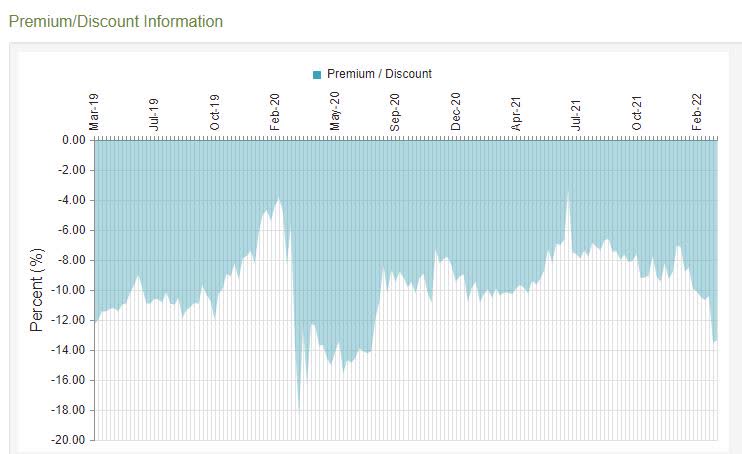
DEX Discount history (cefconnect)
Alpha is Generated by High Discount + High Distributions
The high distribution rate of 8.43% along with the 13.6% discount allows investors to capture some alpha by recovering some of the discount whenever a monthly distribution is paid.
Whenever you recover NAV from a fund selling at a 13.6% discount, the percentage return is 1.00/ 0.864 or about 15.7%. So the “discount” alpha generated by the 8.43% annual distribution is computed as:
(0.0843)*(0.157)=0.0132 or about 132 basis points a year!
Note that this pretty much covers the 1.34% baseline expense ratio, so you are effectively getting the fund managed for free.
NAV Correlation Analysis for DEX
Three month NAV Correlation with (BOE)= 95%
Three month NAV Correlation with (IGA)= 84%
Three month NAV Correlation with (SPY)= 81%
Source: cefanalyzer
International Stocks May Be Due to Outperform
Some investors invest exclusively in US-based securities. While that has been a good strategy over the last decade or so, history suggests that international stocks may soon enjoy their day in the sun. Hartford Funds has published an interesting chart comparing US equity versus international equity returns since 1975.
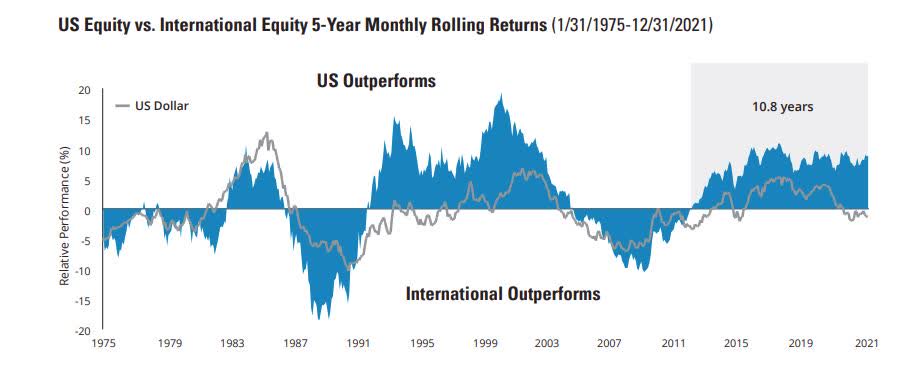
US versus International equity performance (Hartford Funds web site)
Source: Hartford Funds
Note that since 1975, the average period of outperformance has lasted around 8 years on average. But we are currently about 11 years into the current cycle of US outperformance, which suggests that international equities may be overdue to outperform over the next decade.
Delaware Enhanced Global Dividend & Income Fund
Ticker: (DEX) NAV Ticker: XDEWX
- Inception Date: June 29, 2007
- Total Investment Exposure: 171 Million
- Total Common Assets: 117 Million
- Effective Leverage: 32%
- Baseline Expense Ratio= 1.34%
- Discount= -13.63%
- Average 6 month discount= -9.37%
- Annual Distribution Rate (market price) = 8.43%
- Current Monthly distribution= $0.0632
- Annual Distribution= $0.7584
Summary
I think DEX is a reasonable way to bet on potential future outperformance of international stocks. It trades at an attractive relative discount which could narrow if international stock investing becomes more popular in the US. I also like the fact that you pick up a little “discount” alpha every time it makes a monthly payment.
Be the first to comment