

Fokusiert
By Lukas Smart
Understanding how minimum volatility ETFs can help today, and over the long term.
Key Takeaways
- Given the challenging market environment we’ve had in 2022 — many investors have turned to minimum volatility strategies.
- There are many reasons to favor min vol today, but there are also reasons to consider having a strategic allocation to min vol over time.
- The evidence shows that investing in min vol today and over the long-term can be compelling1.
With the return of volatility in 2022, it’s probably not surprising that minimum volatility strategies are back in vogue. Equity markets were down about 20% through the first half of the year. Bonds, historically a diversifier to stocks, were down over 10%2. Some investors pivoted their portfolios towards min vol ETFs to help reduce risk in their equity allocations — especially during the second quarter when risk spiked. The iShares minimum volatility suite had more than $2.5 billion of inflows in the second quarter alone3 as investors searched for ways to lessen the pain.
There are many reasons for investors to consider min vol in today’s market — spikes of volatility due to high inflation, the conflict between Russia and Ukraine, a sharp increase in energy prices, concerns over central banks’ action — to name a few. But I am hearing several questions about whether the time is still right for min vol. Not only may the time be right in this moment, we believe there is also a case for a long-term strategic allocation to minimum volatility. Let me explore below in my answers to three common questions about min vol strategies.
How Do Rising Rates Affect Min Vol?
From the end of 2021, through the first half of 2022, the yield on 10-year US Treasuries doubled from 1.5% to 3.0%4. During that same time frame, the MSCI USA Minimum Volatility Index outperformed the S&P 500 Index by 7.4%5.
Exhibit 1: Min vol performance YTD in a rising rate environment
Line chart showing the performance of the MSCI USA Minimum Volatility Index vs. the S&P 500 for the first six months of 2022. (Morningstar as of 6/30/22. Excess returns of minimum volatility are represented by the difference in performance between the MSCI USA Minimum Volatility Index and the S&P 500 Index.)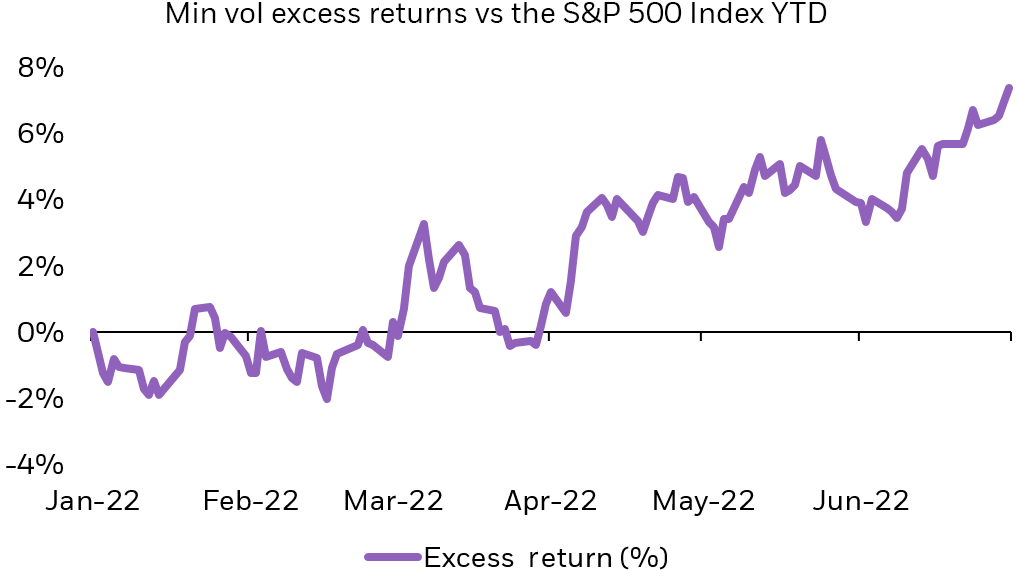
Index performance is for illustrative purposes only. Index performance does not reflect any management fees, transaction costs or expenses. Indexes are unmanaged and one cannot invest directly in an index. Past performance does not guarantee future results.
Our minimum volatility ETFs are equity strategies. Like bonds, interest rates can have an impact on performance, particularly as min vol strategies often invest in rate-sensitive sectors like utilities. That said, rising rates — traditionally a signal for underperformance in bonds — does not necessarily imply a decrease in prices for equity-based min vol strategies. The market price of a stock is driven by the underlying economics of the company, the market it serves, and the needs of its investors.
One characteristic that is reasonably persistent for a company is volatility. Meaning today’s volatility can provide insight into how risky a company might be tomorrow. One need many investors have is managing the risk of their portfolio. Sometimes investors choose different asset classes to help manage risk. That can certainly work but may not be right for all circumstances. Being able to reduce portfolio volatility with stocks can be especially appealing when bonds face the structural headwinds of rising interest rates.
Will The Recent Outperformance Of Min Vol Hinder Its Ability To Reduce Risk Going Forward?
Minimum volatility strategies have historically tended to trade at a premium. Not surprisingly, investors have been willing to pay a higher price for less volatility. We have historically seen the MSCI USA Minimum Volatility Index trade at a 10% premium over the S&P 500 Index, on average, over the last 10 years6. Despite the strong relative outperformance in the first half of 2022, min vol is still priced only slightly above its trailing 10-year average at current valuations compared to the S&P 500 Index7.
Nevertheless, even if we should see min vol continue to rally, relative valuations have never prevented minimum volatility from reducing risk. As the chart below illustrates, min vol has historically had lower risk than the S&P 500, even during periods when min vol traded above its average premium.
Exhibit 2: Min Vol has consistently had lower risk than the S&P 500 Index regardless of valuations
Chart showing the price-to-earnings premium (or discount) of the MSCI USA Minimum Volatility Index vs. the S&P 500 for the past 10 years. (BlackRock, Morningstar, 7/2012 – 6/2022. Measures the P/E premium or discount of the MSCI USA Minimum Volatility Index relative to the market, as represented by the S&P 500 Index, and subsequent 1-year forward rolling excess risk. Price/Equity’ ratio is the price of the stock divided by the company’s earnings per share, aggregated to the index level.)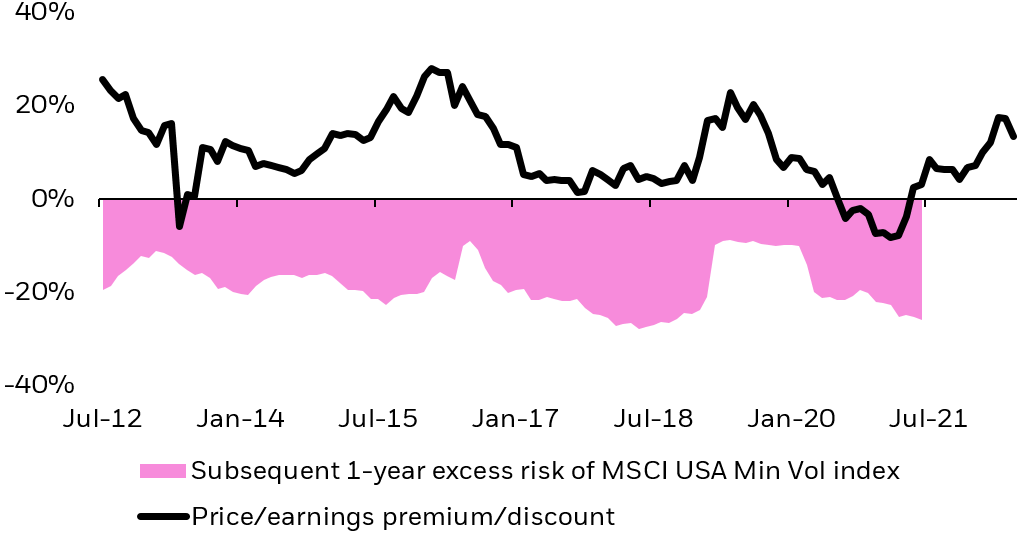
Index returns are for illustrative purposes only. Index performance returns do not reflect any management fees, transaction costs or expenses. Indexes are unmanaged and one cannot invest directly in an index. Past performance does not guarantee future results. Index returns do not represent actual iShares Fund performance.
Valuations have varied throughout time. What hasn’t changed — min vol’s ability to lower risk.
Will Min Vol ETFs Get Left Behind If The Market Rallies From Here?
Trying to time the market is extremely hard and can be costly. Staying fully invested may be prudent. But what happens if we see markets sustain July’s rally, the S&P 500’s best month since November 2020? Will minimum volatility be left in the dust?
This is where the “how” you capture min vol really matters. Investors may believe that if they just buy stocks in “lower risk” sectors like utilities or consumer staples, they are getting access to the min vol factor. But investors that overweight sectors that seem like safe havens may get left behind when markets rally.
The iShares MSCI USA Min Vol Factor ETF (USMV), which seeks to track the MSCI USA Minimum Volatility Index, uses sector guardrails as part of the underlying index methodology. By capping sectors at +/- 5% of the broad market8, USMV can potentially provide diversified access across all sectors to capture a potential upswing — and not diluted exposure to a few “safer” sectors.
Exhibit 3: Upside/Downside Capture over trailing 10-years
Bar chart showing the price-to-earnings premium (or discount) of the MSCI USA Minimum Volatility Index vs. the S&P 500 for the past 10 years. (Morningstar Direct. Data shows trailing 10 years (7/1/12 – 6/30/22). Up/down capture ratios for utilities, consumer staples, and min vol are compared against the S&P 500. The Consumer Staples Sector is represented by the S&P Consumer Staples Select Sector Index. The Utilities Sector is represented by the S&P Utilities Select Sector Index.)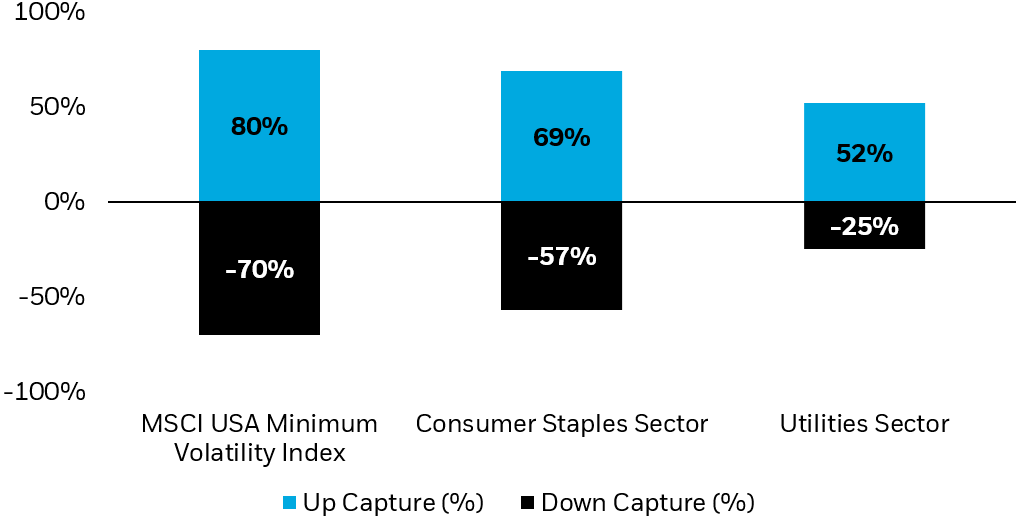
The sector guardrails play an important role in helping the strategy capture more of a rally than what may be expected if the underlying index was built without sector caps. When looking at risk-adjusted returns, we can use the Sharpe Ratio9 to compare how much return a portfolio/investment provides for a given level of risk.
Exhibit 4: Sharpe Ratio over trailing 10-years
Caption: This table shows the risk-adjusted 10-year return of the MSCI USA Minimum Volatility Index vs. consumer staples, utilities, and the S&P 500.
| Index | Sharpe Ratio |
|---|---|
| MSCI USA Minimum Volatility Index | 0.97 |
| Consumer Staples Sector | 0.85 |
| Utilities Sector | 0.72 |
| S&P 500 Index | 0.91 |
Source: Morningstar Direct. Data shows trailing 10 years (7/1/12 – 6/30/22). The Consumer Staples Sector is represented by the S&P Consumer Staples Select Sector Index. The Utilities Sector is represented by the S&P Utilities Select Sector Index. The Sharpe ratio characterizes how well the return of a portfolio compensates the investor for the risk taken. A higher Sharpe Ratio indicates that the index had a higher return per unit of risk during the measurement period.
Over the last decade, as measured by the Sharpe Ratio, the MSCI USA Min Vol Index had higher returns per unit of risk compared to the consumer staples and utilities sectors, as well as the S&P 500 Index10.
Summary
Many investors have turned to minimum volatility strategies this year to help manage risk in their portfolios today. But we believe there is also a case for a long-term strategic allocation to minimum volatility. Rising rates, valuations, and the potential for a strong equity rally may not be reasons to avoid min vol today or over time. If anything, this year is a great reminder of the benefits of having a strategic allocation to minimum volatility strategies.
© 2022 BlackRock, Inc. All rights reserved.
1 The Cross-Section of Volatility and Expected Returns” by Ang, Hodrick, Xing, and Zhang (2006). Journal of Finance.
2 Source: Morningstar Direct as of 6/30/22. Equity represented by the S&P 500 Index. Bonds represented by the Bloomberg US Aggregate Bond Index.
3 Source: BlackRock. Includes flows from USMV, EFAV, EEMV, ACWV, and SMMV.
4 Source: BlackRock as of 6/30/22.
5 Source: Morningstar Direct as of 6/30/22. Indexes are unmanaged and one cannot invest directly in an index. Past performance does not guarantee future results.
6 Source: Morningstar as of 6/30/22.
7 Source: Morningstar. As of 6/30, the MSCI USA Min Vol Index was trading at 13% premium to the S&P 500 Index.
8 Source: MSCI.
9 The Sharpe ratio characterizes how well the return of a portfolio compensates the investor for the risk taken.
10 Indexes are unmanaged and one cannot invest directly in an index. Past performance does not guarantee future results.
Carefully consider the Funds’ investment objectives, risk factors, and charges and expenses before investing. This and other information can be found in the Funds’ prospectuses or, if available, the summary prospectuses, which may be obtained by visiting the iShares Fund and BlackRock Fund prospectus pages. Read the prospectus carefully before investing.
Investing involves risk, including possible loss of principal.
International investing involves risks, including risks related to foreign currency, limited liquidity, less government regulation and the possibility of substantial volatility due to adverse political, economic or other developments. These risks often are heightened for investments in emerging/ developing markets or in concentrations of single countries.
Fixed income risks include interest-rate and credit risk. Typically, when interest rates rise, there is a corresponding decline in bond values. Credit risk refers to the possibility that the bond issuer will not be able to make principal and interest payments.
This material represents an assessment of the market environment as of the date indicated; is subject to change; and is not intended to be a forecast of future events or a guarantee of future results. This information should not be relied upon by the reader as research or investment advice regarding the funds or any issuer or security in particular.
The strategies discussed are strictly for illustrative and educational purposes and are not a recommendation, offer or solicitation to buy or sell any securities or to adopt any investment strategy. There is no guarantee that any strategies discussed will be effective.
The information presented does not take into consideration commissions, tax implications, or other transactions costs, which may significantly affect the economic consequences of a given strategy or investment decision.
Diversification and asset allocation may not protect against market risk or loss of principal.
There can be no assurance that performance will be enhanced or risk will be reduced for funds that seek to provide exposure to certain quantitative investment characteristics (“factors”). Exposure to such investment factors may detract from performance in some market environments, perhaps for extended periods. In such circumstances, a fund may seek to maintain exposure to the targeted investment factors and not adjust to target different factors, which could result in losses.
The iShares Minimum Volatility Funds may experience more than minimum volatility as there is no guarantee that the underlying index’s strategy of seeking to lower volatility will be successful.
Commodities’ prices may be highly volatile. Prices may be affected by various economic, financial, social and political factors, which may be unpredictable and may have a significant impact on the prices of commodities.
TIPS can provide investors a hedge against inflation, as the inflation adjustment feature helps preserve the purchasing power of the investment. Because of this inflation adjustment feature, inflation protected bonds typically have lower yields than conventional fixed rate bonds and will likely decline in price during periods of deflation, which could result in losses. Government backing applies only to government issued securities, and does not apply to the funds.
This material contains general information only and does not take into account an individual’s financial circumstances. This information should not be relied upon as a primary basis for an investment decision. Rather, an assessment should be made as to whether the information is appropriate in individual circumstances and consideration should be given to talking to a financial professional before making an investment decision.
The information provided is not intended to be tax advice. Investors should be urged to consult their tax professionals or financial professionals for more information regarding their specific tax situations.
The Funds are distributed by BlackRock Investments, LLC (together with its affiliates, “BlackRock”).
The iShares Funds are not sponsored, endorsed, issued, sold or promoted by Bloomberg, BlackRock Index Services, LLC, Cohen & Steers, European Public Real Estate Association (“EPRA®”), FTSE International Limited (“FTSE”), ICE Data Indices, LLC, NSE Indices Ltd, JPMorgan, JPX Group, London Stock Exchange Group (“LSEG”), MSCI Inc., Markit Indices Limited, Morningstar, Inc., Nasdaq, Inc., National Association of Real Estate Investment Trusts (“NAREIT”), Nikkei, Inc., Russell or S&P Dow Jones Indices LLC or STOXX Ltd. None of these companies make any representation regarding the advisability of investing in the Funds. With the exception of BlackRock Index Services, LLC, which is an affiliate, BlackRock Investments, LLC is not affiliated with the companies listed above.
Neither FTSE, LSEG, nor NAREIT makes any warranty regarding the FTSE Nareit Equity REITS Index, FTSE Nareit All Residential Capped Index or FTSE Nareit All Mortgage Capped Index. Neither FTSE, EPRA, LSEG, nor NAREIT makes any warranty regarding the FTSE EPRA Nareit Developed ex-U.S. Index or FTSE EPRA Nareit Global REITs Index. “FTSE®” is a trademark of London Stock Exchange Group companies and is used by FTSE under license.
© 2022 BlackRock, Inc. All rights reserved. BLACKROCK, BLACKROCK SOLUTIONS, BUILD ON BLACKROCK, ALADDIN, iSHARES, iBONDS, FACTORSELECT, iTHINKING, iSHARES CONNECT, FUND FRENZY, LIFEPATH, SO WHAT DO I DO WITH MY MONEY, INVESTING FOR A NEW WORLD, BUILT FOR THESE TIMES, the iShares Core Graphic, CoRI and the CoRI logo are trademarks of BlackRock, Inc., or its subsidiaries in the United States and elsewhere. All other marks are the property of their respective owners.
iCRMH0822U/S-2342675
This post originally appeared on the iShares Market Insights.
Editor’s Note: The summary bullets for this article were chosen by Seeking Alpha editors.
Be the first to comment