


bestdesigns/iStock via Getty Images
The cannabis ETFs and MJ
Most of the attention cannabis receives is about individual companies. Individual companies can have compelling stories that are attractive to bold stock pickers who thrive in volatile, high growth sectors and like to swing for the home run. ETFs are not as exciting, yet they can have a useful function. Like individual companies, each cannabis ETF has different characteristics, and it’s important to know what you are buying. This article takes a close look at ETFMG Alternative Harvest (NYSEARCA:MJ), one of the largest and oldest in the sector. MJ distinguishes itself from the others in some important ways, and deserves the attention of anyone interested in this type of investment.
MJ was started in 2015, and is known to many investors because it was the only cannabis ETF for a number of years. It’s one of the largest, as shown in the table below. These five entities contain about 95% of cannabis ETF assets.
| Name (symbol) | Assets (millions USD) | First trade date |
| AdvisorShares Pure US Cannabis ETF (MSOS) | 422 | Sep 2020 |
| ETFMG Alternative Harvest (MJ) | 314 | Dec 2015 |
| AdvisorShares Pure Cannabis ETF (YOLO) | 52 | Apr 2019 |
| Global X Cannabis ETF (POTX) | 48 | Sep 2019 |
| Amplify Seymour Cannabis ETF (CNBS) | 33 | July 2019 |
MJ investment strategy
The first thing to know about ETFs is their investment strategy. Three ETFs in the table above have a stated strategy of active management: MSOS, YOLO, and CNBS. One allocates according to a set of quantitative rules, or passive management: POTX. The MJ website says only that their methodology is to duplicate the Prime Alternative Harvest Index [PAHI]. Is it active or passive?. According to the MJ Fact Sheet, the PAHI is “designed to measure the performance of companies within the cannabis ecosystem benefitting from global medicinal and recreational cannabis legalization initiatives.” To fully understand MJ we must learn how the underlying Prime Alternative Harvest Index is compiled.
The Prime Alternative Harvest Index
The Index is compiled by Prime Indexes, a “partner” of ETF MG. According to its website, Prime Indexes is “a financial research publisher, with a focus on emerging technologies and industries that are undercovered by primary research providers. …Prime Indexes publishes financial information that is based on the principles of intuitive criteria; common sense factors to help narrow down the available choices. Our indexes can help investors of all types by identifying and screening companies in emerging industries. The end result is intuitive information we can all understand.” They use a modified market cap weighting scheme and reconstitute four times a year. Using intuitive criteria and common sense factors indicates management is active, not passive.
What’s in the PAHI?
To get clarity about what MJ is we need to look at the composition of the index itself. All 34 holdings can be found here on the website. The top 25 of 34 holdings are in the table below. Canadian operators represent over 40%.
| Component Name | Ticker |
Weight |
| PRIME US ALTERNATIVE HARVEST INDEX | USHRVST | 19.77% |
| SUNDIAL GROWERS INC | SNDL | 10.08% |
| TILRAY BRANDS INC | TLRY | 7.81% |
| CANOPY GROWTH CORP | CGC | 7.78% |
| CRONOS GROUP INC | CRON | 7.72% |
| GROWGENERATION CORP | GRWG | 4.56% |
| ORGANIGRAM HOLDINGS INC. | OGI | 4.18% |
| CHICAGO ATLANTIC REAL ESTATE FINANCE INC | REFI | 4.10% |
| AFC GAMMA INC | AFCG | 3.98% |
| AURORA CANNABIS INC | ACB | 3.42% |
| INCANNEX HEALTHCARE LTD | IHL | 2.67% |
| INTERCURE LTD | INCR | 1.90% |
| HIGH TIDE INC | HITI | 1.88% |
| INNOVATIVE INDUSTRIAL PROPER | IIPR | 1.85% |
| WM TECHNOLOGY INC | MAPS | 1.59% |
| CHARLOTTES WEB HOLDINGS INC | CWEB | 1.49% |
| HYDROFARM HOLDINGS GROUP INC | HYFM | 1.25% |
| VECTOR GROUP LTD | VGR | 1.24% |
| SCOTTS MIRACLE-A | SMG | 1.22% |
| PHILIP MORRIS INTERNATIONAL | PM | 1.20% |
| MATIV INC | MATV | 1.19% |
| IMPERIAL BRANDS PLC | IMB | 1.08% |
| JAZZ PHARMACEUTICALS PLC | JAZZ | 1.08% |
| TURNING POINT BRANDS INC | TPB | 1.04% |
| SCANDINAVIAN TOBACCO GROUP A | STG | 1.03% |
The top holding at 19.77% is another Prime Index, the US Alternative Harvest Index. It’s 15 holdings heavily weighted to large MSOs and Innovative Industrial Properties (IIPR):
| Component Name | Ticker | Weight |
| INNOVATIVE INDUSTRIAL PROPER | IIPR | 27.65% |
| CURALEAF HOLDINGS INC | CURA | 17.92% |
| GREEN THUMB INDUSTRIES INC | GTII | 17.36% |
| TRULIEVE CANNABIS CORP | TRUL | 9.80% |
| VERANO HOLDINGS CL A SUB ORD | VRNO | 9.21% |
| CRESCO LABS INC-SUBORDINATE | CL | 4.37% |
| GROWGENERATION CORP | GRWG | 2.98% |
| AFC GAMMA INC | AFCG | 2.95% |
| COLUMBIA CARE INC | CCHW | 2.62% |
| MARIMED INC | MRMD | 1.30% |
| WM TECHNOLOGY INC | MAPS | 1.06% |
| CHARLOTTES WEB HOLDINGS INC | CWEB | 0.97% |
| HYDROFARM HOLDINGS GROUP INC | HYFM | 0.75% |
| MEDICINE MAN TECHNOLOGIES INC | SHWZ | 0.72% |
| BRIGHT GREEN CORP | BGXX | 0.33% |
To get a full picture of MJ, which replicates Alternative Harvest Index, we take the US Index holdings, multiply them by the 19.77% weighting of the US Index, and insert into the main Index. So, for example, Curaleaf is 19.04% of the US index. Multiply 19.04% times the 20.81% weighting of the US index, and Curaleaf is 19.04 x 20.81 = 3.96% of the large index.
The result of these calculations on all holdings reveals an ETF with the following characteristics:
- Canadian operators: 44.3%
- Financial (REITS, lenders, etc.): 15.8%
- US MSOs: 12.1%
- Adjacent (supplies, equipment, marketing, etc.): 10.5%
- Tobacco: 7.7%
- Pharma: 4.2%
Note: For all ETFs discussed, the allocation total does not add up to 100%. There are various reasons, such as cash levels, collateral, and more. The important comparison is the relative allocation to each subsector within and between ETFs.
The table below compares the relative allocation of the six industry subsectors in five popular ETFs. MJ put its greatest emphasis on Canadian operators and finance, and the least on pharmaceutical ventures. YOLO emphasized Canada and MSOs most, and adjacent companies least. CNBS emphasized MSOs and Canada most, and finance least. MSOS, of course, had virtually all its assets in US MSOs.
| MJ | YOLO | CNBS | MSOS | POTX | |
| Canada | 1 | 1 | 2 | 0 | 1 |
| Finance | 2 | 4 | 5 | 0 | 2 |
| MSO | 3 | 2 | 1 | 1 | 0 |
| Adjacent | 4 | 5 | 4 | 0 | 4 |
| Tobacco | 5 | 0 | 0 | 0 | 0 |
| Pharma | 6 | 3 | 3 | 0 | 3 |
The table below shows the allocations of these subsectors in each ETF.
| MJ | YOLO | CNBS | MSOS | POTX | |
| Canada % | 44.3 | 34.8 | 23.9 | 0 | 59.0 |
| Finance % | 15.8 | 11.8 | 9.0 | 0 | 20.8 |
| MSO % | 12.1 | 26.9 | 34.3 | 99 | 0 |
| Adjacent % | 10.5 | 4.7 | 9.5 | 0 | 3.6 |
| Tobacco % 7.7 | 7.7 | 0 | 0 | 0 | 0 |
| Pharma % | 4.2 | 17.2 | 10.4 | 0 | 8.1 |
Comparing Cannabis ETF performance
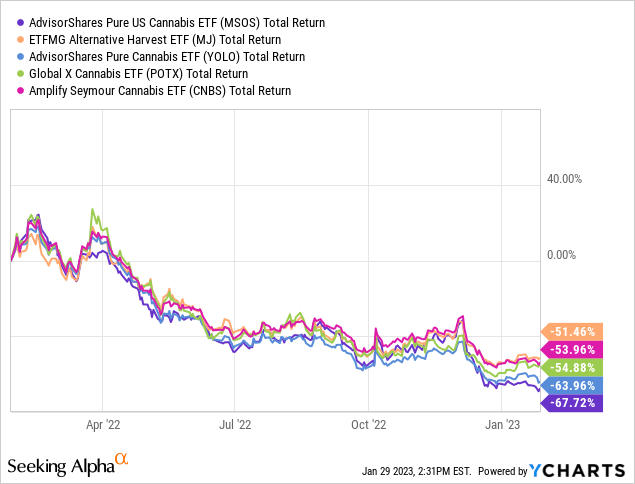
The 12 month total return of MJ, YOLO, MSOS, POTX and CNBS are shown in the table below. MJ had the best performance, and MSOS the worst. The same order was seen in 24 and 36 month periods, although the magnitude of differences was less.
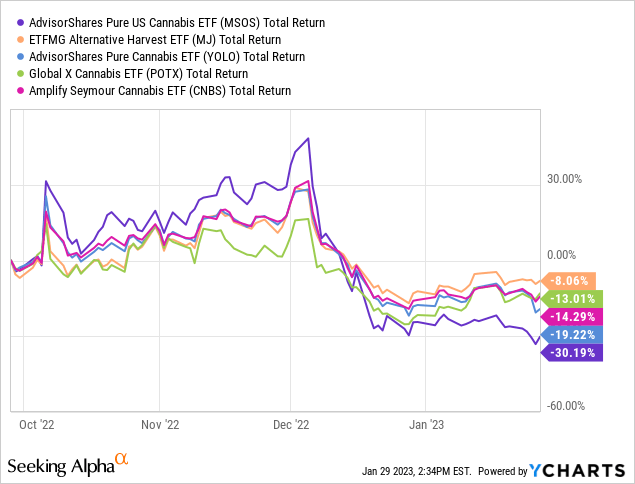
The chart below shows total return for the five ETFs from July 1, 2022 to date. This was the period when the sector got a boost from the potential passing of the SAFE Banking Act. As expected, MSO-heavy MSOS rose the most, then declined the most when SAFE got deep-sixed.
What accounts for the outperformance of MJ? It’s difficult to draw conclusions based on current holdings, since the composition of most ETFs changes over time. However, relative allocations do tend to reflect the general strategy of each fund. On this basis, MJ may have benefited from high allocations to adjacent companies and tobacco, which have held up relatively well. On the other hand, low allocation to MSOs may have helped. MSOs have been hit very hard (MSOS was the worst performer). POTX has no exposure to MSOs, but as a passively managed ETF POTX is a special case. Finally, as the oldest ETF, MJ has a depth of experience the others do not. Perhaps they learned lessons along the way that can only come from experience. For example, they were the only ETF around during the initial Canadian euphoria, which offered many lessons.
MJ as an investment
ETFs can be a conservative strategy, and for conservative investors MJ is a reasonable choice. It’s relatively good performance over time cannot be ignored. If cannabis stocks continue in the doldrums for the foreseeable future, it may continue to do well compared to the other ETFs. If there are positive developments in the sector, MJ will participate in any upside, although based on current holdings not to the same degree as others.
In the long run, as cannabis fulfills its promise, MJ may be surpassed by other ETFs (and stocks). The same broad exposure to the sector that insulated it from the worst of the decline means there is less upside when the sector turns back up, at least based on current holdings. There’s a hint of this in the six month chart above, when during the SAFE banking saga US-centric MSOS was the clear winner.
Current conditions in the cannabis industry are the worst investors have ever experienced. Just recently on January 26 a negative FDA opinion on CBD caused another drop in stock prices. It’s a time of trial for investors, but is it a time to give up? The strong prospects for cannabis in the long run have not changed. According to one recent report, global sales in 2022 were $22.7 billion, and with a 24.3% CAGR will reach $82.3 billion in 2027. Many changes in the industry will occur during this period, and it’s up to investors to position themselves to take advantage as the industry grows and matures. Many investors will find a role for ETFs in their formula for cannabis success.
Be the first to comment