

Adam Gault/OJO Images via Getty Images
Markets can appear irrational. Traders try to anticipate what will happen next. Sometimes they are right, sometimes wrong.
We are now officially in a bear market, a decline of 20% from the highs. We all know the reasons, but we don’t all know how to tell when the bear market is over, so I’ll give you some tried and true indications. But the best advice is that being late entering after the market stops going down is safer than being too early and wrong.
Here are the indicators:
- The trend turns up
- Volume increases with the new upward direction
- Prices move up when the economic report is clearly negative
- Price and volatility patterns
Recent Bear Markets
There have been three bear markets, not including this one, since 2000:
- The end of the internet bubble, 2000-2003
- The financial crisis, 2008-2012
- The trade war, 2019-2020
Chart 1 shows those three periods highlighted on an SPY chart (the S&P ETF). The area highlighted in green is the drawdown and the highlighted red area is the time to recovery.
Data source: CSI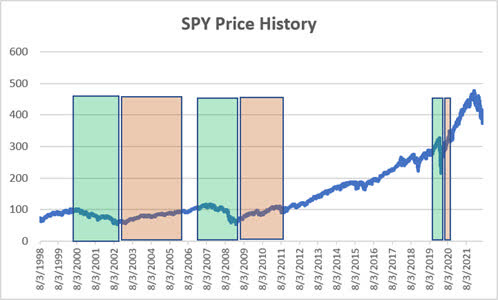
Chart 1. SPY price history with bear markets in green and recovery period in red.
The Trend Turns Up
I’m going to use 2008 as an example because it was an economic downturn, in a way similar to now.
The safest indicator is when a long-term trend turns up. Technical analysts prefer using the Golden Cross, the 50-day moving average crossing above the 200-day moving average. Chart 2 shows that it happened after a rally of about 34% from the lows in 2009. While the 50-day average turned up much sooner, it also has many false signals. Combining it with the 200-day average makes it more reliable at the cost of a longer delay.
Data source: CSI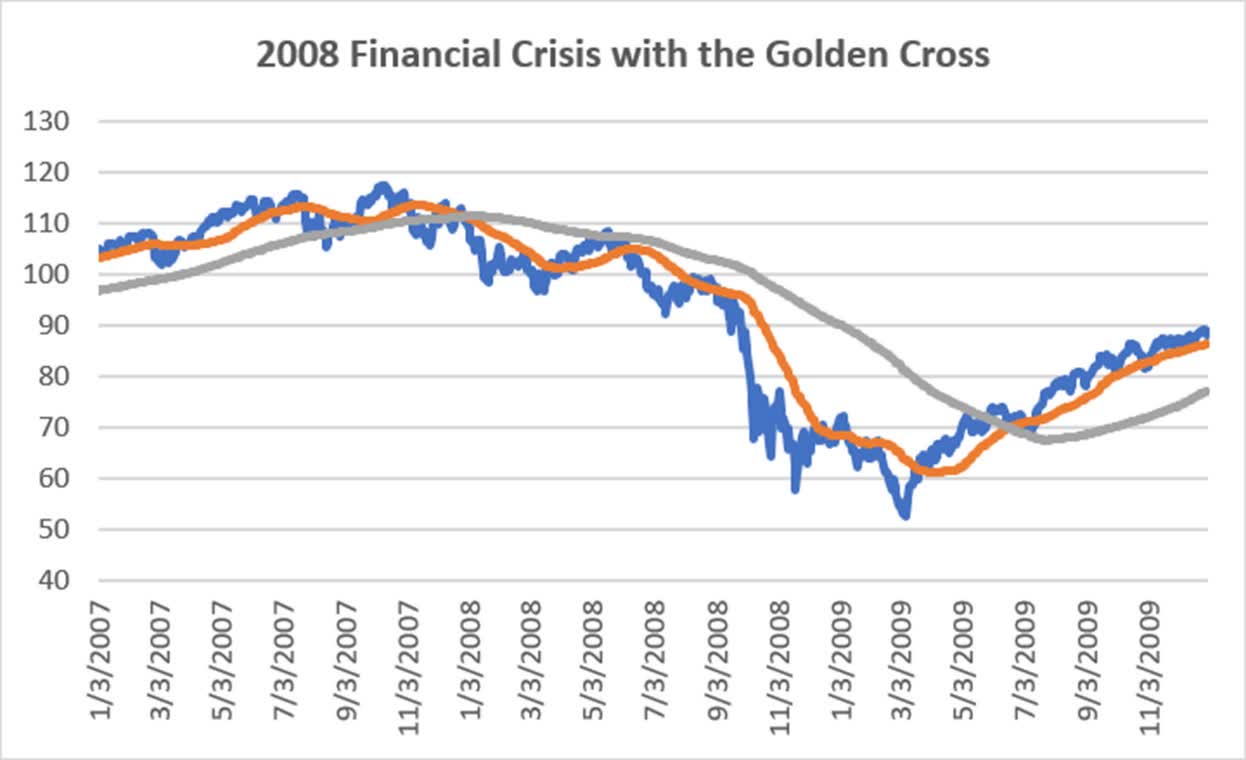
Chart 2. The “Golden Cross” is where the 50-day average crosses above the 200-day average. It is shown during the Financial Crisis of 2008.
I have found that the S&P trend is most reliable using a 110-day average. It is smoother than the 50-day average and much faster to respond than the 200-day average. It gave a buy signal 25% above the lows (Chart 3).
Note that the trendline does not turn up anywhere near the bottom of the move. Trends work because they lag prices and do not get in and out on small pullbacks. They tend to capture the middle of the move and have fewer false signals.
Data source: CSI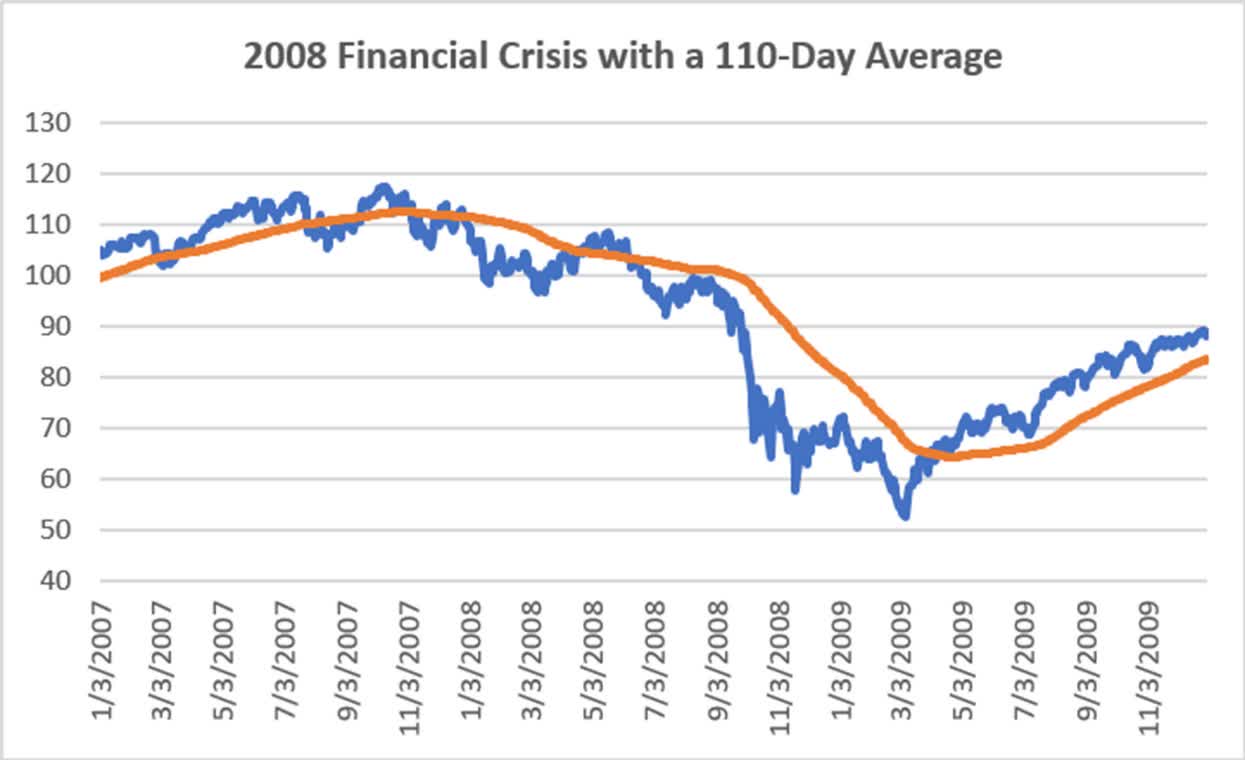
Chart 3 shows SPY during the financial crisis of 2008 with a 110-day average.
Has the trend turned up?
As of Tuesday, June 14, none of the trends have turned up. The SPY price was 373.87, the 50-day average 415.80, the 200-day was 440.55, and the 110-day was 430.50. Even while prices move higher, the averages move lower. SPY would need to go straight up to about 410, a rally of 10% from here.
No, we are still in a downtrend.
Volume Increases with the Upwards Price Move
Most analysts like to see increasing volume with a new trend. Even Charles Dow recognized the pattern. Increasing volume serves as a confirmation that investors agree with the move. But volume is erratic and you need to look at more than a few days to see the pattern. Chart 4 shows that volume increased after the start of the Financial Crisis and again as the market turned up. Once the move is underway, it goes back to being normal. It’s tricky that way.
Data source: CSI
Chart 4. The Financial Crisis with a 110-day average and volume in gray.
Has volume recently increased with an upside move? We would first need to find where prices are going up. We can’t do that.
As we can see, interpreting volume is an imperfect art. Chart 5 shows increasing volume on the first leg down in late January. The rallies in February, April, and June will be interpreted as weak because volume was lower; therefore, they are not interpreted as supporting a change of direction. So, no, volume is not a help deciding if this is the end of the bear market.
Data source: CSI
Chart 5. SPY prices from January 2022 with volume.
A Contrary Move
A consistent indication of a change of sentiment is when a clearly bearish report comes out and the market moves higher. It usually means that all the information was already in the market and the report was not as negative as expected. But do not rush into a trade.
On Wednesday, June 15, the Fed announced a rate hike of 75 bp, the largest in many years. It also said that it would be raising rates significantly in the next two meetings. The market traded up, then down, the closed higher. Yields fell slightly. How can that happen?
Reports show that 75 bp was already in the market, but not the future rate hikes. How can another increase of 1.5% be positive for the economy? Traders may have reacted positively because the Fed was taking control, but futures increases will put pressure on the economy and stock prices.
A contrary move is important, but only if it reflects all the forward news.
Price and Volatility Patterns
Investors are wary of losing more money after a prolonged bear market. They are reluctant to commit, which means that money enters the market slowly, perhaps prolonging a new bull market. That seems to have been the case after the financial crisis of 2008.
Consolidation is common at the lows of a bear market. It can take many shapes, but essentially prices move sideways on low volume and low volatility. Investors have given up. While it does not happen in one day, we can still call it capitulation.
Chart 6 shows the 20-day annualize volatility for 2022. Traders see breaching the level of 0.30 as high volatility likely to reverse. Volatility is now testing that level but is still high. That does not indicate that traders are giving up and standing aside.
Data source: CSI
Chart 6. The 20-day annualized volatility of SPY from January 2022.
A Test of the Lows and Other Indications
A test of the recent lows, a double bottom, an extended rectangular formation, a bear trap, and some other patterns would all indicate a failure to go lower or a consolidation at the lows. None of that has happened yet.
Are We There Yet?
As you can tell, there are no indicators that say we are at the bottom of the bear market. We could be there, but we won’t know until some of the indicators that I’ve mentioned turn positive. It is too soon to tell and too risky to go long without some confirmation.
One simple approach to picking the bottom is to wait for any trend to turn up. It could even be a 5-day moving average. You can then exit if that trend turns down. Or, you can buy on any rally with a stop at the previous lows. Either of these methods give you a change to enter early but with the risk clearly identified. But short-term indicators are notoriously unreliable.
Having traded for a long time, my choice would be to wait for the longer-term trend to turn up, a likely sign that the bear market is truly over.
Be the first to comment