

alvarez/E+ via Getty Images Danaher
In this analysis, we highlight the shift of Danaher Corp. (DHR) from an industrial conglomerate to a healthcare focused company through acquisitions over the past decade and forecasted the organic (excluding COVID-19 related) revenue growth. Moreover, we analyzed the company’s ability to generate recurring revenue and the positive impact on its gross margins. Based on this, we forecasted the COGS to decrease. Additionally, we also looked into Danaher Business System and the significant restructuring the company undertakes leading to R&D and SG&A costs remaining stable. However, one of the risks we see is the high net debt due to the acquisition of Cytiva in 2020. In the valuation, we used a DCF model with an industry average EV/EBITDA of 21.41x to obtain an upside of -1.22%.
Shift to Healthcare for Better Growth Opportunities
Initially Danaher was an industrial conglomerate. Since 2002, the company has been focusing on the healthcare sector as majority of the acquisitions were healthcare related. According to Danaher, more than 50% of the company’s current revenue was acquired in the past 7 years. 4 significant acquisitions in the past decade are shown below.
Source: Danaher
The US national healthcare spending accounted for 17.6% of US GDP in 2019 signaling a strong market even prior to the pandemic. We believe this strong healthcare spending even in 2019 is beneficial for Danaher as they continue to focus more on the healthcare sector.
We forecasted Danaher’s growth in the various segments the company operates in excluding the COVID-related revenue. We compiled the market CAGR provided by various research companies due to the variability in market projections. We took an average of the market CAGR projections by the various research companies to obtain a reliable estimate.
Meticulous Research, Mordor Intelligence, 360 Market Updates, Research and Markets, PwC, Market Research Future, Markets and Markets, Grand View Research, Allied Market Research, Expert Market Research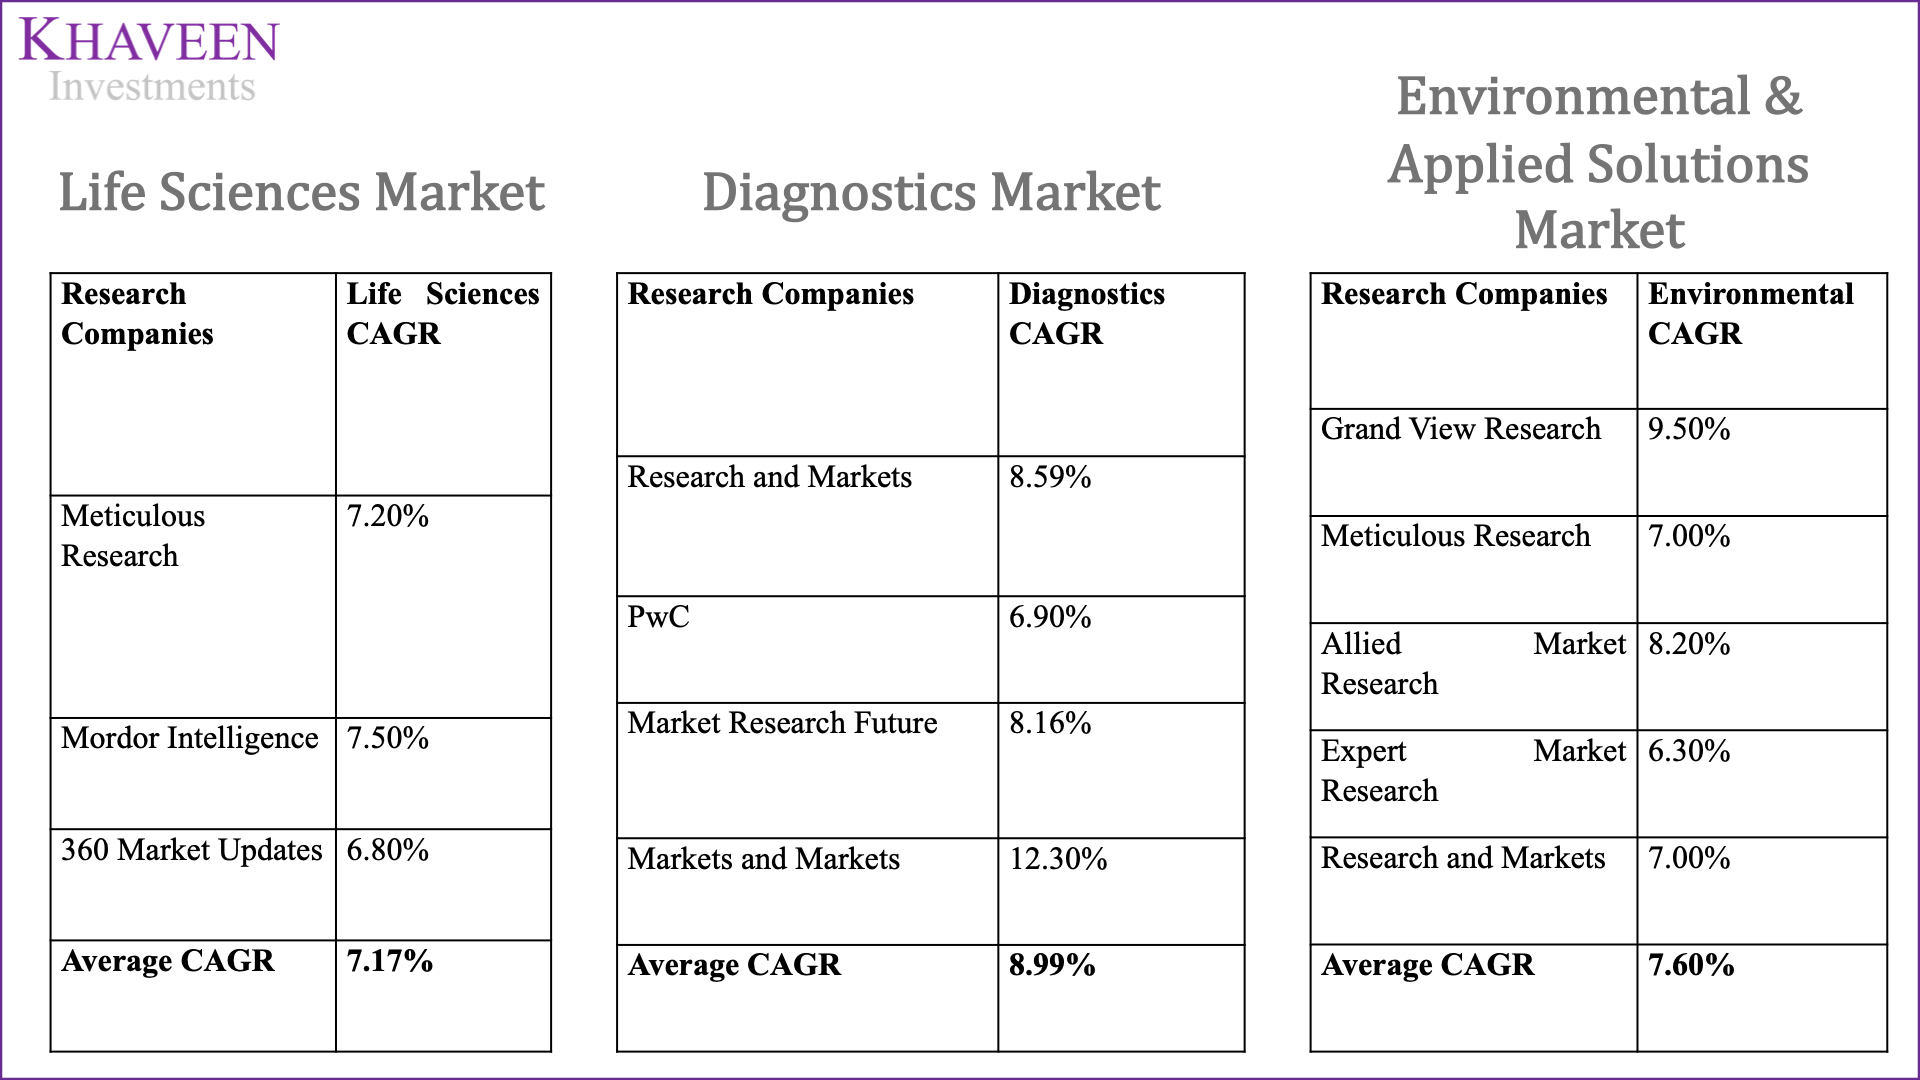
Source:
Life Sciences Market: Meticulous Research, Mordor Intelligence, 360 Market Updates
Diagnostics Market: Research and Markets, PwC, Market Research Future, Markets and Markets
Environmental & Applied Solutions Market: Grand View Research, Meticulous Research, Allied Market Research, Expert Market Research, Research and Markets
For 2021, we annualized 9-month period ended results to obtain the full year forecasted revenue. From 2022 onwards, we forecasted revenues based on the market CAGR of each segment. Overall, excluding COVID, we forecast Danaher organically growing at an average of 7.80% until 2025.
|
Segments ($ mln) |
2019 |
2020 |
2021F |
2022F |
2023F |
2024F |
2025F |
|
Life Sciences |
6,951 |
9,926 |
12,549 |
13,449 |
14,413 |
15,445 |
16,552 |
|
Growth (%) |
7.42% |
42.80% |
26.43% |
7.17% |
7.17% |
7.17% |
7.17% |
|
Diagnostics |
6,561 |
6,510 |
7,318 |
7,976 |
8,693 |
9,474 |
10,326 |
|
Growth (%) |
4.84% |
-0.78% |
12.43% |
8.99% |
8.99% |
8.99% |
8.99% |
|
Environmental & Applied Solutions |
4,399 |
4,305 |
4,573 |
4,921 |
5,295 |
5,698 |
6,131 |
|
Growth (%) |
1.83% |
-2.14% |
6.23% |
7.60% |
7.60% |
7.60% |
7.60% |
|
Total Revenue (excluding COVID) |
17,911 |
20,741 |
24,441 |
26,346 |
28,401 |
30,617 |
33,009 |
|
Growth (%) |
15.80% |
17.84% |
7.79% |
7.80% |
7.81% |
7.81% |
Source: Danaher, Khaveen Investments
Recurring Revenue Contributes to Higher Gross Margins
The company’s recurring revenue is derived from maintenance services and replacement parts provided for its previously sold equipment. According to Danaher, its recurring revenue increased from 45% in 2015 to 75% in 2021. This growth in recurring revenue indicates the company has been able to install more equipment in the past 6 years. The estimated useful life of medical devices is 7 to 10 years.
We analyzed the correlation between recurring revenue, non-recurring revenue, and gross margins from Q1 2018 to Q3 2021. We see a strong positive correlation between recurring and non-recurring revenue at 0.85. This indicates that recurring revenue is heavily reliant on the company being able to sell equipment. Furthermore, the correlation between both revenue types and gross margins provides us with interesting insights into the impact on margins. The correlation between recurring revenue and gross margin is 0.95 whereas the correlation between non-recurring revenue and gross margin is only 0.73. Although both recurring and non-recurring revenue have a positive correlation to the gross margins of the company, the recurring revenue is significantly higher and closer to 1 indicating an extremely strong positive relation. Hence, we believe Danaher’s ability to sell equipment will lead to higher recurring revenue which will lead to potentially higher gross margins in the future.
|
Correlation Matrix |
Recurring Revenue |
Non-Recurring Revenue |
Gross Margin |
|
Recurring Revenue |
1.00 |
||
|
Non-Recurring Revenue |
0.85 |
1.00 |
|
|
Gross Margin |
0.95 |
0.73 |
1.00 |
Source: Khaveen Investments
Looking at the 4-year CAGR of non-recurring revenue for the 3 segments of Danaher, we see life sciences is the highest at 15.78%, followed by diagnostics at 4.71%, and environmental and applied solutions at -1.40%. This indicates Danaher has been able to sell more life sciences equipment in the past 4 years while the environmental and applied segments have been selling around the same number of equipment each year. We believe, the higher non-recurring CAGR of the life sciences segment is supported by higher sales due to COVID-19 and the acquisition of Cytiva in 2020. This observation is also reflected in the higher 4-year recurring revenue CAGR for the life sciences segment at 25.79%. Based on our organic revenue forecasts for the 3 segments we believe Danaher will be able to continue selling equipment to customers in the future and generate recurring revenue as well which positively affects gross margins.
|
Segment 4-Year CAGR |
Non-Recurring Revenue |
Recurring Revenue |
|
Life Sciences |
15.78% |
25.79% |
|
Diagnostics |
4.71% |
11.33% |
|
Environmental & Applied Solutions |
-1.40% |
3.79% |
Source: Danaher, Khaveen Investments
We also identified as non-recurring revenue decreased in the past 2 years, the COGS also decreased 94.90%, on average.
Given our assumptions that COVID-19 revenue will vanish year-on-year, we believe that this will contribute to the recurring revenue percentage of total sales. For 2022 revenue, we forecasted COVID related revenue based on company guidance of $2 bln backlog for vaccine-related revenue and 45 mln tests in terms of diagnostics-related revenue, which is expected to contribute an additional $1.6 bln in revenue. For 2022, following management guidance we expect $3,608 mln in COVID-19 related revenue. From 2023 onwards, we tapered down COVID-19 related revenue based on the publicly-stated vaccination targets by countries. Although the vaccination target by country ends in 2023, we projected until 2024 since the targets do not include booster doses.
|
Segment ($ mln) |
2020 |
2021F |
2022F |
2023F |
2024F |
2025F |
|
COVID-19 Related |
1,543 |
3,966 |
3,608 |
2,706 |
1,353 |
– |
|
Growth (%) |
0.00% |
156.93% |
-9.01% |
-25.00% |
-50.00% |
-100.00% |
|
COVID YoY Revenue Reduction |
(2,422) |
357 |
902 |
1,353 |
1,353 |
Source: Danaher, Khaveen Investments
- We forecasted the recurring and non-recurring revenues for each segment (Life sciences, Diagnostics, and Environmental & Applied Solutions) by multiplying our organic revenue forecast by the percentage of recurring and non-recurring revenues from the respective segments.
- To obtain total recurring and non-recurring revenue forecast, we factored in the reduction of COVID related revenue from the non-recurring revenue.
|
Revenues |
2018 |
2019 |
2020 |
2021F |
2022F |
2023F |
2024F |
2025F |
|
Recurring ($ mln) |
11,684 |
12,307 |
15,978 |
21,091 |
22,312 |
23,583 |
24,596 |
25,366 |
|
Non-Recurring ($ mln) |
5,365 |
5,604 |
6,306 |
7,316 |
7,642 |
7,524 |
7,375 |
7,643 |
|
Recurring as % of Total Revenue |
68.53% |
68.71% |
71.70% |
74.25% |
74.49% |
75.81% |
76.93% |
76.85% |
|
Non-Recurring as % of Total Revenue |
31.47% |
31.29% |
28.30% |
25.75% |
25.51% |
24.19% |
23.07% |
23.15% |
|
Total Revenue ($ mln) |
17,049 |
17,911 |
22,284 |
28,407 |
29,954 |
31,107 |
31,970 |
33,009 |
Source: Danaher, Khaveen Investments
Our forecast shows recurring revenue as a percentage of total revenue growing from 68.53% in 2018 to 76.85% in 2025. Based on the previous COGS and non-recurring growth correlation of 94.90%, we project COGS to decrease to 29.78% of revenue in 2025 as the percentage of recurring revenue rises. This results in the gross margins increasing to 64.33%.
|
COGS Growth Forecast |
2020 |
2021F |
2022F |
2023F |
2024F |
2025F |
|
Non-Recurring Revenue Growth (a) |
-2.99% |
-2.54% |
-0.24% |
-1.32% |
-1.12% |
0.09% |
|
COGS Growth (b) |
-3.62% |
-1.75% |
-0.23% |
-1.26% |
-1.06% |
0.08% |
|
COGS Growth over Non-Recurring Revenue Growth (c) |
120.99% |
68.80% |
94.90% |
94.90% |
94.90% |
94.90% |
|
COGS as % of Revenue |
34.00% |
32.25% |
32.02% |
30.76% |
29.70% |
29.78% |
|
Gross Margin (%) |
58.03% |
60.39% |
61.20% |
62.81% |
64.14% |
64.33% |
b = a * c
Source: Danaher, Khaveen Investments
Stable Margins Maintained Despite Restructuring
Apart from the high growth healthcare sector, we analyzed Danaher’s business model. The company’s business model relies on the Danaher Business System which aims to improve operations of the company. Based on the 2020 annual report, the company conducts significant restructuring of the business to work on its cost structure which also includes integrating the businesses it acquires. We analyzed the impact of these restructuring activities based on Danaher’s operating costs (R&D and SG&A) in the past decade to determine the fluctuations experienced through the many acquisitions. The chart below shows the operating cost as a percent of total cost remaining stable in the past decade.
Danaher, Khaveen Investments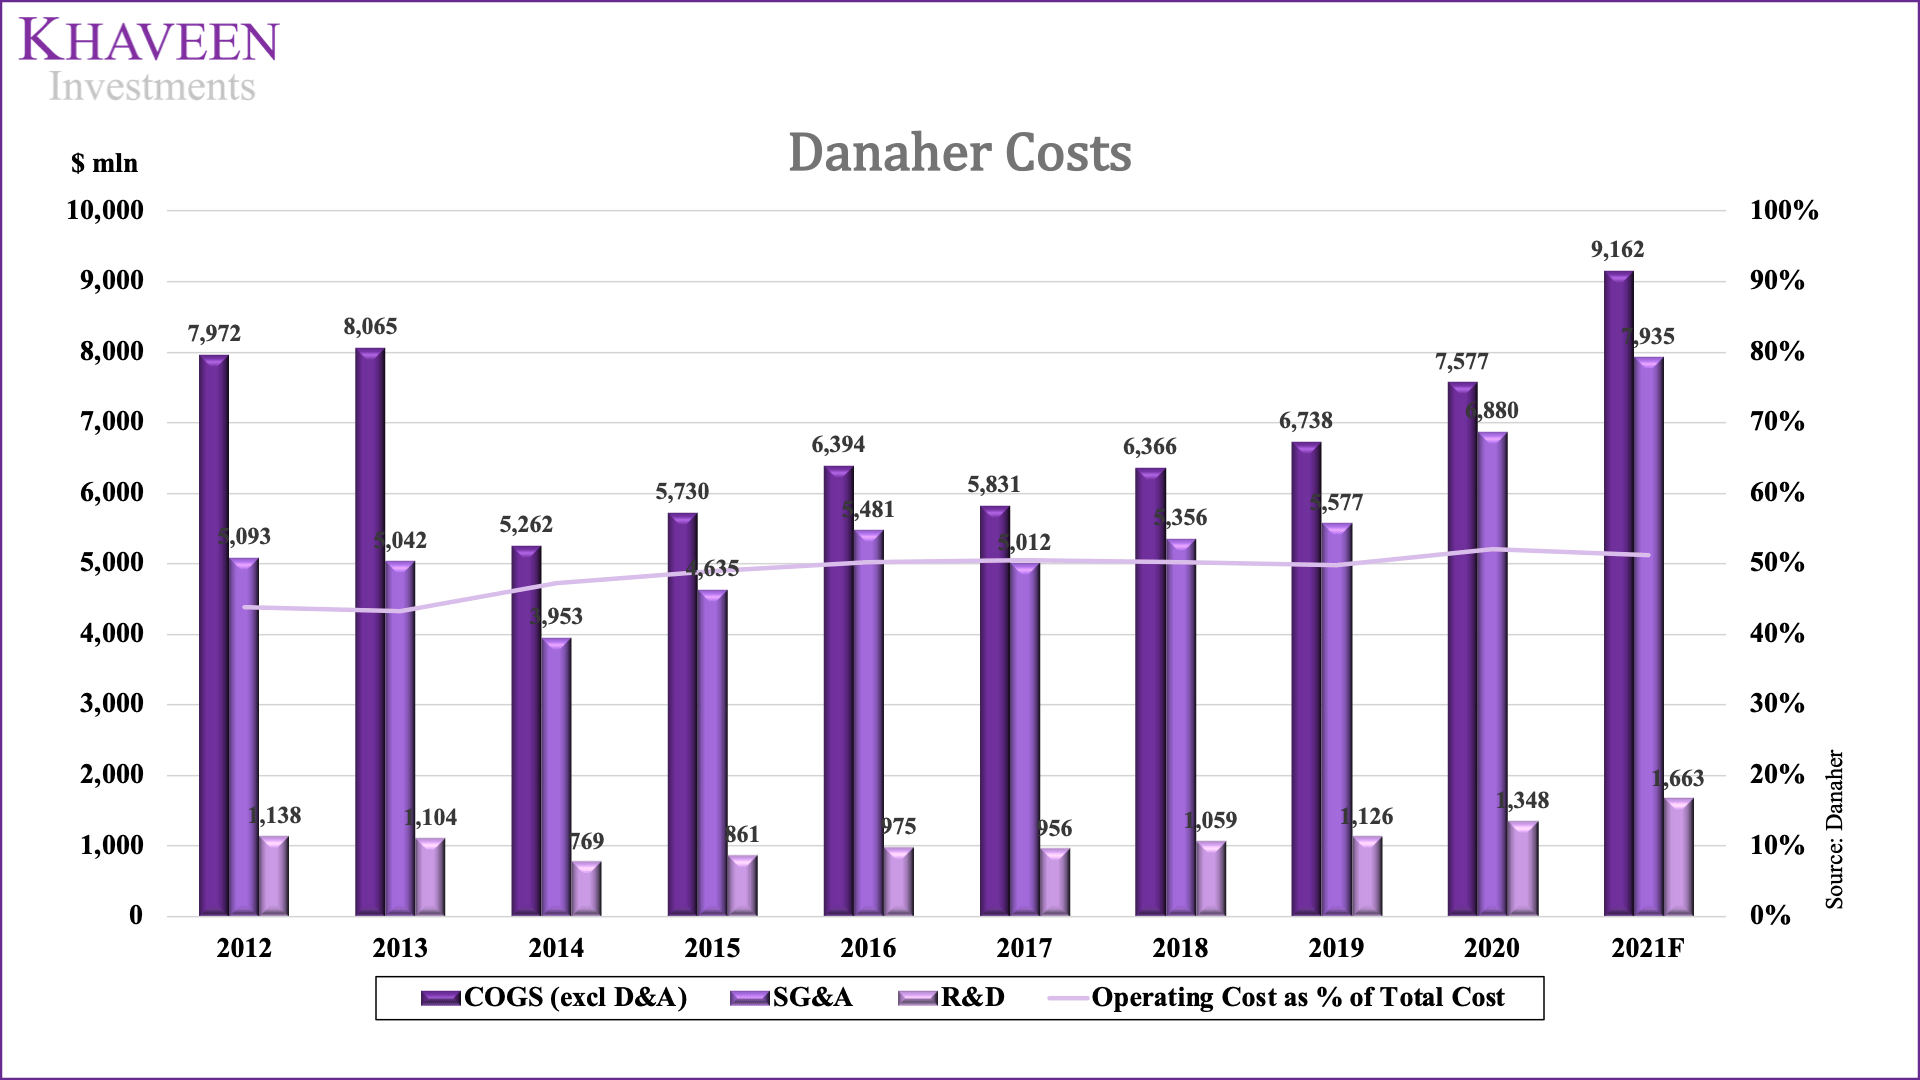
We believe the restructuring activities conducted by Danaher has helped the company keep its costs stable. Based on this, we forecasted the R&D and SG&A cost as a percent of revenue to remain at the 2021 level of 5.85% and 27.94%, respectively.
|
% of Revenue |
2019 |
2020 |
2021F |
2022F |
2023F |
2024F |
|
R&D |
6.29% |
6.05% |
5.85% |
5.85% |
5.85% |
5.85% |
|
Growth (%) |
1.21% |
-3.78% |
-3.22% |
0.00% |
0.00% |
0.00% |
|
SG&A |
31.14% |
30.87% |
27.94% |
27.94% |
27.94% |
27.94% |
|
Growth (%) |
-0.89% |
-0.85% |
-9.52% |
0.00% |
0.00% |
0.00% |
Source: Danaher, Khaveen Investments
Danaher’s 5-year average revenue growth is 9.64%. The company’s average 5-year gross and net margins is 56.04% and 15.98%, respectively.
Danaher, Khaveen Investments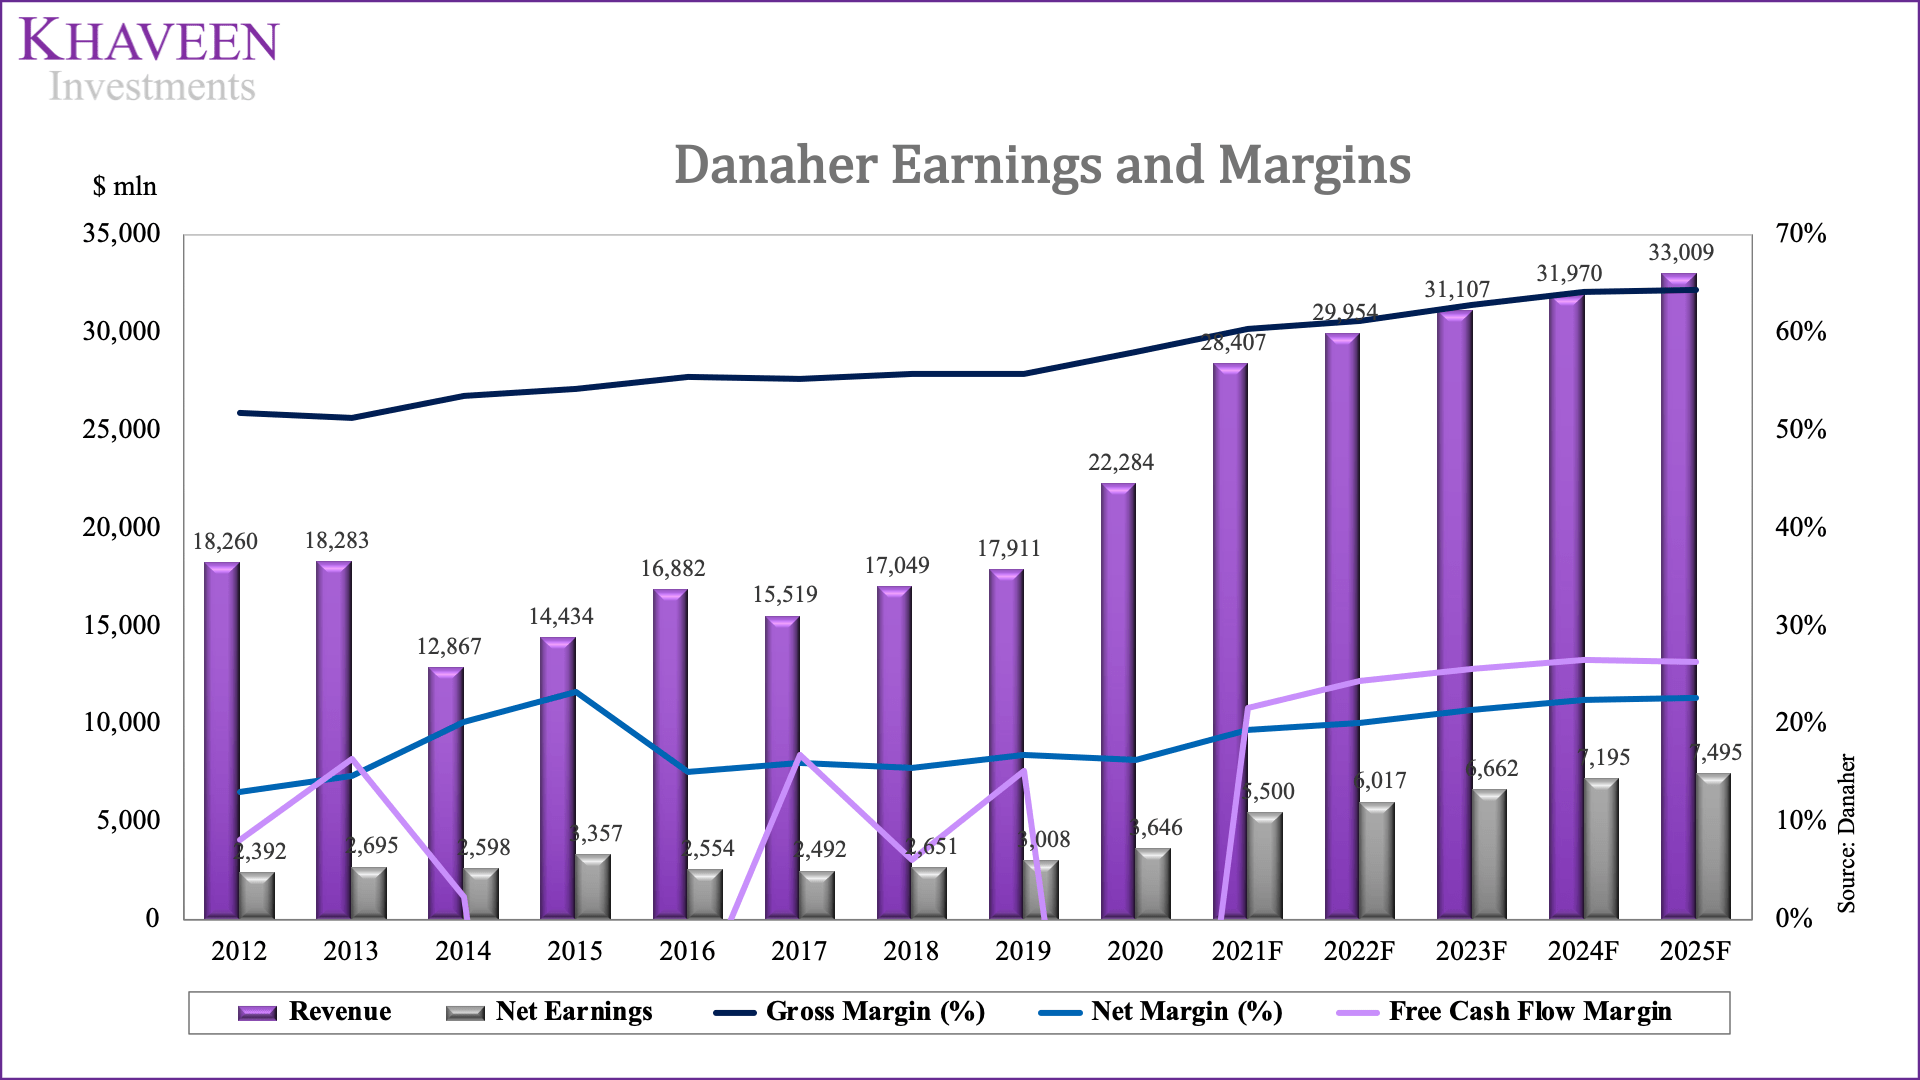
Risk: High Net Debt of $22.6 bln
Danaher’s net debt has increased from $10.6 bln in 2012 to $25 bln in 2021. This is due to the company’s constant acquisitions to focus more on the healthcare sector. We see the cash to debt ratio significantly decrease to 0.03 in 2015 due to the acquisition of Pall for $13.8 bln. In 2019, the cash to debt ratio experienced a sudden increase because the company spun off its dental segment as Envista. However, in 2020 the ratio again decreased significantly to 0.18 due to the acquisition of Cytiva from General Electric for $21.4 bln. Currently the company has high net debt of $22.6 bln. We believe this will limit the company’s ability to conduct any significant M&A in short term. Our model forecasts the company’s cash-to-debt ratio to return to pre-Cytiva acquisition levels only by 2024.
Danaher, Khaveen Investments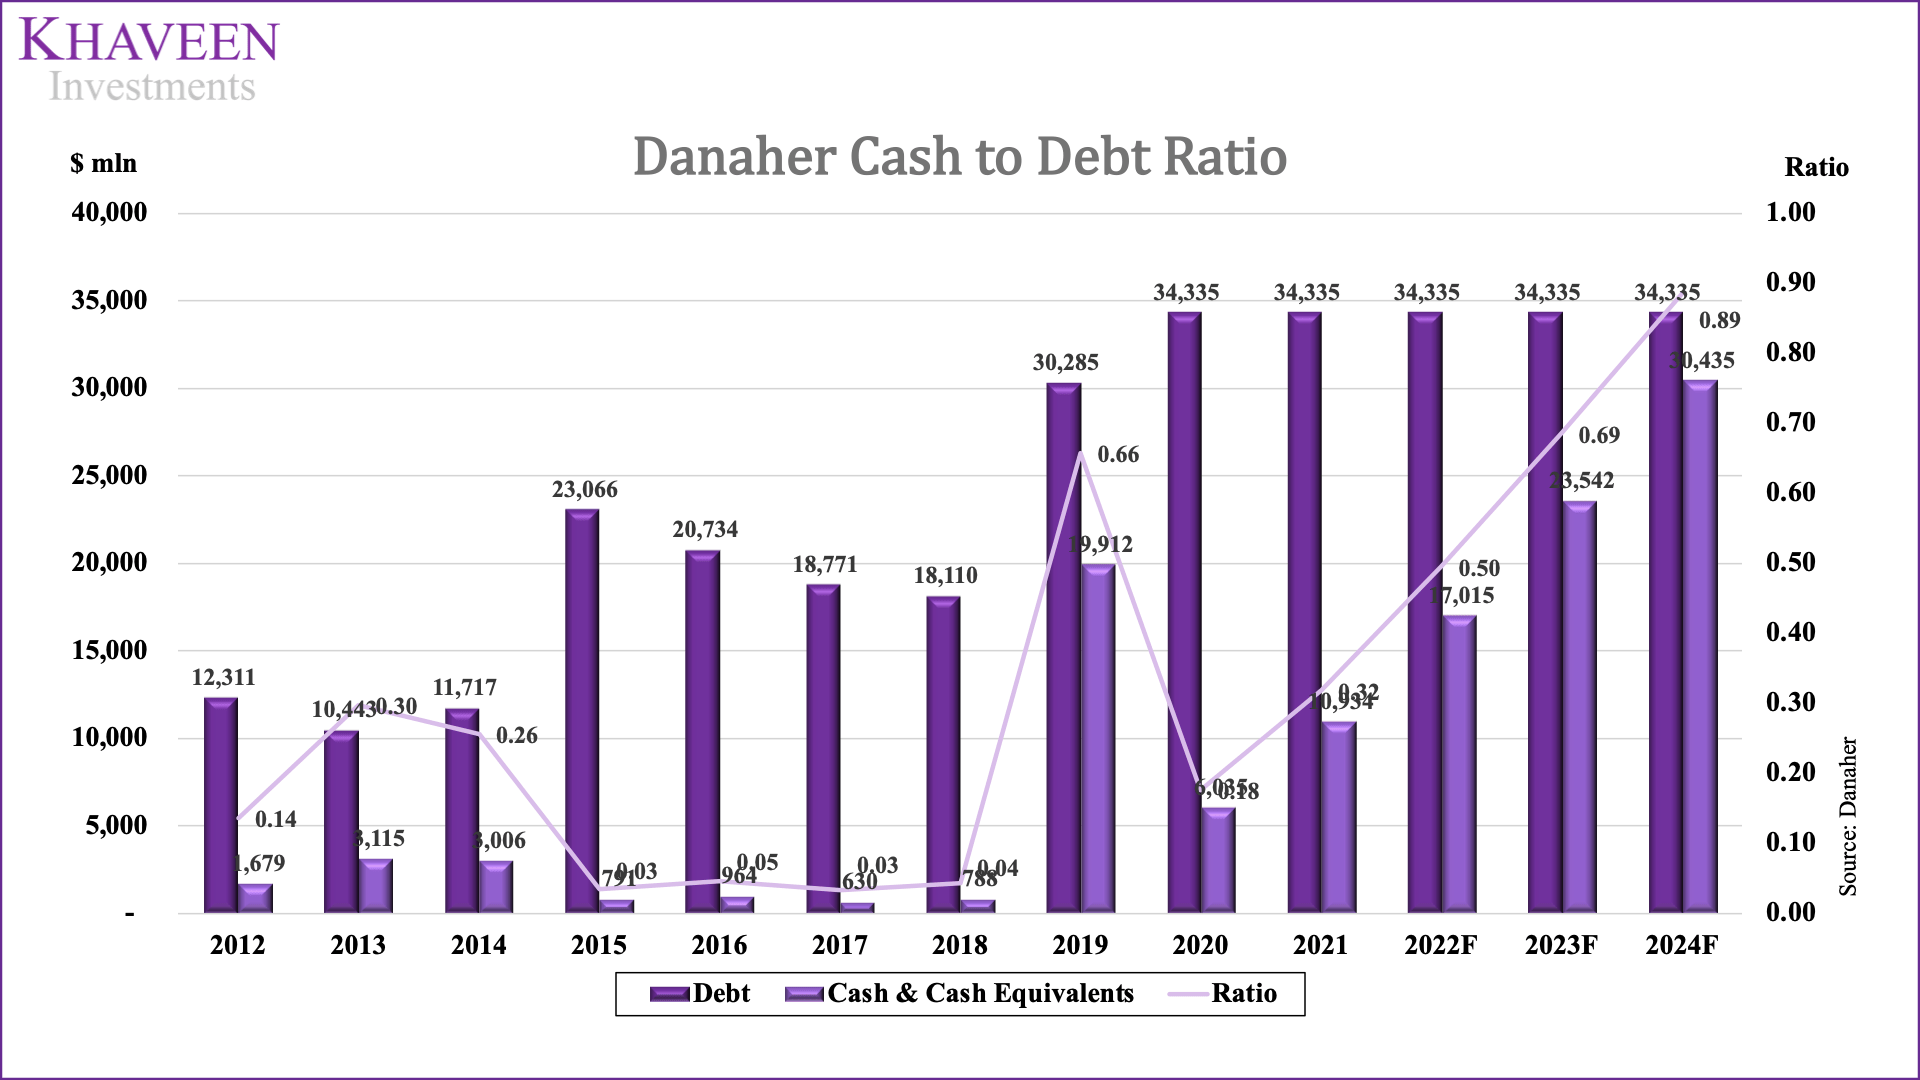
Valuation
The average 5-year FCF margin is -7.99%. The average FCF is negative due to the acquisitions of Pall and Cytiva in 2015 and 2020, respectively. Excluding the acquisitions, we see the company generates positive FCF.
Danaher, Khaveen Investments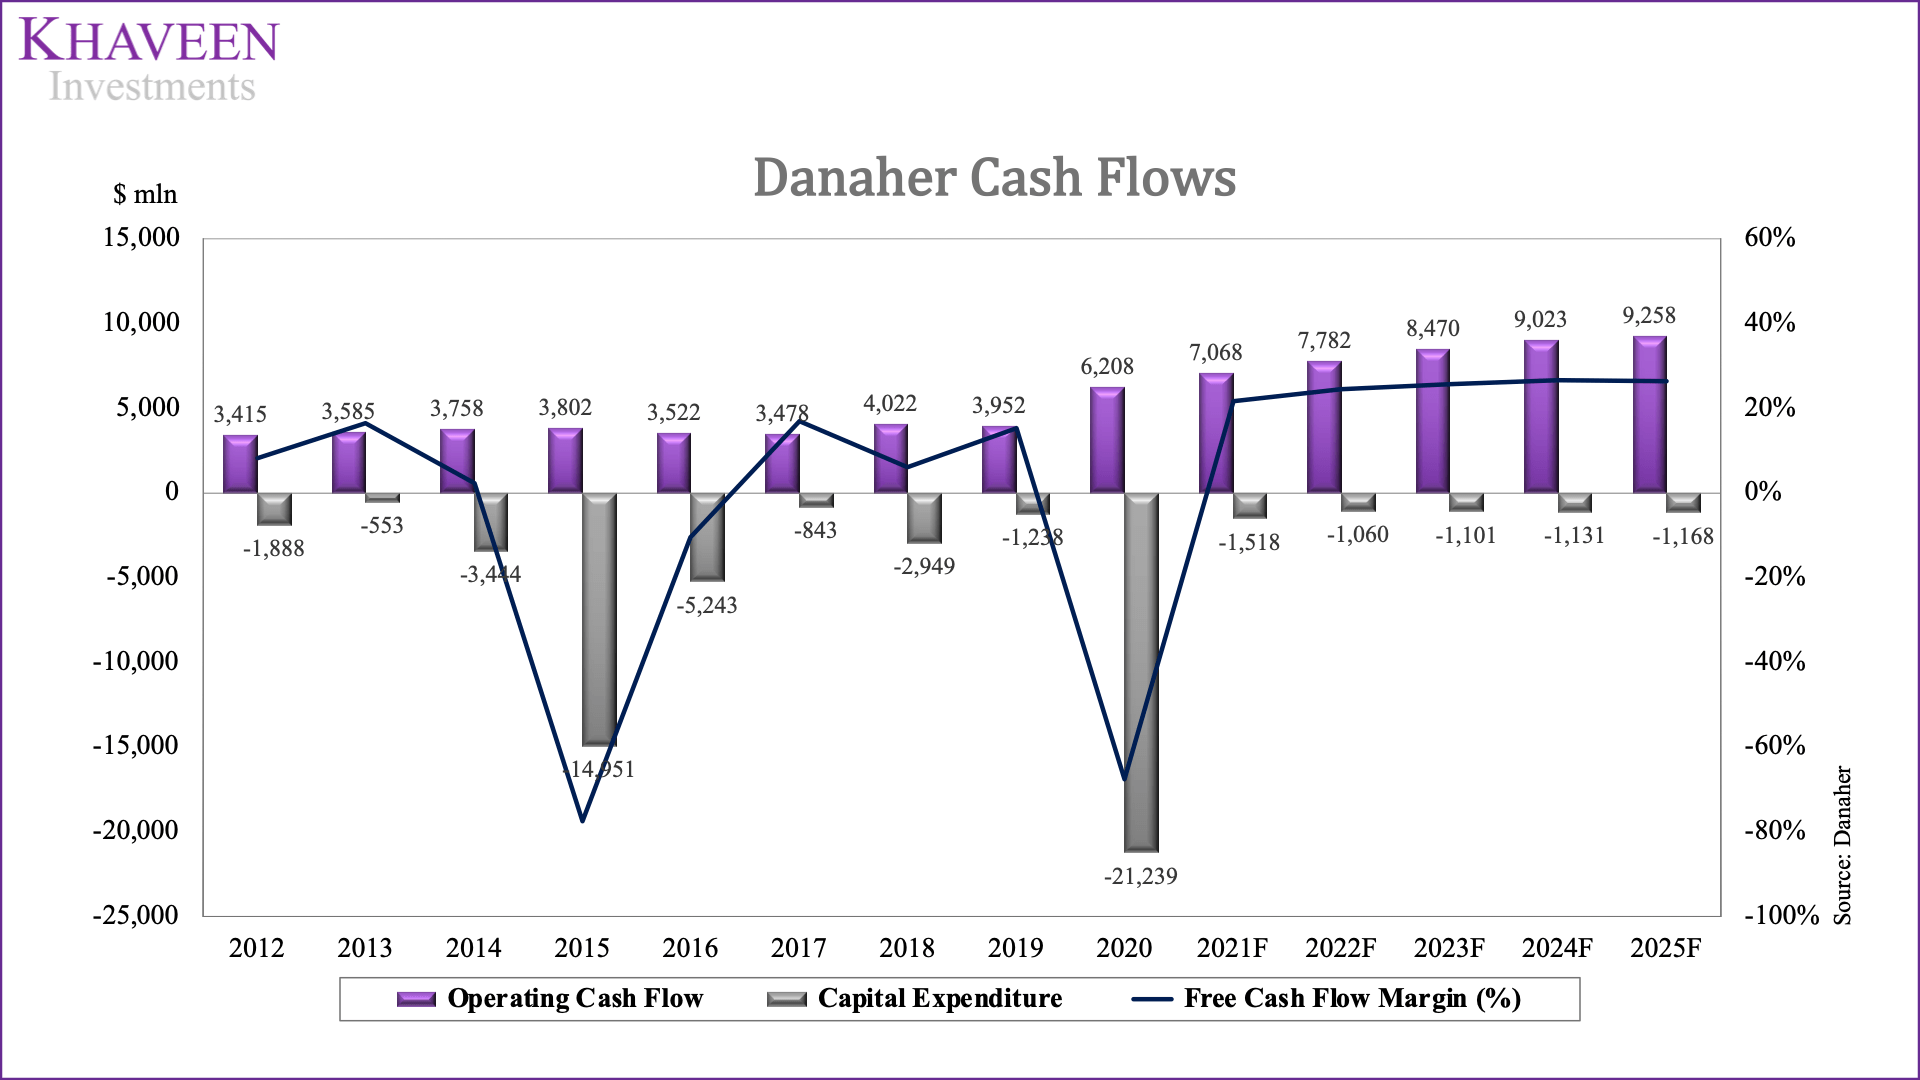
We used a DCF model to value the company due to expected positive FCF. To value the company, we obtained the industry average EV/EBITDA of 21.41x.
Seeking Alpha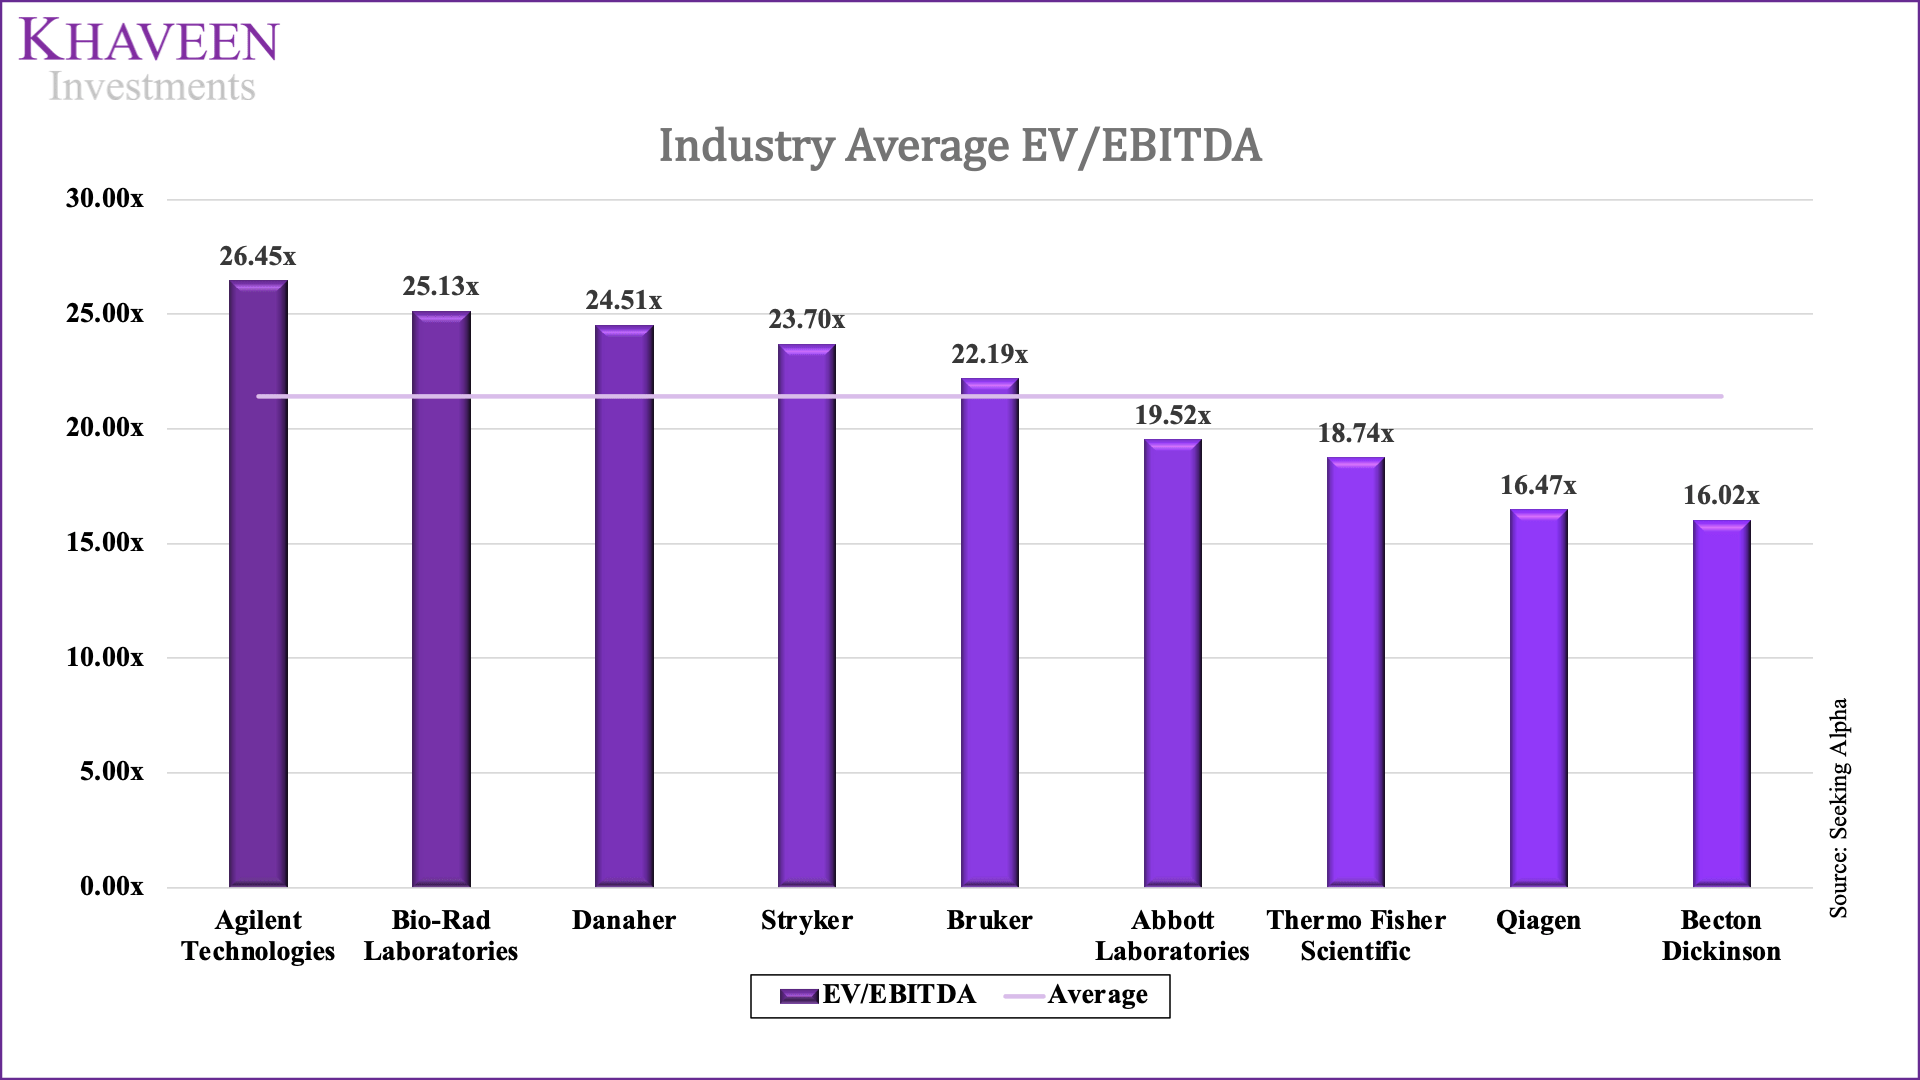
The forecasted revenue growth for the 3 segments of Danaher is based on the organic growth forecast mentioned above. We also discussed the COVID-19 related revenues above as well. The forecasted revenue growth from 2022 to 2025 is significantly weighed down by decreasing COVID-19 related revenue. However, in 2026 we see the revenue forecast to return to the organic growth as forecasted above.
|
Segments ($ mln) |
2020 |
2021F |
2022F |
2023F |
2024F |
2025F |
2026F |
|
Life Sciences |
9,926 |
12,549 |
13,449 |
14,413 |
15,445 |
16,552 |
17,739 |
|
Growth (%) |
42.80% |
26.43% |
7.17% |
7.17% |
7.17% |
7.17% |
7.17% |
|
Diagnostics |
6,510 |
7,318 |
7,976 |
8,693 |
9,474 |
10,326 |
11,254 |
|
Growth (%) |
-0.78% |
12.43% |
8.99% |
8.99% |
8.99% |
8.99% |
8.99% |
|
Environmental & Applied Solutions |
4,305 |
4,573 |
4,921 |
5,295 |
5,698 |
6,131 |
6,597 |
|
Growth (%) |
-2.14% |
6.23% |
7.60% |
7.60% |
7.60% |
7.60% |
7.60% |
|
COVID-19 Related |
1,543 |
3,966 |
3,608 |
2,706 |
1,353 |
– |
– |
|
Growth (%) |
156.93% |
-9.01% |
-25% |
-50% |
-100% |
0% |
|
|
Total Revenue |
22,284 |
28,407 |
29,954 |
31,107 |
31,970 |
33,009 |
35,589 |
|
Growth (%) |
24.42% |
27.48% |
5.45% |
3.85% |
2.78% |
3.25% |
7.82% |
Source: Danaher, Khaveen Investments
Based on the discount rate of 8.7% (company’s WACC), our model shows an upside of -1.22%.
Khaveen Investments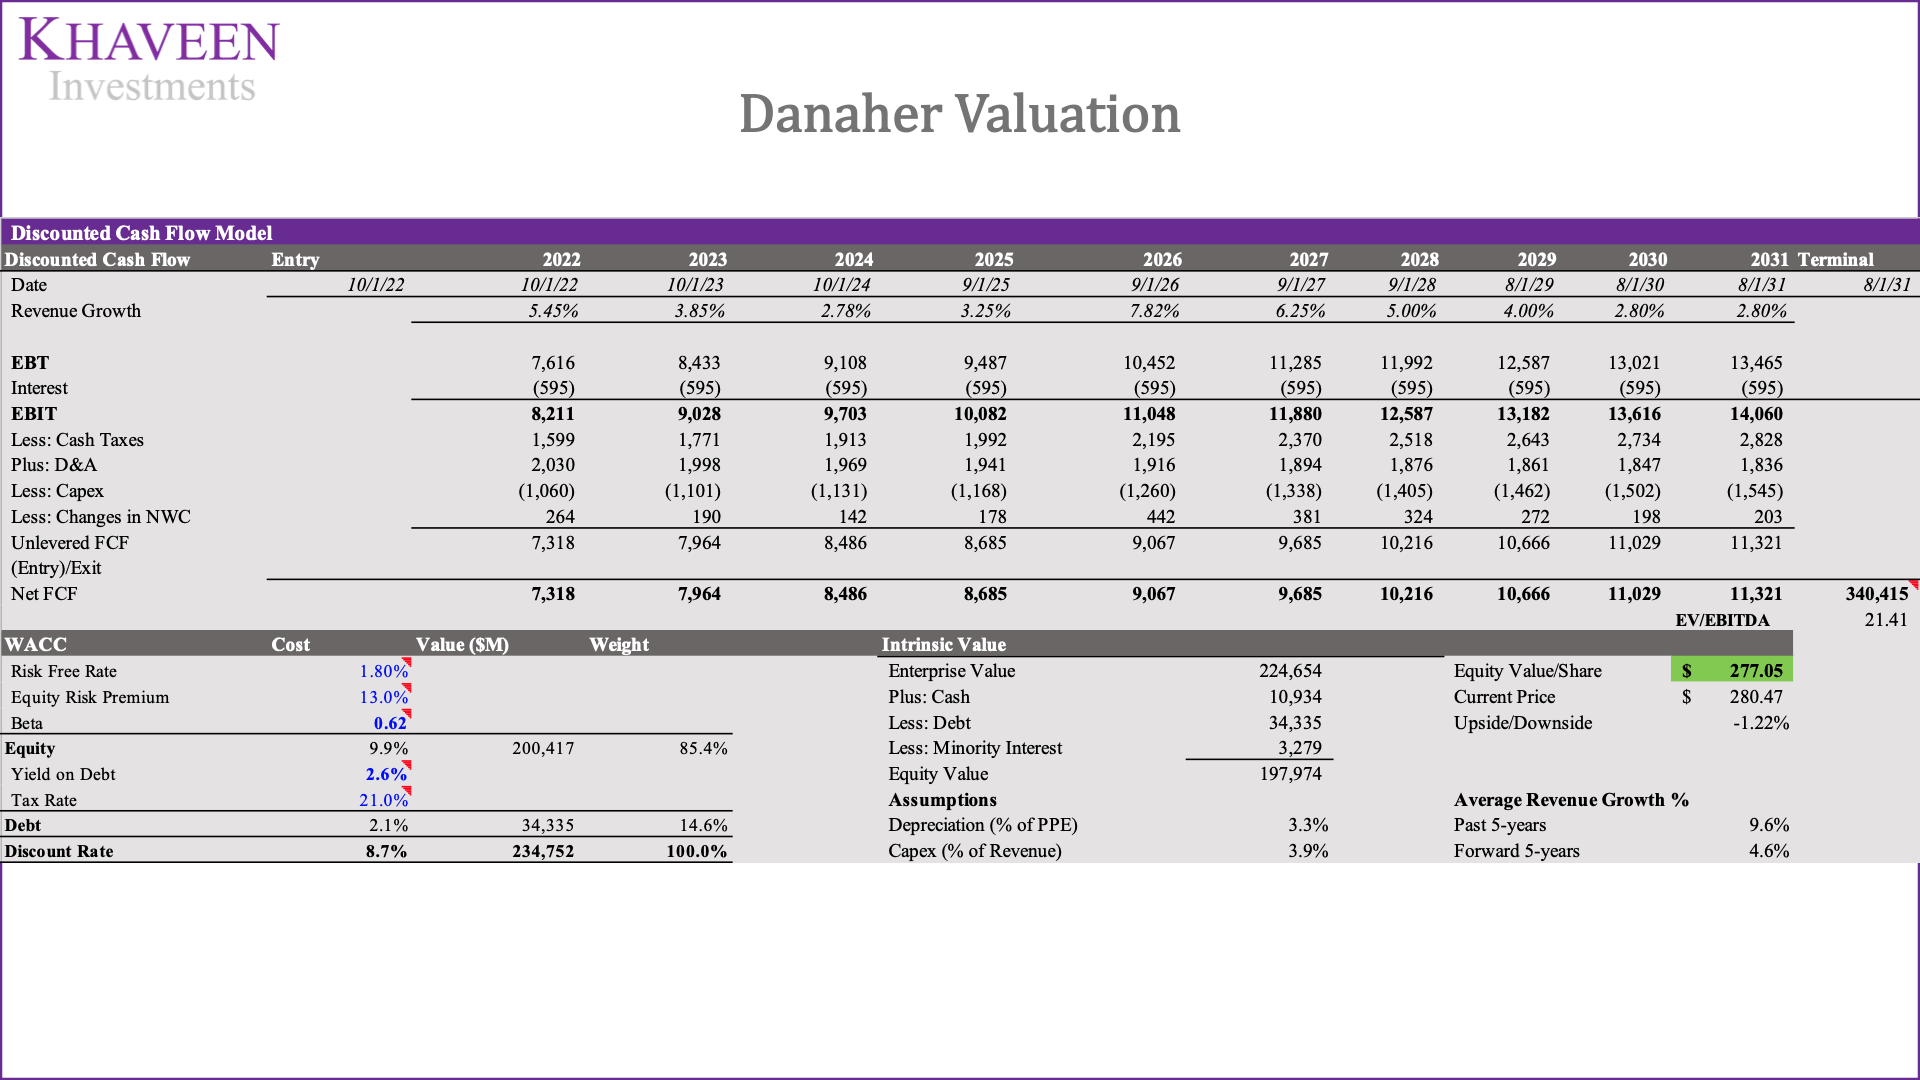
Verdict
To sum it up, we believe the shift in focus towards the healthcare segment which is a significant market as it accounted for 17.6% of US GDP spending in 2019 to benefit the company and expect the company’s organic revenue to grow by an average rate of 7.80% through 2025. Additionally, the sale of equipment provides the company with long term revenue through recurring revenue. We forecasted the COGS to decrease in the future which is expected to have a positive impact on Danaher’s gross margins increasing to 64.33% by 2025. Furthermore, we forecasted Danaher’s operating costs to remain stable as the company conducts significant restructuring. The risk associated with Danaher is the high net debt which may not allow the company to continue its acquisitions in the short term. We valued the company based on a DCF valuation with an upside of -1.22% indicating that it is fairly priced. Overall, based on our model we rate Danaher as a Hold with a target price of $277.05.
Be the first to comment