

adaask
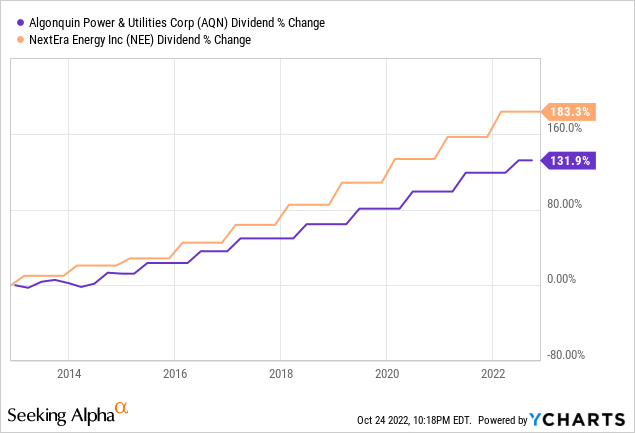
NextEra Energy (NYSE:NEE) and Algonquin Power & Utilities (NYSE:AQN) boast impressive dividend growth track records. NEE has grown its dividend for 26 consecutive years now, giving it the distinguished title of Dividend Aristocrat. Meanwhile, AQN has grown its dividend for 10 consecutive years. Over the past decade, both businesses have grown their dividends at rapid rates. NEE has grown its dividend per share at a 10.8% CAGR while AQN has grown its dividend per share at a 9.4% CAGR:
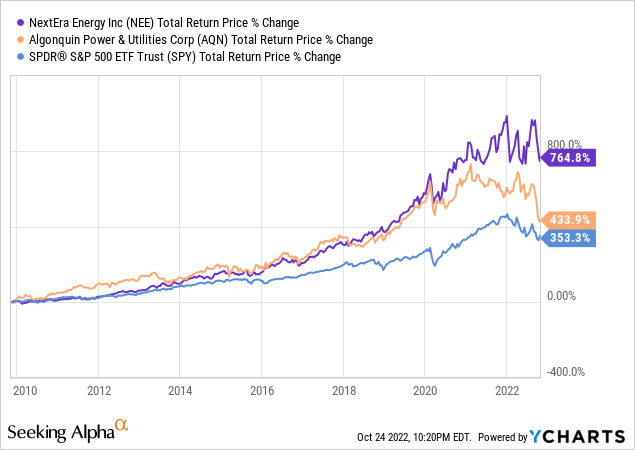
Overall, this has led to strong long-term outperformance for both businesses, though AQN’s sharp stock price decline this year has wiped out a considerable portion of its outperformance:
Both businesses also boast investment grade balance sheets and recession resistant highly regulated and contracted business models with good growth profiles. While NEE has the better track record, both have solid track records and AQN has the higher dividend yield at the moment. In this article, we compare them side by side to determine which is the better buy today.
Business Models Of NextEra Energy And Algonquin Power & Utilities
NEE is an electric utility that operated across three business segments: Florida Power & Light (“FPL”), NextEra Energy Resources (“NEER”), and Gulf Power. FPL and Gulf Power benefit from the fact that they are rate-regulated electric utilities, giving them very defensive cash flows, while NEER is the world’s largest wind and solar energy producer. Roughly 70% of NEE’s revenues stem from its electric utilities, giving it a defensive tilt.
AQN, meanwhile, is a green energy focused infrastructure business that generates a significant majority of its cash flows from regulated utilities businesses and complements it with a renewable power generation fleet. It owns natural gas, electric, water, and wastewater businesses located across the United States (80% of net utility sales), Canada (3%), Bermuda (12% of net utility sales), and Chile (5%). The company also owns a large 44.2% equity stake in former High Yield Investor holding Atlantica Sustainable Infrastructure (AY), which engages primarily in renewable power production and has a geographic presence all across the globe. AQN’s cash flow breakdown is similar to NEE’s in that over 70% of its cash flow stems from regulated utilities and the remainder comes from renewable power generation. Overall, we rate these businesses as having very similarly positioned business models, so we give them a draw in this category.
Balance Sheets
NEE wins this competition by virtue of its A- (stable outlook) credit rating from S&P in contrast to AQN’s BBB (negative outlook) credit rating from S&P. NEE’s interest coverage ratio is nearly triple AQN’s at a very conservative 9.48x (compared to AQN’s still adequate 3.27x).
In addition to its stronger interest expense coverage, NEE also benefits from the fact that its dividend payout ratio is significantly lower than AQN’s. As a result, it is able to retain more earnings which it can then reinvest in growth projects instead of having to issue more shares. In contrast, AQN’s tight dividend payout ratio makes it very dependent on the public equity markets to finance the equity portion of its capital expenditures and growth acquisitions, putting it in a riskier position when it comes to financing its growth:
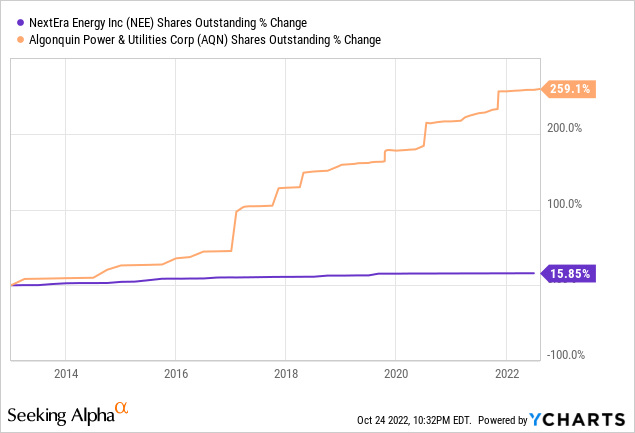
That said, AQN reiterated during its recent Q2 report that its capital plan remains on track with over $1.2 billion of the $4.3 billion expected to be deployed this year already invested. The company continues to have good access to the debt markets and has $2.4 billion in available liquidity, positioning the firm well to finance its capital plan for the year. The business also has 84% of its debt attached to fixed interest rates and has little near-term debt maturities.
Recent Performance
NEE posted impressive year-over-year growth in its Q2 numbers. Adjusted earnings per share increased by 14% over the prior year period thanks in large part to the more than 11% growth in regulatory capital employed as well as the strong performance in its renewable power and energy storage portfolios.
AQN, meanwhile, generated impressive performance of its own, albeit not quite as strong as NEE’s from a growth perspective. Adjusted EBITDA increased by 18% year-over-year, adjusted net earnings were up by 20% year-over-year, and adjusted net earnings per share grew by 7% year-over-year. Management reiterated its expectation for accelerated adjusted net earnings per share growth in the second half of the year and continued strong dividend per share growth for the foreseeable future.
Growth Outlooks
When it comes to growth, NEE beats AQN once again. Consensus analyst estimates put NEE’s normalized earnings per share CAGR at 8.2% through 2025, its dividend per share CAGR at 9.5% through 2026, and its cash flow per share CAGR at 12.1% through 2026. Meanwhile, AQN’s forecasts are still respectable, albeit inferior to NEE’s at 7.9%, 4.5%, 11.7%, respectively through 2025.
As these numbers indicate, AQN’s normalized EPS and cash flow per share growth rates are nearly as strong as NEE’s which is quite impressive given its lower payout ratio. This is largely due to AQN’s recent substantial acquisitions which it expects to ingest and provide strong accretion to its per share cash flow growth in the coming years. However, NEE’s dividend per share growth outlook is nearly twice that of AQN’s in the coming years. This is because AQN’s payout ratio is too high, so management is going to have to cut back on dividend growth in order to right size its payout ratio and become less dependent on capital markets to fund growth CapEx.
Overall, we give a slight edge to NEE here due to its superior dividend per share growth outlook.
Valuations: NEE Vs. AQN
When it comes to valuation, AQN is far cheaper across all of the major metrics:
| Metric | AQN | NEE |
| Dividend Yield | 7.0% | 2.4% |
| P/CF | 8.7x | 14.7x |
| P/E | 13.7x | 27.8x |
| EV/EBITDA | 11.2x | 18.6x |
As a result, we give AQN the clear edge in this category.
Investor Takeaway
While NEE has a better track record, a strong balance sheet, and a slightly better growth outlook, AQN’s track record, balance sheet, and growth outlook are all still quite good. Meanwhile, its valuation is way more attractive than NEE’s, which looks quite rich given where interest rates are at the moment.
As a result, we greatly prefer AQN at the moment, and give it a Strong Buy rating, while giving NEE a Hold rating. NEE might only look interesting to very conservative investors who want to take on minimal risk and favor growth. Meanwhile, for value and/or income investors who want a great combination of mid to high single digit current income yield and mid to high single digit annualized per share growth, AQN is a very attractive opportunity that should also hold up well during a recession.
Be the first to comment