

Althom
CVS Health Corporation (NYSE:CVS) is the seventh largest company in the world ranked by revenue (2021) and is the main player in Health Care Services industry. Two great characteristics underline the company’s strengths: the large and constant revenue growth and the great ability to create Cash Flow from operations. The revenue growth occurred organically and also through targeted acquisitions of Health Care companies. The cash flow generation, on the other hand, today allows for a varied use of capital which ranges from share repurchases up to new acquisitions.
Revenue growth is not always accompanied by growth in margins and this is the case with CVS where we have to note the difficulty in growing the EBIT margin on the one hand and bringing ROCE (Return on Capital Employed) back to pre-acquisition levels on the other. A CAPEX that appears to be underestimated could lead to unexpected expenses in future years. The great ability to generate Free Cash Flow probably represents the company’s real strength and potential.
With a keen eye on margin growth and efficient use of capital in acquisitions, today the share price appears to be slightly undervalued and represents, in my opinion, a good investment opportunity. My rating is “buy”.
General Overview
CVS Health Corporation offers diversified health solutions and is aimed to focus all the effort on the final customer. According to management, this customer-oriented strategy is capable of delivering stable growth and long-term value for shareholders.
One of the company’s strengths is to allow customers to obtain health services when and where they want while remaining digitally connected.
The company offers its services through 10,000 retail locations, with 1,200 walk-in clinics, and a pharmacy benefits manager with plus than 100 million members with Aetna and Caremark.
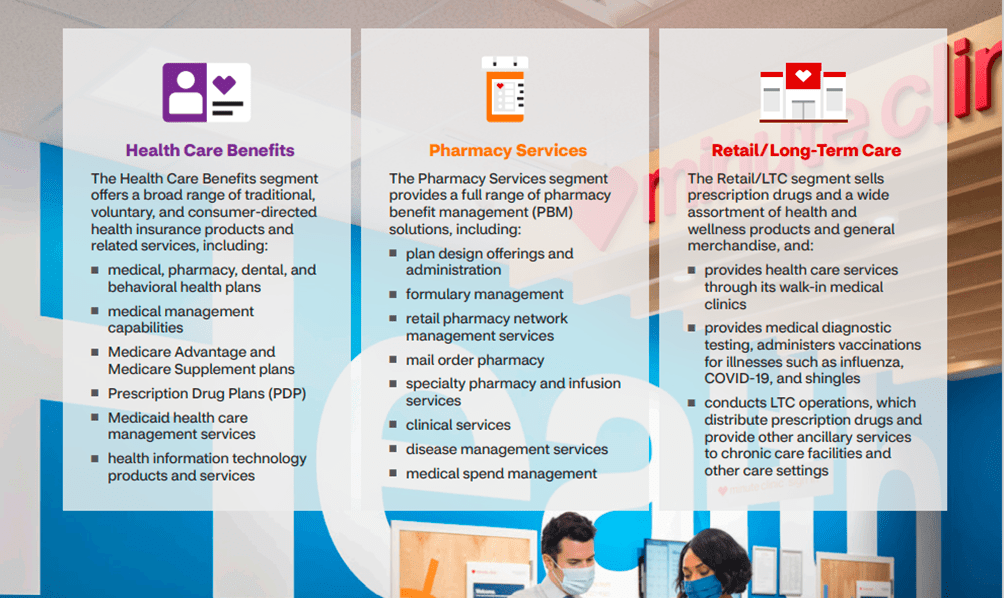
CVS is divided into 3 major operating segments and profit centers: Health Care Benefits (35 million people served), Pharmacy Services (with PBM solutions), and Retail/LTC (that sells prescription drugs)
There is also one further segment: Corporate/Other Segment where CVS presents its financial results.
CVS 2021 Annual Report
Financial & Highlights
Revenue and Profit
CVS 10-Q Forms + Author Graph
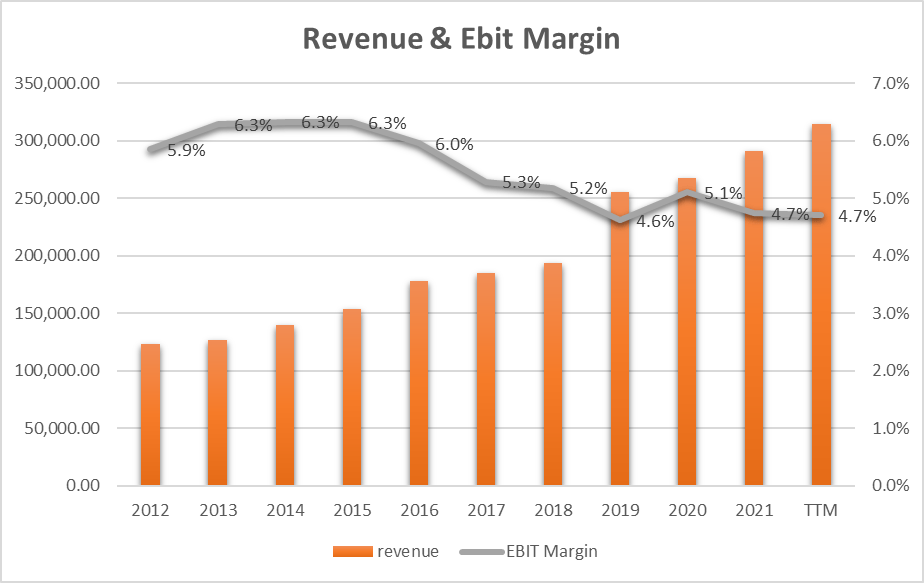
The orange bars represent the turnover trend over the last 10 years. We record an annual growth of 9.8% (CAGR) made up of organic growth and acquisitions. EBIT, on the other hand, grew slightly less at 7.4% annually. The EBIT margin, on the other hand, went from 5.9% to 4.7% and in terms of % margins, the company has not grown since 2019. This is mainly due to a proportional increase in Selling General & Admin Expenses starting from 2018 (the year of the Aetna acquisition). It would therefore seem that this acquisition has allowed strong growth in revenue with a small erosion in EBIT Margin.
Related to the issue of expenses containment, the management acknowledged the need to implement improvement actions and as reported in the last earnings call:
“This is the first year, I think, where we’ve embarked on closing 900 stores over 3 years, and we’re going to do about 1/3 each year. That has gone very well, actually exceeded our expectations. We’re retaining in excess of 70% of the scripts in nearby pharmacies. We’ve been able to redeploy over 95% of the labor force to other stores, which has really helped a great deal and in this environment. And so that initiative is a multiyear initiative, but we’re off to an excellent start.”
Will have to wait a few quarters to see the first signs of improvement. So the big 2018 Aetna acquisition has created significant revenue growth but it seems, for the moment, to have eroded (a little bit) the profit margin if we see it vs Revenue.
The other important metric for seeing company profitability is the ROCE (Return on Capital Employed) and it gives us a measure of how much the actual capital employed in the company makes in profit.

CVS 10-Q Form + Author Graph
Before the acquisition, ROCE had stabilized at 15.2% (2017), slightly up from the previous 5 years. In 2018 we see how the profitability parameter drops significantly to 6.6% (precisely due to the large capital investment for the acquisition). The trend from 2018 to today, on the other hand, is very positive, recording a growth of up to 9.3% (TTM).
But what is this improvement due to? We have seen that it is not due to EBIT as this was almost stable. As we can see from the gray bars, the improvement in profitability over the last 5 years is mainly due to capital turnover. This parameter has gone from 1.3 (2018) to 2 (2022). The parameter indicates how much $1 invested in the company makes in sales. We are still far from the $2.9 of sales generated in 2017 per $1 invested, but we can record an important positive growth trend. The trend underlines that invested capital is producing results by increasing profitability.
Free Cash Flow, EPS, and Dividend

CVS 10-Q Form + Author Graph
The graph shows the trend of the Free Cash Flow, Dividend, and EPS per share parameters. In the ideal world, this graphic chart represents perfection. Parameters all increase over time, FFC can cover the dividend, and also the EPS constantly creates higher cash flow.
However, the standard data probably does not capture all the elements and it is, in my opinion, necessary to proceed with some adjustments. In particular, the company has spent money over the years to complete acquisitions and these (non-standard) amounts should be reduced to the Cash Flow to have a clearer view.
Author Calculation
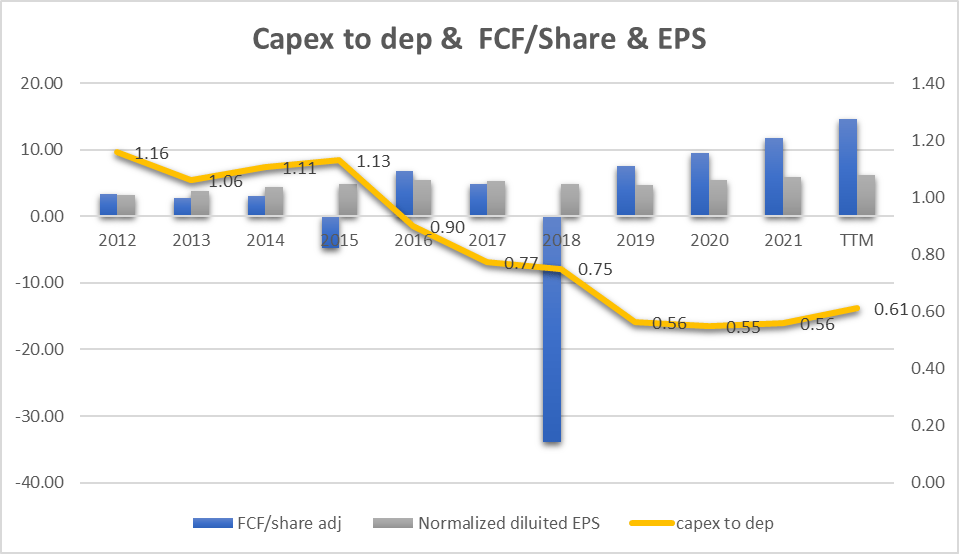
This slightly more realistic graph shows the new trend of FCF/Share adjusted compared to EPS. We can see how in 2015 but above all, in 2018 the company suffered from FCF and how also in recent years but above all in 2022 it was able to transform all profits into a great source of Cash as the management underline in the last Q3 earnings call:
“Our ability to both deliver the balance sheet to create capacity to generate cash flow from operations has continued to exceed our own internal expectations”
The graph also shows (yellow line) the trend of the CAPEX to Depreciation ratio. The ratio shows (even after acquisitions) how much the company is spending in CAPEX to maintain current operations. Ideally, we could identify that a healthy company can spend an amount equal to or greater than the “depreciation” in CAPEX. This could be required to keep company assets efficient over the long term.
As we can see CVS spent more on CAPEX than depreciation until 2016 (parameter above 1). From 2017 until today (0.61) the expenditure for the maintenance of the current assets has probably been underweighted. This could identify the need for new investments in current assets in the long run.
Quantitative Valuation
FCF/Share Model
To define a maximum buying price, I use a very simple formula based on FCF/Share and interest rate.
The formula is:
Maximum buying price = Cash profit per Share/interest rate – 20% (safety discount)
If TTM Cash Profit per share = $14.82
Interest Rate = inflation Rate = 7.75%
Maximum price before Safety discount = 14.82/7.75% = $196.2
The maximum price at 20% discount = $163.5
Under the FCF/Share analysis, it seems that the actual price of $102 is cheap.
EPS Growth Model
The FCF/Share approach may be overly optimistic following the use of cash flow in future acquisitions. Therefore I need to implement an alternative comparison method based on the estimated EPS growth in the next few years. Since the company is very stable in terms of revenue and EPS growth, I decided to use the EPS growth parameter over the last 10 years as an estimate of future growth. 6.8% is the growth rate (CAGR) of EPS from 2012.
The Formula is (by popular investor Benjamin Graham):
Intrinsic value per share = EPS x (8.5 + 2 g)
Where
EPS = earnings per share
g = EPS growth rate = 6.8%

Author Calculation
Example of calculation for 2023:
Intrinsic value per share = EPS x (8.5 + 2 g) = 6.68x(8.5+2×6.8) = $147.38
The last intrinsic value of $204.5 for 2028 underlines an annualized return of 12.3% as the current share price is $102.
12.3% is fine and is the annualized expected return for my investment in CVS.
Peer Comparison
To compare CSV with similar companies in terms of market capitalization in the Health Care Services sector I have defined the following peers:
• Cigna Corporation (CI)
• Laboratory Corporation of America Holdings (LH)
• Quest Diagnostics Incorporated (DGX)
• Fresenius SE & Co. KGaA (OTCPK:FSNUY)
Using Seeking Alpha’s Quant Ratings we have a parity verdict between the various companies that have a “hold” rating
Seeking Alpha
Going deeper into the parameters characterizing CVS we can see the Cash Flow

Seeking Alpha
As we can see from the table above the CVS Net Operating Cash Flow which is equal to $22B is more than double that of CI ($10.83B) which is the highest player of the peers. CVS confirms its leadership in terms of its ability to generate Operating Cash Flow. This feature is also important because it allows for the distribution of the dividend.

Seeking Alpha
Looking at the dividend yield of the last 4 years we can see how CVI is by far the best player with an average distribution of 2.78%.
Risks
I can underline 3 main Risk areas:
Revenue Growth
We have seen how important revenue growth is in keeping the EBIT margin constant. A possible revenue loss could also generate important repercussions on profits and margins. As we can hear from the last earnings call:
“Last week, we learned that Centene decided to move their business to a competitor in 2024.”
And also about 2024:
“Let me talk about the ’24 headwinds a little bit more specifically. We project the combined impact of [stars] (PH) and Centene on 24 to be approximately $2 billion on an unmitigated basis. My comments today regarding repurchases and achieving our Investor Day commitments assume that we’re successful in mitigating approximately half of this headwind. And that work is in process and underway, but not 100% certain at this stage. That would leave a headwind of about $1 billion or $0.55 a share for 2024.”
We can see how this is also a sore point for management to deal with. It remains for investors to monitor how CVS’s actions will produce the desired results to improve the revenue and profit also in 2024. At the moment I set this point as the main risk for future revenue and profit growth.
Capital Deployment
New acquisitions and share buybacks are the main uses of capital for the coming months/years. Acquisitions are not always able to create real value, and neither are buyback programs. This last aspect is positive for shareholders only if the purchase price is advantageous.
From the last earnings call:
“Capital deployment remains an important part of our growth equation, and we expect to repurchase shares in 2023 opportunistically to ensure we achieve our targets and offset dilution. Our preliminary outlook does not include any impact from the announced acquisition of Signify Health, which we continue to project will close in the first half of 2023 and be accretive to adjusted EPS.”
If the acquisitions do not bring significant economies of scale with an impact on expense reduction, these can represent an issue in the long run. It seems that CVS will need many years to recover its pre-acquisition EBIT and ROCE margins and this could be a long-term risk also for the acquisition of Signify Health expected in 2023 or for other future acquisitions.
One of the uses of capital that is perhaps undervalued is CAPEX, which could represent an element of risk in the years to come. If the company does not invest enough in maintaining current assets it could be a risk.
Lawsuits and claims
CVS has a pending lawsuit worth about $5.2B over the opioid issue. As management has emphasized, this dispute is being settled with a total disbursement to be spread over 10 years starting in 2023.
Even if the company has identified a method for managing payments in such a way as not to impact future strategies for the use of capital, it should be emphasized that these problems can always represent a concrete risk in the presence of a contraction in revenue and margins.
Conclusion
CVS represents one of the main players in the Health Care Services industry. The revenue growth rate has been 9.8% per year in the last 10 years and this represents an element of absolute respect for the company. The EBIT margin is stable at 4.7% and at the moment it represents a certain degree of security. The great cash flow represents the real company strength which can afford to grow also through acquisitions. With a share price valuation that appears to be cheap and a potential return of 12.3%, my rating is Buy.
Be the first to comment