

niphon/iStock via Getty Images
In this month’s article, I outline why I will maintain my 100% allocation to the SPDR S&P 500 ETF (NYSEARCA:SPY) in April. First, let me review my pension plan performance in March. The market, as measured by the S&P 500 index, gained 3.58%. As for my pension plan assets, I slightly outperformed the index by gaining 3.76% in March. My investment objective of preserving my capital was met as I made money and I did meet my second investment objective, which is beating the S&P 500 index. Table 1 below shows my returns and allocations for the month of March and Table 2 below shows my returns for the past 12 months.
I have made changes to Table 2 below after I received a comment from a reader. Table 2 shows new columns to better (more accurately) reflect my investment results. The third column, $100K Hypo, is what my returns would be if I started my account with $100,000 in my first article of this series and followed the allocation recommendations from my articles. The fifth column, $100K SPY, shows the returns of just investing $100,000 and keeping it all allocated to SPY. The percentage returns in the last row show that my strategy returned 13.94% for the last 12 months and simply investing in SPY would have returned 15.48% for the last 12 months. Therefore, I have underperformed SPY for the last 12 months by 1.54%.
Table 1 – Investment Returns for March
|
Mar-22 |
|||
|
Position |
ETF Return |
Allocation |
My Return |
|
SPY |
3.76% |
100% |
3.76% |
|
IWM |
1.16% |
0% |
0.00% |
|
EFA |
0.52% |
0% |
0.00% |
|
AGG |
-2.81% |
0% |
0.00% |
|
Cash |
0.16% |
0% |
0.00% |
|
Total |
100% |
3.76% |
|
Table 2 – Investment Returns Last 12 Months
Author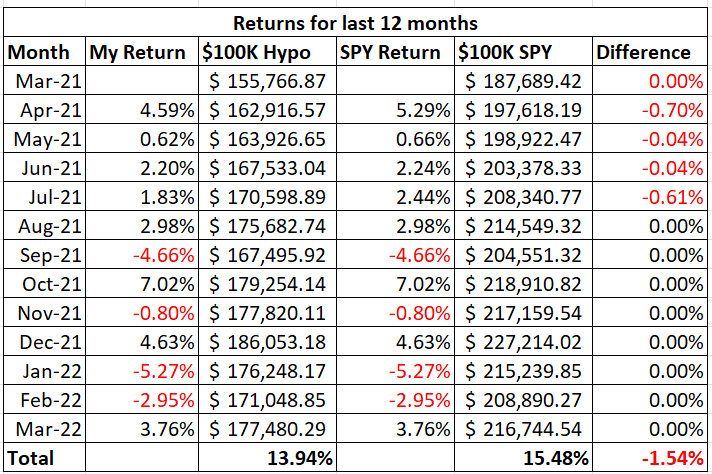
To review the purpose of this series of articles, my retirement account only allows me to buy the following four ETFs: iShares Core U.S. Aggregate Bond ETF (AGG), SPDR S&P 500 ETF, iShares Russell 2000 ETF (IWM), and iShares MSCI EAFE ETF (EFA). I can also have my money in cash. The question is how to decide where and when to allocate money to these various ETFs.
I use my moving average crossover system combined with relative strength charts to determine how to allocate my pension plan assets. My moving average crossover system uses the 6 month and the 10 month exponential moving averages to identify which of the four ETFs are in a position to be bought. If the 6 month moving average is above the 10 month moving average then the ETF is a buy. I call this setup being in bullish alignment. When the 6 month moving average is below the 10 month moving average the setup is referred to as a bearish alignment. When a bearish alignment happens, I don’t want to hold that asset. See Chart 1 below for a long-term look at the S&P 500 index using my moving average crossover system.
Chart 1 – Monthly SP 500 Index with 6/10 Moving Averages
www.stockcharts.com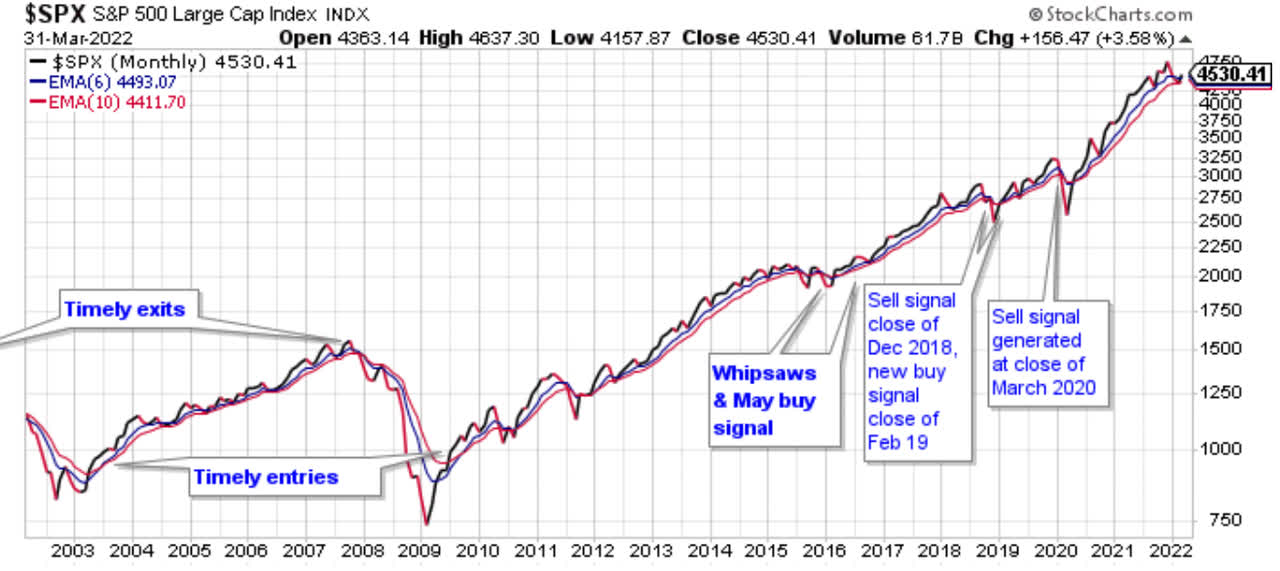
You can see that the moving average crossover system provided some excellent long term buy and sell signals that would have allowed investors to capture long duration moves in the index while avoiding costly drawdowns. Avoiding these costly drawdowns allows me to meet the objective of capital reservation.
I employ this strategy because I do not want to experience a large drawdown with my pension assets. During the 2008-2009 market crash many people didn’t even look at their retirement statements because they were afraid of what they would find. I submit that if those people would have used a market strategy similar to what I outline in this series of articles, they would have been able to avoid much of the decline during the bear market and consequently would have had less emotional stress during that time period.
The following charts show the current status of the ETFs that I am allowed to buy in my retirement account.
Chart 2 – Monthly SPY with 6/10 Moving Averages
www.stockcharts.com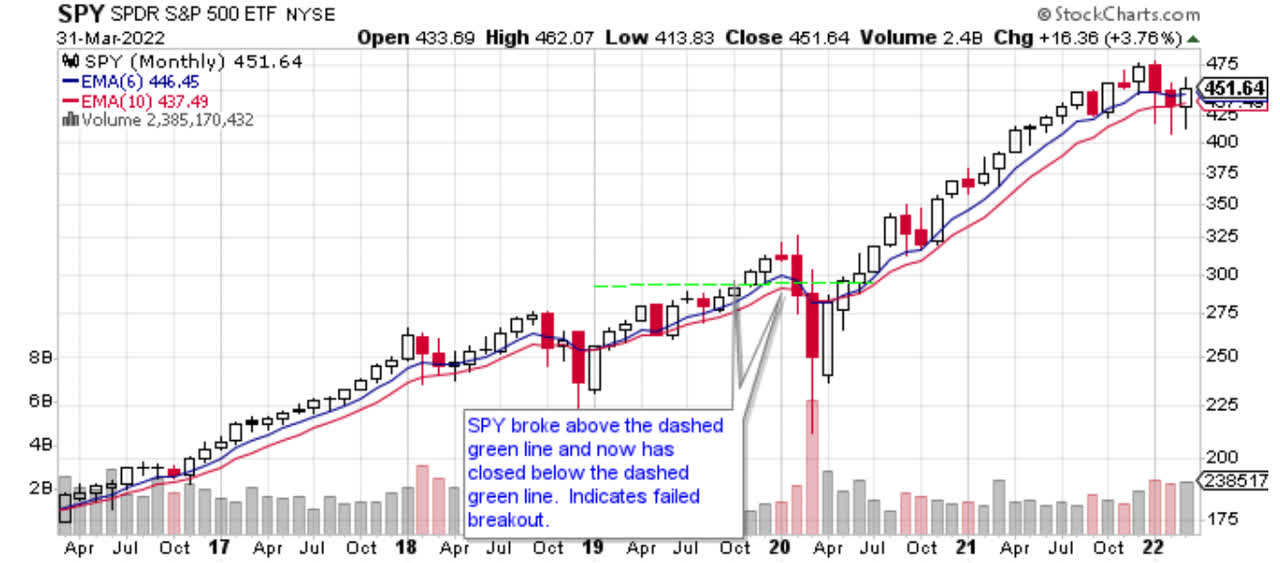
Chart 2 shows that SPY bounced back and finished the month 3.76% higher in March. Things could have been much worse. SPY rallied late in the month which is why you can see a long wick or shadow on the monthly candle. This is just like what happened in February. The difference is that in March, SPY pushed higher and finished the month in bullish alignment. It closed above both moving averages and both moving averages are now turning upwards again. I will maintain my 100% allocation to SPY in April. The trend remains up and I intend to follow the trend. It will be interesting to see if the bottom is in for this mild correction or if more pain is to follow.
Chart 3 – Monthly IWM with 6/10 Moving Averages
www.stockcharts.com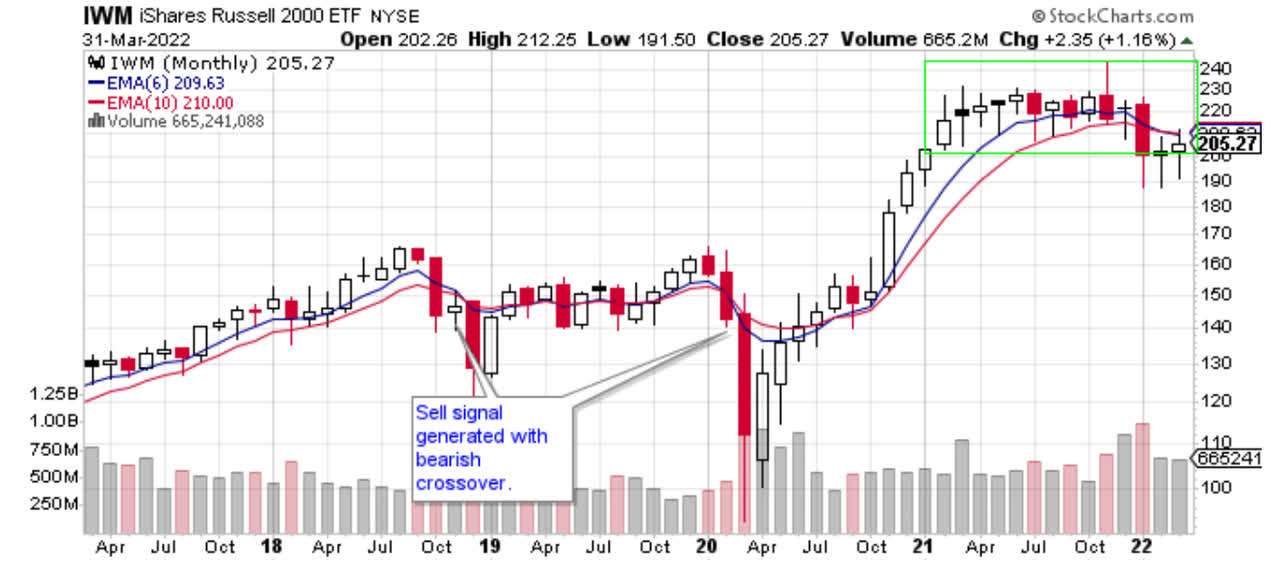
IWM closed 1.16% higher in March which is good. IWM remains in bearish alignment which is bad. The “tweezers bottom” which was written about last month is still in play. This type of formation where there are long wicks or shadows below the body of the candle often precedes rallies. Because of this formation, it wouldn’t surprise me if IWM gains in the month of April. It will be interesting to see which has more predictive power, the pattern formation of the tweezers bottom or the trend formation of the bearish alignment.
Chart 4 – Monthly IWM:SPY Relative Strength
www.stockcharts.com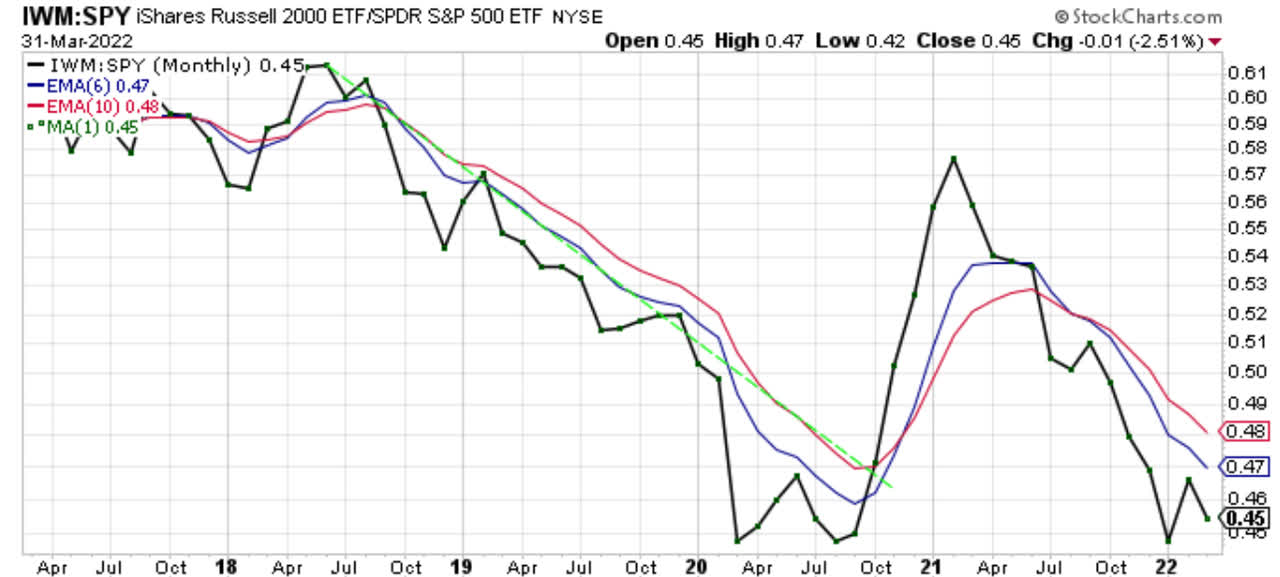
Chart 4 shows that the IWM:SPY ratio gave back 2.51% in March. The ratio remains in bearish alignment. You can also see that the ratio has been making a series of lower highs and lower lows since the beginning of 2021. That is the classic sign of a downtrend. Investors still prefer large cap U.S. equities over small cap U.S. equities. I will need the ratio to close above the red 10 month moving average before I consider allocating money to IWM over SPY.
Chart 5 – Monthly EFA with 6/10 Moving Averages
www.stockcharts.com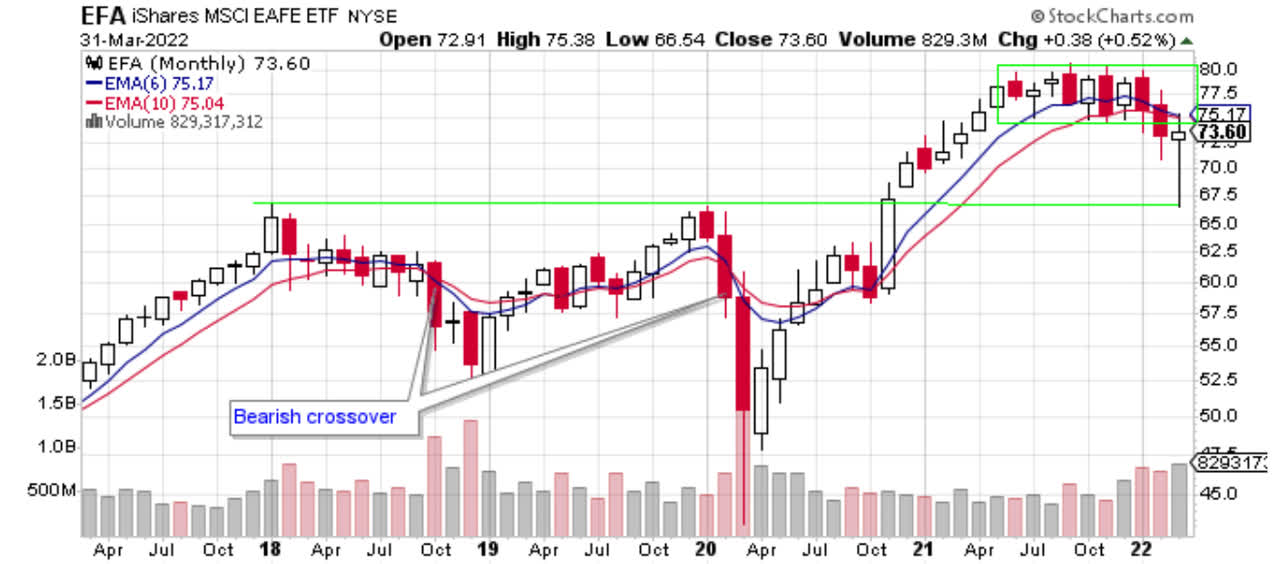
Chart 5 shows that EFA gained 0.52% in March. EFA closed below its 10 month EMA and below the narrow range outlined by the green box. EFA is in bearish alignment. Last month, I stated that the $67.50 area could act as support. Sure enough, EFA bounced off that area identified by the horizontal green line. Now we will see if EFA continues that bounce and closes higher in April.
Chart 6 – Monthly EFA:SPY Relative Strength
www.stockcharts.com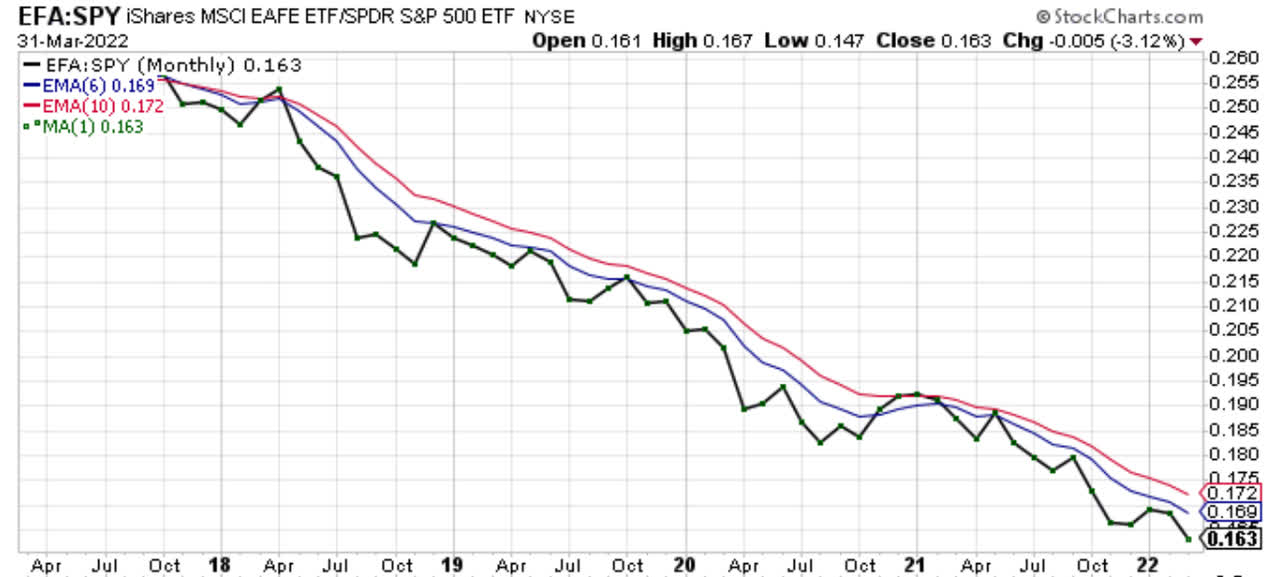
The EFA:SPY ratio remains in a downtrend. EFA underperformed SPY in March by 3.12% as shown in Chart 6. The ratio remains in bearish alignment. As stated before, I need to see this ratio close above the red 10 month moving average before I allocate money to EFA over SPY.
Chart 7 – Monthly EFA:IWM Relative Strength
www.stockcharts.com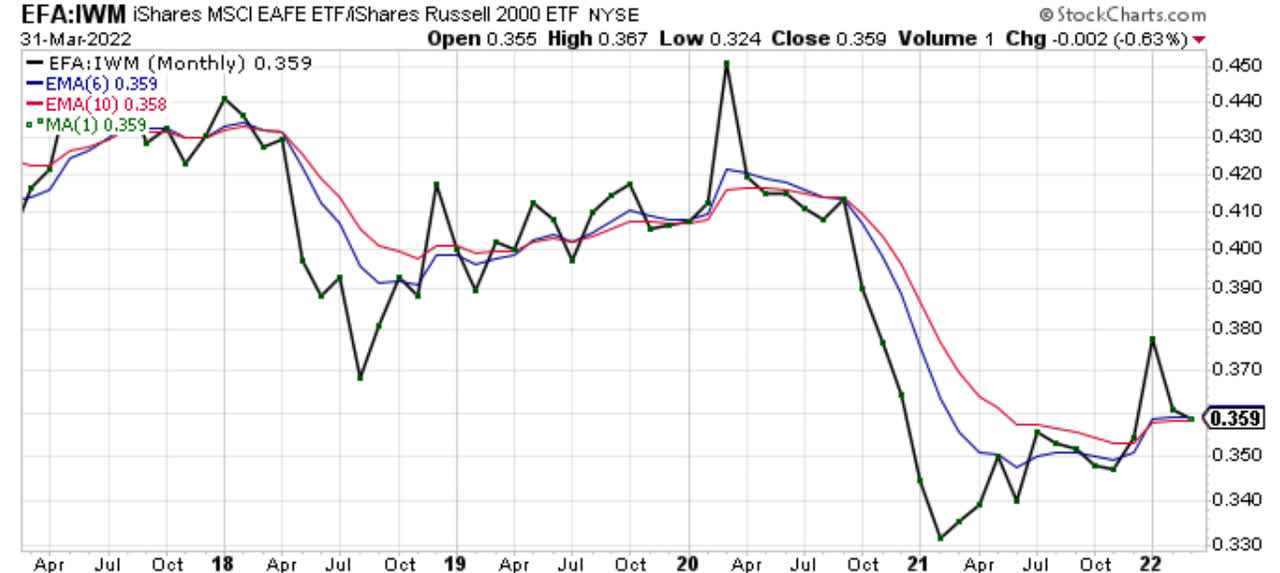
Chart 7 shows that EFA underperformed IWM in March by 0.63%. The ratio remains in bullish alignment. The ratio is making a series of higher highs and higher lows while the two moving averages are now trending higher. I will continue to watch this chart to see how events unfold.
Chart 8 – Monthly AGG with 6/10 Moving Averages
www.stockcharts.com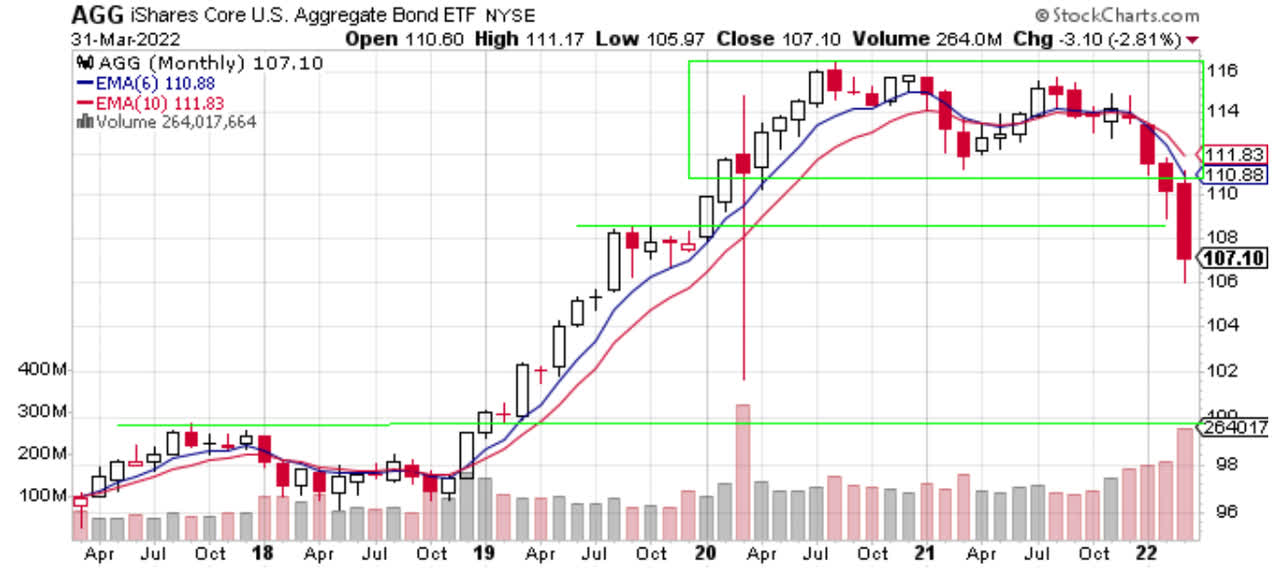
AGG lost 2.81% in March. AGG is in bearish alignment and the distance between the two moving averages continues to widen. AGG also closed outside of the green box which contained its recent trading range and it closed below the $108 level of support identified by the horizontal green line. All of that is bearish. The next level of support may be the level around $100 also identified by a horizontal green line.
Chart 9 – Monthly AGG:SPY Relative Strength
www.stockcharts.com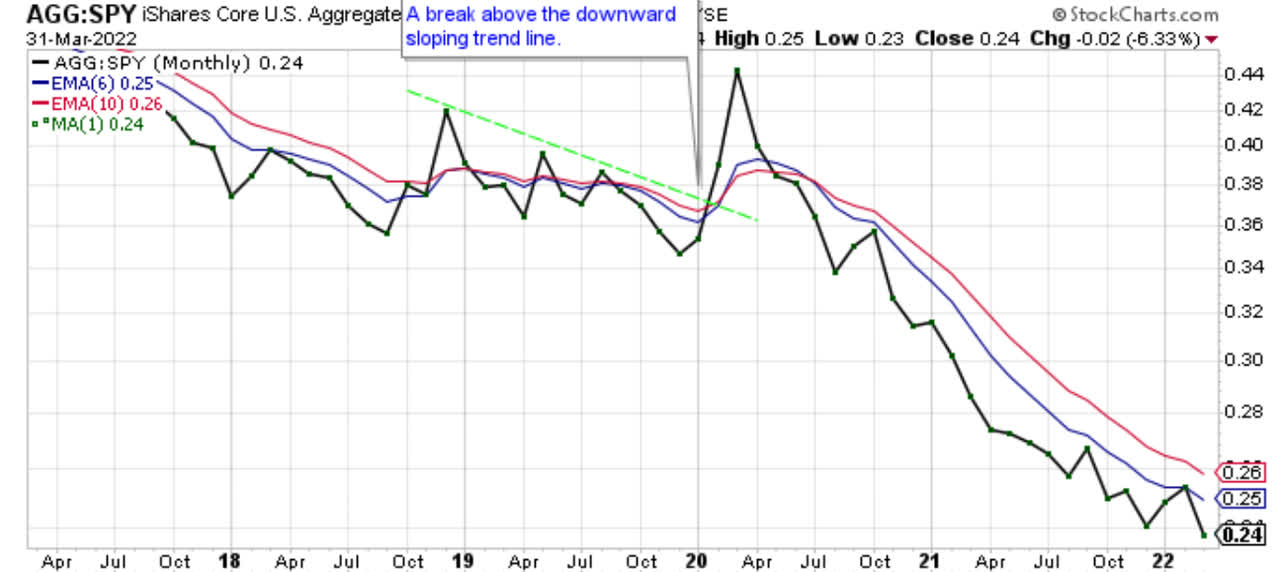
The AGG:SPY ratio in Chart 9 lost 6.33% as AGG underperformed SPY in March. The ratio remains in bearish alignment. There is no reason for investors to favor bonds over stocks currently.
In summary, every equity ETF that I follow for my retirement account gained in March. AGG was the largest decliner for the month losing 2.81%. SPY is the only ETF I follow that is above both of its moving averages. Following a system such as the one I utilize in this series of articles kept me in SPY during a challenging month. At the end of February, it seemed for certain the correction in the stock market would continue. However, my system indicated that the prudent course of action was to remain invested in SPY. That worked out in the month of March. We will see if it works out in the month of April as I will continue to have 100% of my assets allocated to SPY. The SPY trend is still bullish, so I will continue to follow the trend.
Be the first to comment