

oatawa/iStock via Getty Images
In February, I named CubeSmart (NYSE:CUBE) as one of the 12 top REITs for the coming 12 months. I also identified the Storage REIT (real estate investment trust) sector as one of 7 sectors likely to outperform in 2022.
According to Hoya Capital, the Equity REIT Index has returned (-26.33)% thus far this year, while the Storage REIT sector is indeed outperforming, albeit at a loss of (-21.52)%.
Hoya Capital Income Builder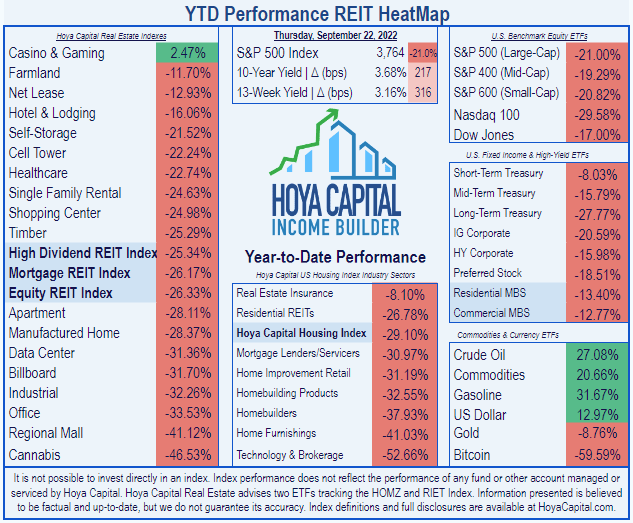
This is quite unusual. The Storage REIT industry’s average return from 2011 through 2021 was 21.77%, for a total return of 717%.
CubeSmart investor presentation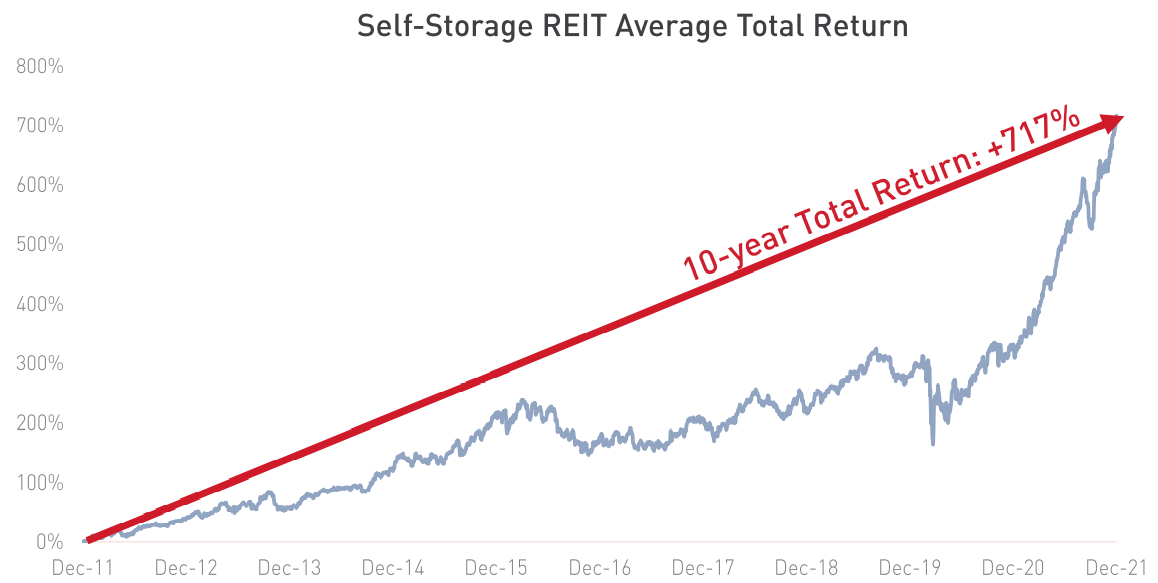
Despite stellar earnings and cash flow growth, CUBE’s share price has languished, losing (-25.3)% thus far this year.
Seeking Alpha Premium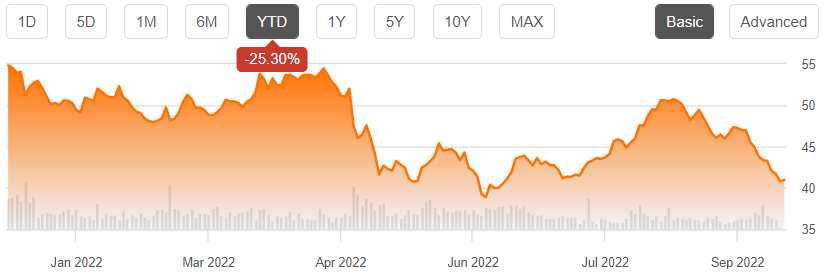
CUBE has underperformed most of its peers in the Storage REIT sector, bettering only National Storage Affiliates Trust’s (NSA) disappointing (-33.45)% return. So CUBE cannot be said to be among the 12 best-performing REITs in 2022 thus far.
Seeking Alpha Y-Charts
So what is going on with this perennial high-growth company?
Meet the company
CubeSmart
Founded in 2004 and headquartered in Malvern, Pennsylvania, CubeSmart owns and/or operates 1,289 properties in 155 markets, across 39 U.S. states, valued at $7.27 billion.
Company investor presentation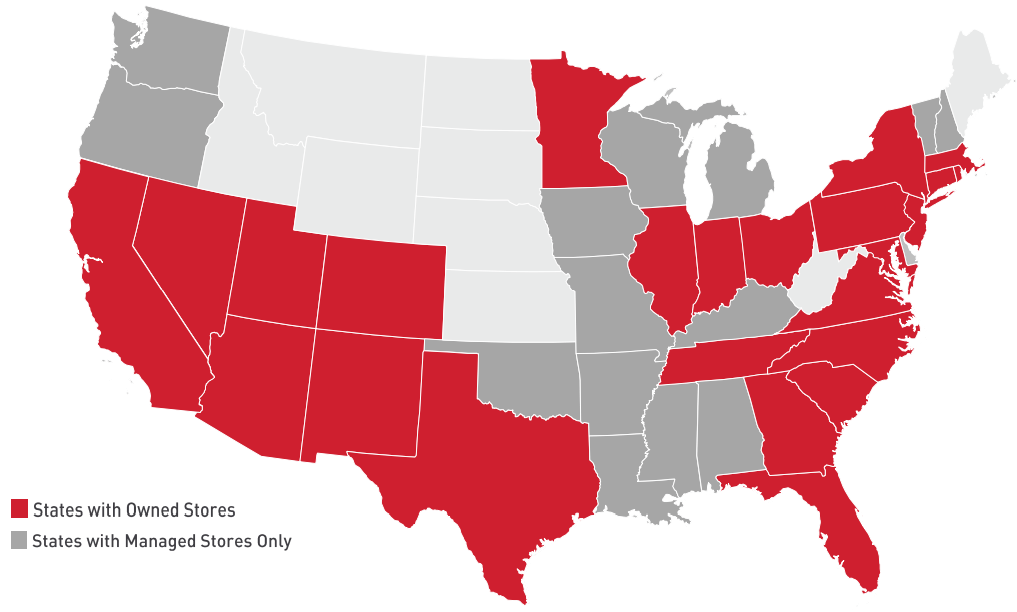
The company leans toward large urban areas, and chooses locations characterized by dense population. As the chart below shows, the larger the MSA (metropolitan statistical area), the more concentrated CUBE’s holding are, by NOI (net operating income). So the top 10 MSAs account for 59% of the company’s NOI, while the bottom 115 markets account for just 11%.
Company investor presentation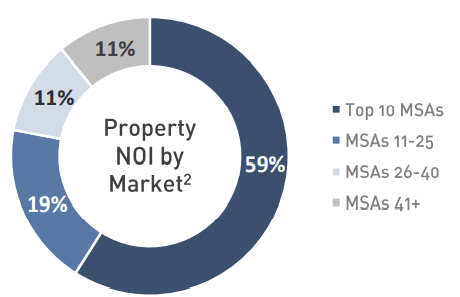
Within those urban areas, CUBE’s locations are in more densely-populated areas than any of its Storage REIT peers. The average number of people living within 3 miles of a CUBE location is about 175,000, compared to about 125,000 for runner-up Extra Space Storage (EXR).
Company investor presentation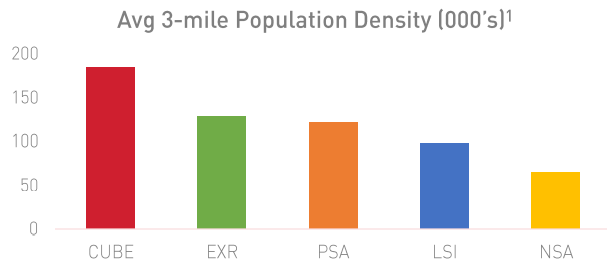
Thus, CUBE’s locations are more likely to be conveniently located for people living in multifamily housing. Same-store occupancy is currently 94%.
CUBE is a 21st-century company, using a fully integrated data platform to maximize service delivery and cash flows, provide scalability, and maximize demand capture and pricing. Thanks in large part to the company’s digital branding, social media, and paid search investments, the company’s website attracts 13.5 million visitors per year, and the sales center fields over a million calls. About 30% of customers sign up for rentals online.
Opportunities for growth abound. Publicly traded REITs own only about 25% of all the storage facilities in the U.S. CUBE pursues a 4-channel growth strategy:
- Acquisitions of well-positioned properties in markets with strong demographics and demand drivers.
- Development of new facilities in the most promising markets. (The company has about $78 million of new developments in the pipeline, all in Top 10 MSAs.)
- Joint ventures that generate enhanced returns at lower risk. (CUBE is currently involved in 5 JVs, involving 89 properties and $1.0 billion.)
- Third-party management to generate additional scale, branding power, and customer insight. (CUBE currently has over 200 third-party relationships, covering 680 properties, generating $31 million per annum in management fees.)
Since 2010, the number of properties owned or managed by CUBE has nearly tripled. There is a clear trend toward more third-party management, which now accounts for more than half of the total, while the number of joint ventures has been scaled back, particularly in the past couple of years.
CubeSmart Portfolio Growth (Company investor presentation)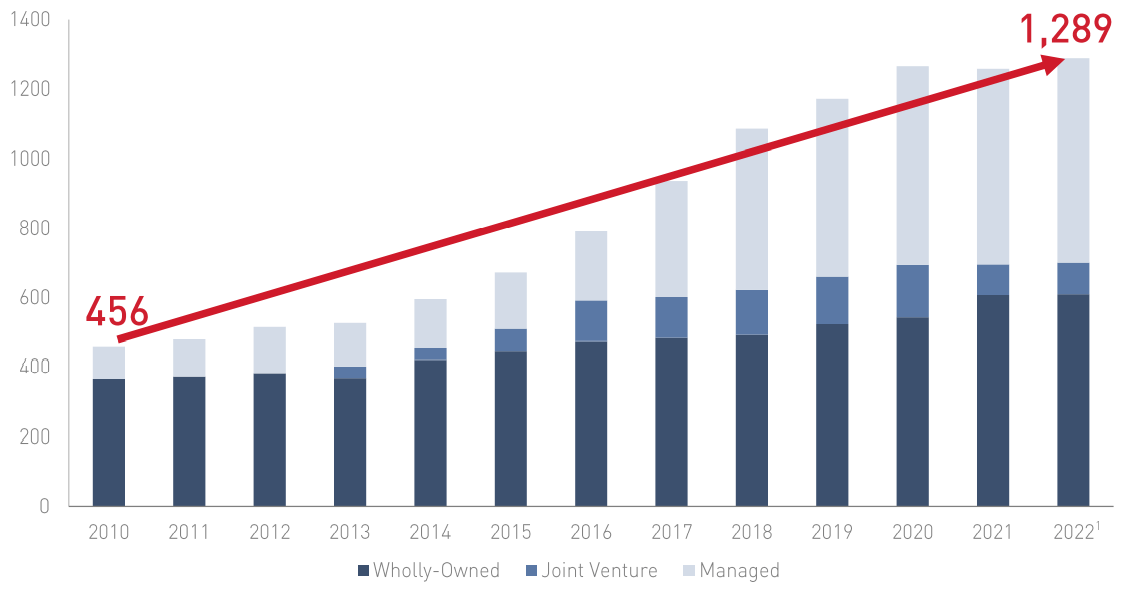
Quarterly results
According to the company’s latest 10-Q, filed August 5, here are some of the highlights from the Q2 and H1 results for CubeSmart.
| Metric | Q1 2022 | Change YoY | H1 2022 | Change YoY |
| Total revenue (millions) | $248.7 | 24.8% | $487.2 | 25.5% |
| Operating expenses (millions) | $166.2 | 28.4% | $333.9 | 30.7% |
| Net Income (millions) | $ 58.6 | 16.3% | $ 96.9 | 3.4% |
| Cash from Operations (millions) | NR | NR | $284.3 | 30.8% |
| Net Income per Share | $0.26 | 8.3% | $0.43 | (-4.5)% |
| Same Store Revenue (millions) | NR | NR | $192.0 | 14.0% |
| Core FFO (millions) | $139.1 | 32.1% | $261.6 | 16.0% |
| Core FFO per Share | $0.62 | 24.0% | $1.16 | 14.9% |
NR = Not reported
The company has only increased its share count by 0.3% this calendar year.
As you can see from the table above, with funds from operations (“FFO”) per share up 24.0% YoY for the quarter, and 14.9% for the first half, the company’s performance has been stellar. Thus the share price is disconnected from CUBE’s fundamentals, and appears to be a function primarily of the investor stampede to yield, caused by 40-year–high inflation and the Fed’s tightening of the money supply.
CEO Chris Marr summed it up this way on the Q2 earnings call:
Looking across all of our markets, we saw consistent performance, up and down the coast and throughout the central part of the United States. So, self-storage continues to be performing quite well. Our consumer continues to be pretty healthy and we’re very encouraged by the first half of 2022 and look forward to a very successful second half as well.
In Q2, CUBE acquired a property in San Antonio for a purchase price of $23 million, bringing total acquisitions for H1 2022 to $55 million. The company also invested $13.6 million in land underlying two of their existing properties, plus an additional $59.1 million of an anticipated $84.1 million total cost in a joint venture developing two new locations in New York.
CUBE has also completed construction on 5 new properties on the East Coast, at a total cost of $117.7 million. Two of these are owned outright by CUBE, and they own a majority interest of 70% – 90% on the other three. These 5 locations are all open for business.
The company raised guidance for same-store revenue growth for 2022 by 275 basis points, to 12.0% at the midpoint, and raised guidance for same-store NOI growth by 450 basis point, to 15.5% at the midpoint.
Growth metrics
Here are the 3-year growth figures for FFO (funds from operations), TCFO (total cash from operations), and market cap.
| Metric | 2019 | 2020 | 2021 | 2022* | 3-year CAGR |
| FFO (millions) | $326 | $321 | $410 | $523 | — |
| FFO Growth % | — | (-1.5) | 27.7 | 27.6 | 17.1% |
| FFO per share | $1.69 | $1.72 | $2.11 | $2.49 | — |
| FFO per share growth % | — | 1.8 | 22.7 | 18.0 | 13.8% |
| TCFO (millions) | $332 | $351 | $449 | $569 | — |
| TCFO Growth % | — | 5.6 | 27.9 | 26.7 | 19.7% |
*Projected, based on H1 2022 results
Source: TD Ameritrade, CompaniesMarketCap.com, and author calculations
As you can see from the table above, despite a slow-down in pandemic-plagued 2020, this company is growing at a sizzling double-digit rate in revenue and cash flow, sustained over a 3-year period.
Meanwhile, here is how the stock price has done over the past 3 twelve-month periods, compared to the REIT average as represented by the Vanguard Real Estate ETF (VNQ).
| Metric | 2019 | 2020 | 2021 | 2022 | 3-yr CAGR |
| CUBE share price Sept. 22 | $35.62 | $31.93 | $51.37 | $41.12 | — |
| CUBE share price Gain % | — | (-10.4) | 60.8 | (-20.0) | 4.9% |
| VNQ share price Sept. 22 | $93.45 | $78.68 | $106.83 | $85.48 | — |
| VNQ share price Gain % | — | (-15.8) | 35.8 | (-20.0) | (-2.9)% |
Source: MarketWatch.com and author calculations
As you can see, CUBE has matched or outperformed the VNQ in each of the past 3 years, returning an average share price Gain of 4.9%, compared to the VNQ’s loss of (-2.9)%.
Meanwhile, CUBE’s market cap sits right in the sweet spot, growing from $6.76 billion on September 29, 2019 to its current level of $9.28 billion. That’s a 3-year CAGR of 11.2% in market cap.
Everything about this company says healthy and growing fast.
Balance sheet metrics
CubeSmart’s bond-rated balance sheet is solid but not spectacular, with liquidity ratio, debt ratio, and debt/EBITDA all under the REIT average. The liquidity ratio is lower than the Storage sector average as well, but comfortably above the FROG cut-off of 1.66, qualifying CUBE as a bona fide FROG.
| Company | Liquidity Ratio | Debt Ratio | Debt/EBITDA | Bond Rating |
| CUBE | 1.82 | 20% | 5.2 | BBB |
Source: Hoya Capital Income Builder, TD Ameritrade, and author calculations
CUBE holds $2.77 billion in senior notes, at a weighted average interest rate of 3.67%. The debt maturity schedule is shown below. There are no payments due for the rest of 2022, and only $31.2 million due in 2023. Over the subsequent three years, the payment totals climb steadily to $337.0 million, then there are no payments due at all in 2027. The debts due in 2028 – 2032 carry a weighted average interest rate of only 2.79%.
Company investor presentation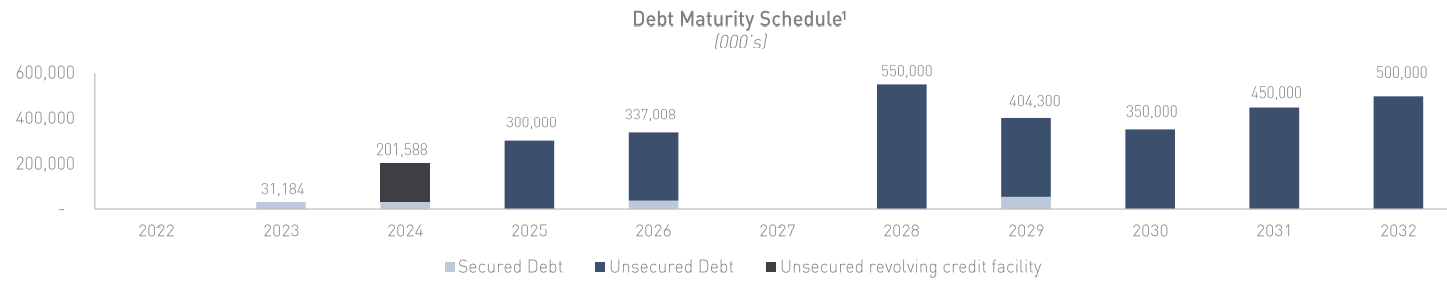
As of June 30, the company was holding $5 million in cash, and receivables minus payables equaled an additional $9 million.
Dividend metrics
This is another area where CUBE shines. The current Yield and dividend growth rate are above both the Storage and overall REIT averages, and probably will continue separating from the pack for the next 3 years. This is a fine little income investment, by REIT standards.
| Company | Div. Yield | 3-yr Div. Growth | Div. Score | Payout | Div. Safety |
| CUBE | 4.18% | 10.1% | 5.58% | 70% | C+ |
Source: Hoya Capital Income Builder, TD Ameritrade, Seeking Alpha Premium
Dividend Score projects the Yield three years from now, on shares bought today, assuming the Dividend Growth rate remains unchanged.
Valuation metrics
The kind of growth that CubeSmart has exhibited over the past several years usually comes at a premium price. Surprisingly however, this is not the case. CUBE sells below both the REIT average and the Storage sector average, at a whopping discount to NAV of 29.1%.
| Company | Div. Score | Price/FFO ’22 | Premium to NAV |
| CUBE | 5.58% | 16.5 | (-29.1)% |
Source: Hoya Capital Income Builder, TD Ameritrade, and author calculations
What could go wrong?
CUBE is more sensitive to inflation and interest rate increases than the average REIT. If a recession occurs, the blow to employment and discretionary spending would affect the company’s revenues. CUBE’s properties in New York, Florida, Texas and California together accounted for 51% of total 2021 revenues. As a result of this geographic concentration of their assets, CUBE would be particularly susceptible to adverse market conditions in these areas. New development is subject to increased costs from labor and material shortages. CUBE competes with other publicly traded REITs for acquisitions.
Investor’s bottom line
CubeSmart is a bona fide FROG, selling for a surprising discount, yielding higher than the REIT average in a low-yielding sector, and growing its dividend faster than average. Flush with cash and unappreciated by the market, there is a high likelihood of more dividend increases in store. This is the rare company that is compelling, for both growth investors and value investors.
In the short run, nothing is a Buy until the market sorts itself out. However, if your investment horizon is at least two or three years out, this company is a definite Buy.
Seeking Alpha Premium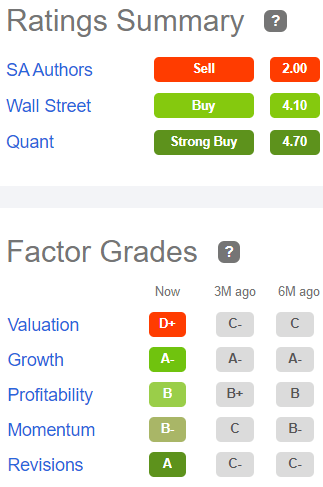
This opinion puts me in company with 6 of the 10 Wall Street analysts covering CUBE, while the Seeking Alpha Quant ratings system also maintains a Strong Buy.
Seeking Alpha Premium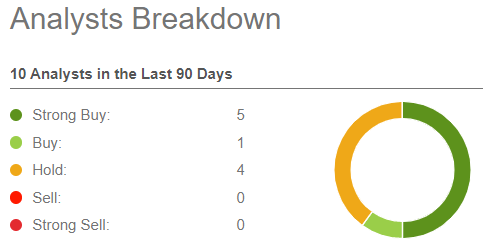
The Street and revisions-sensitive Zacks both maintain a Buy recommendation, while Ford Equity Research says Hold.
But in the final analysis, it is your opinion that really counts.
Be the first to comment