

Crude Oil Price Talking Points
The price of oil extends the series of higher highs and lows from earlier this week amid a larger-than-expected decline in US inventories, and crude may stage a larger recovery over the coming days if it manages to clear the opening range for August.
Crude Oil Price to Stage Larger Recovery on Break of August Opening Range
The price of oil appeared to be on track to test the yearly low ($74.27) after failing to defend the February low ($86.55), but data prints coming out of the US seems to be fueling the rebound from the monthly low ($85.73) as crude stockpiles contract for the second consecutive week.
US inventories fell 3.282M in the week ending August 19 versus forecasts for a 0.933M decline, and indications of robust demand may lead to a larger recovery in the price of oil even as the Organization of Petroleum Exporting Countries (OPEC) plan to increase output by “0.1 mb/d for the month of September 2022.”
It remains to be seen if OPEC will respond to the developments coming out of the US as the most recent Monthly Oil Market Report (MOMR) reveals that “for 2022, world oil demand is foreseen to rise by 3.1 mb/d, a downward revision of 0.3 mb/d from last month’s estimate,” and the price of oil may face headwinds ahead of the next Ministerial Meeting on September 5 as the group appears to be on track to boost production throughout the remainder of the year.
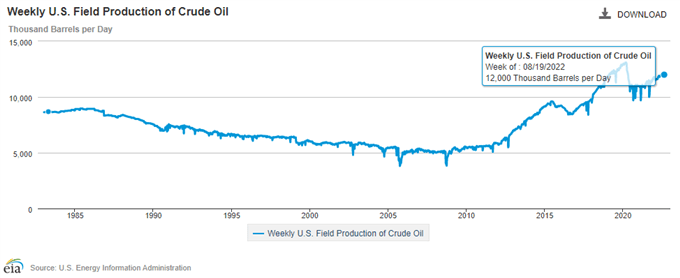
Nevertheless, a deeper look at the figures from the Energy Information Administration (EIA) show weekly field production narrowing for the second week, with output slipping to 12,000K from 12,100K in the week ending August 12, and current market conditions may lead to a further advance in the price of oil as evidence of robust demand are met with indications of limited supply.
With that said, recent price action raises the scope for a larger rebound in crude as it appears to be on track to test the monthly high ($92.42), but the rebound from the monthly low ($85.73) may turn out to be a near-term correction if the price of oil tracks the negative slope in the 50-Day SMA ($98.32).
Crude Oil Price Daily Chart
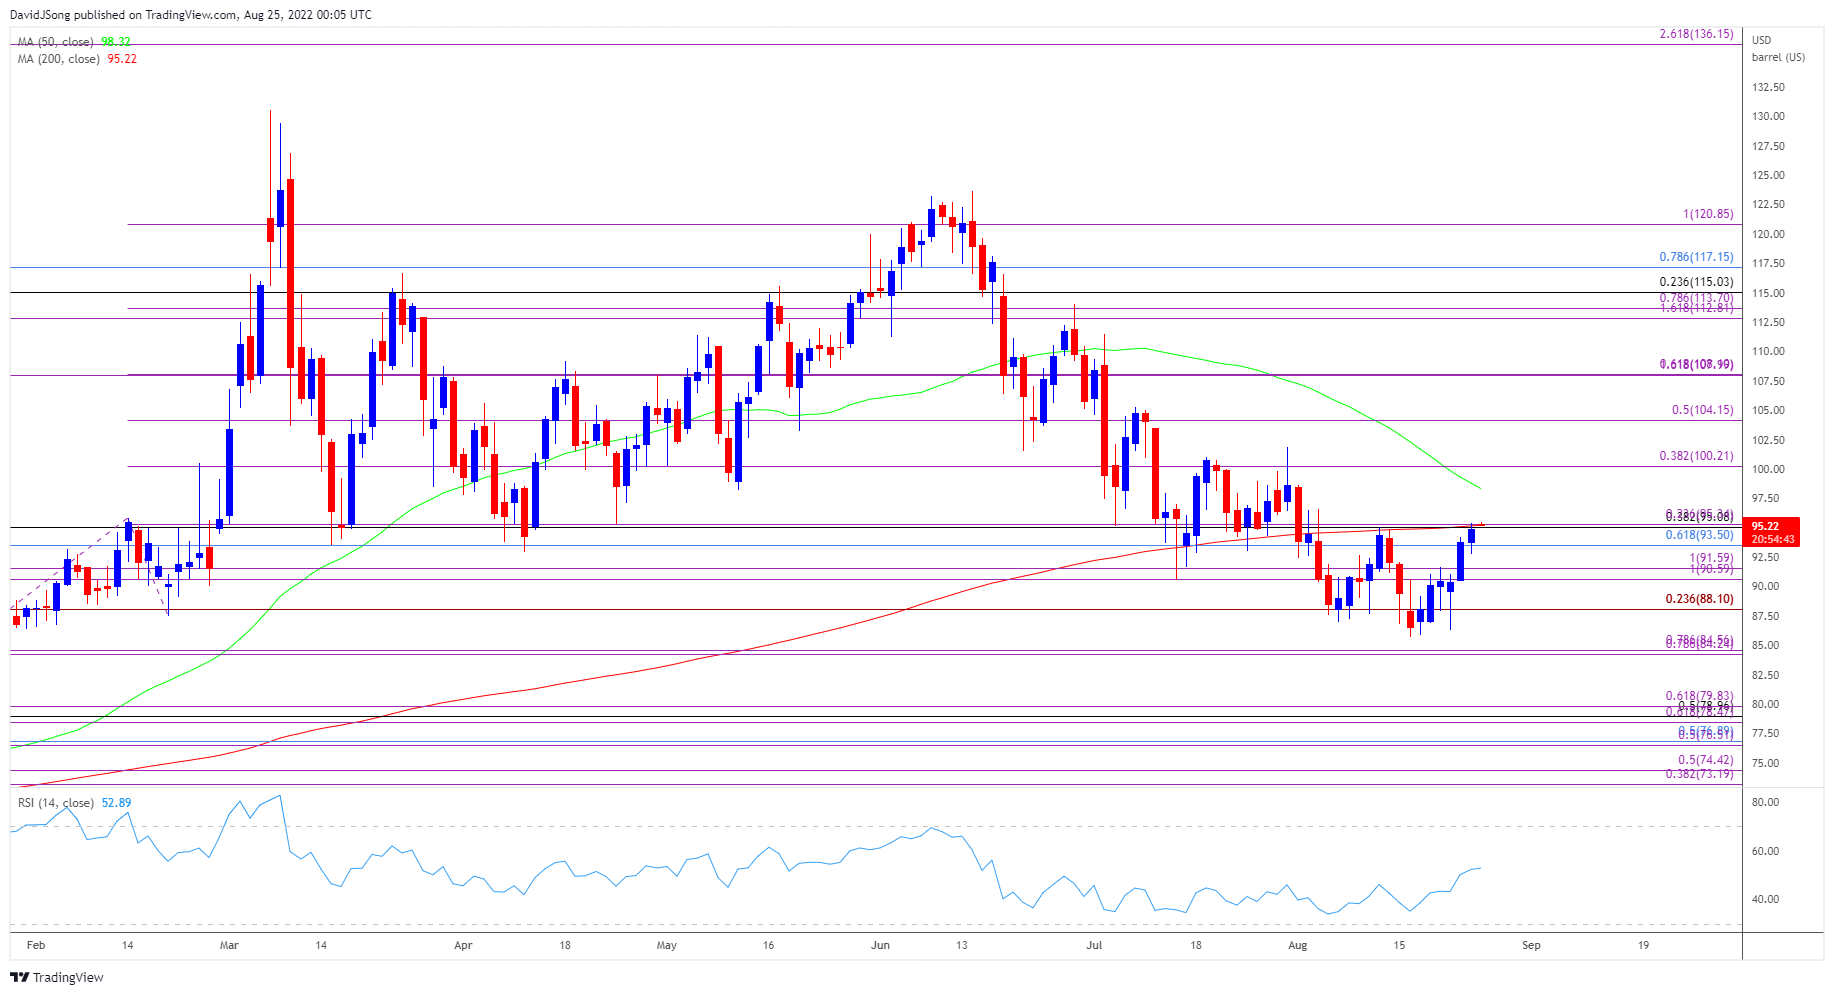
Source: Trading View
- The price of oil may attempt to clear the opening range for August after finding support ahead of the former-resistance zone around the October 2021 high ($85.41), but need a close above the Fibonacci overlap around $93.50 (61.8% retracement) to $95.30 (23.6% expansion) to bring the monthly high ($92.42) on the radar.
- Next area of interest comes in around $100.20 (38.2% expansion), but the rebound from the monthly low ($85.73) may turn out to be a near-term correction if the price of oil tracks the negative slope in the 50-Day SMA ($98.32).
- Lack of momentum to close above overlap around $93.50 (61.8% retracement) to $95.30 (23.6% expansion) may undermine the recent series of higher highs and lows in the price of oil, with a move below the $90.60 (100% expansion) to $91.60 (100% expansion) region bringing the $88.10 (23.6% expansion) area back on the radar.
— Written by David Song, Currency Strategist
Follow me on Twitter at @DavidJSong
Be the first to comment