

fotoslavt/iStock via Getty Images
Stocks may be heading to new lows, and the QQQ ETF (QQQ) may lead them there as real rates explode and the TIPS ETF (TIP) falls to new cycle lows. The S&P 500 (SP500, SPX) will not be immune to these new lows as the index continues to track the 2008 bear market cycle.
Inflation Much Hotter Than Expected
CPI was worse than expected, and what made matters worse was not only was it hotter than expected, this was the month that energy and gasoline were supposed to help the CPI m/m reading turn negative. Imagine how bad the numbers would have been if gasoline prices hadn’t fallen by 10.6% and energy hadn’t dropped by 5.9%.
For the month, CPI rose by 0.1% vs. estimates for a decline of 0.1%. Meanwhile, the year-over-year reading was 8.3% vs. estimates of 8.1%. But really, what was even worse was that core numbers were much higher than expected, which is the biggest problem. Core CPI rose 0.6% vs. estimates for +0.3%, and rose by 6.3% vs. estimates for 6.1%. Even worse – core was hotter than last month’s 0.3% m/m gain and 5.9% y/y gain. It seems core inflation rates are going in the wrong direction.
While once again the equity market was prepared for a CPI miss, the Cleveland Fed was predicting a hotter than expected CPI report and that it was coming in even hotter than the Cleveland Fed’s estimates.
Bloomberg
Worse than that, the Atlanta Fed 12-Month Sticky CPI hit a new cycle high of 6.13%. This sticky measure of inflation has shown no sign of slowing or flattening. It’s still rising at a near exponential pace.
Bloomberg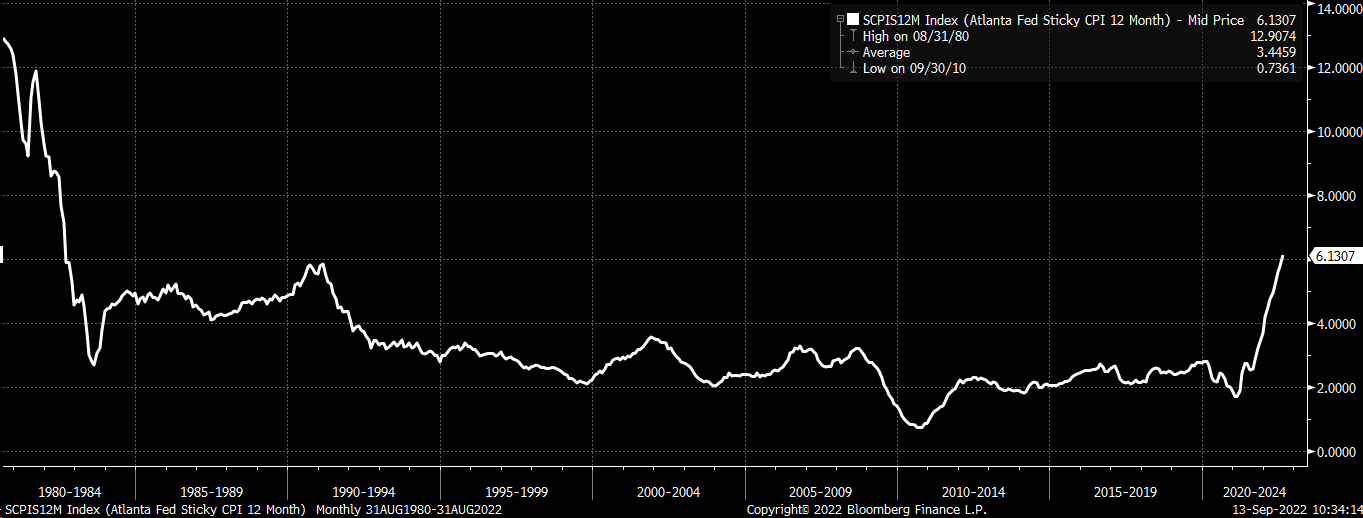
Rates Soar
Fed Fund Futures are exploding higher, with a peak terminal Fed Funds rate at 4.3%, which is up nearly 30 bps today alone. That’s a new cycle high for the Fed fund futures, surpassing the June 14 pre-FOMC meeting highs set following the hot June CPI print.
Bloomberg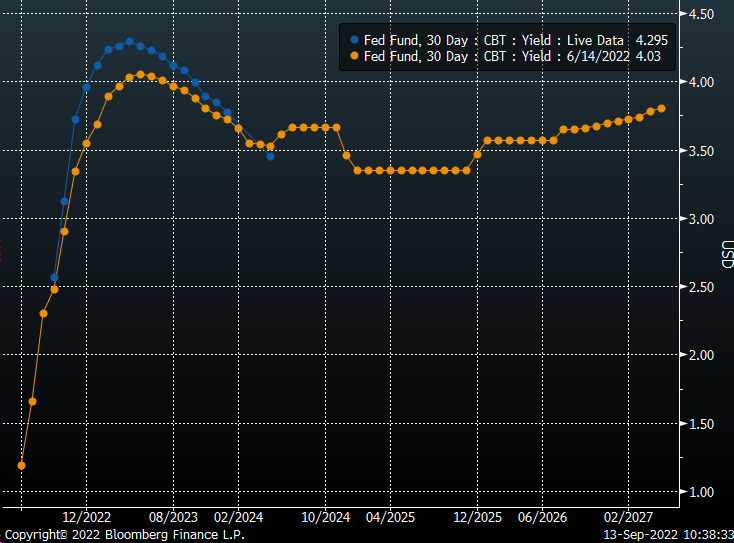
2-Year Yield
Two-Year yields also are exploding, climbing 16 bps to 3.74%, and are now well on their way to tracking Fed fund futures to probably above 4%. There’s hardly any form of resistance to stop the 2-Year rate from rising to between 4 and 4.25%
TradingView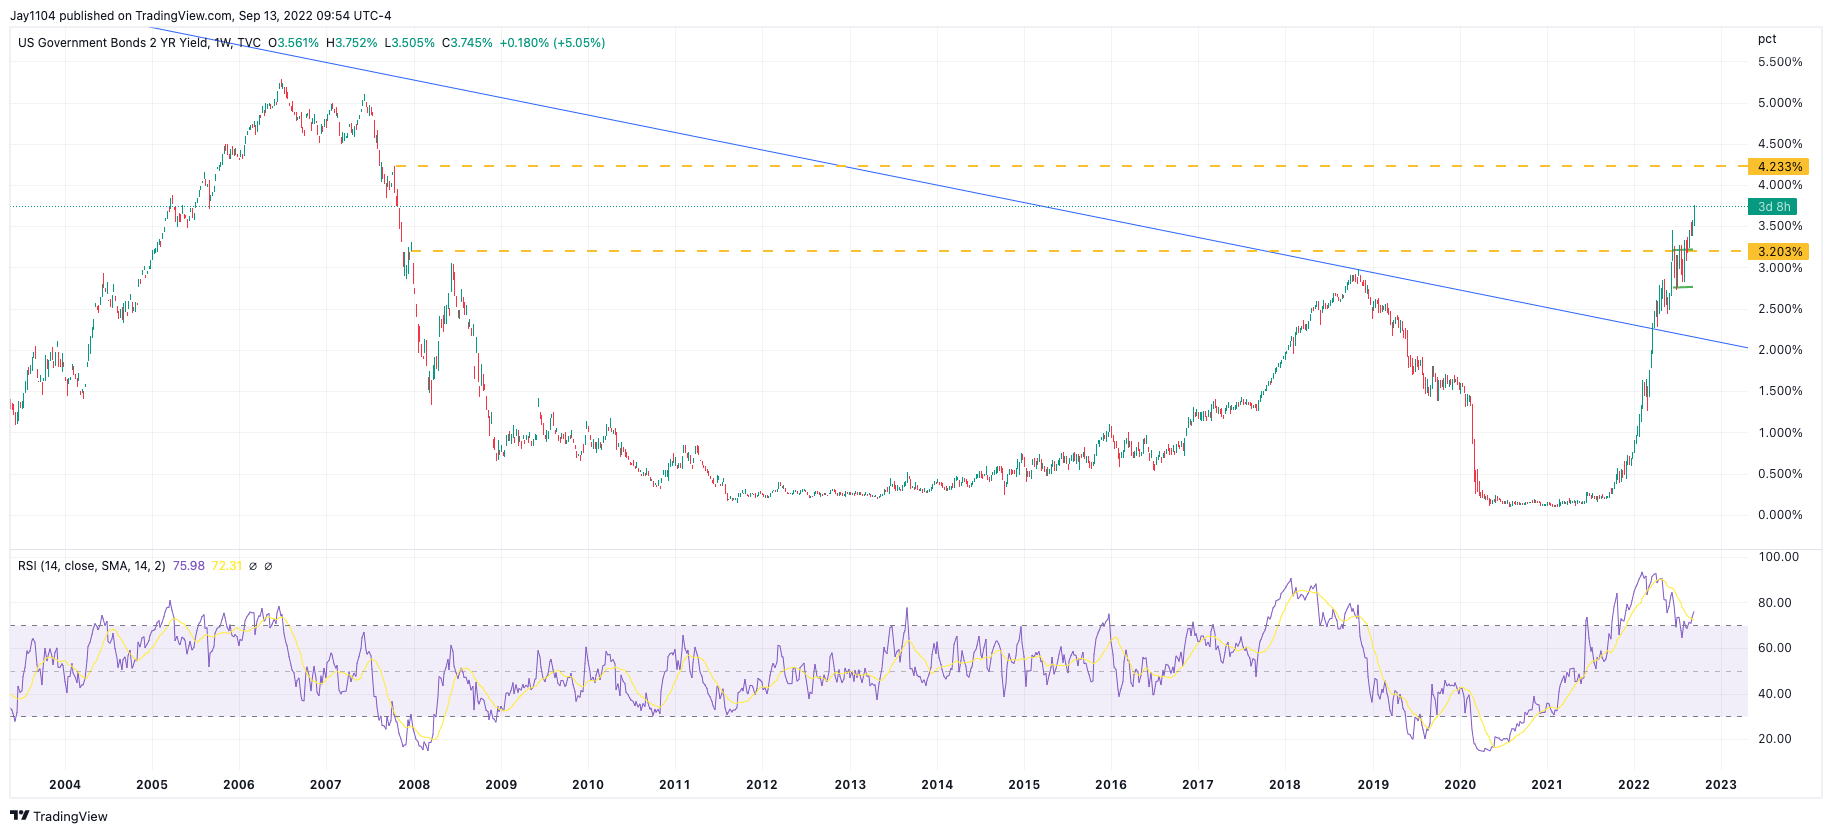
10-Year Rate
It may not only be the 2-Year heading to 4% because the 10-Year may be on a similar path higher. The 10-Year also approaches technical resistance at around 3.5%, with very little resistance standing in its way from rising to its next technical resistance level until the 4% area.
TradingView
Real Yields
Rising nominal rates are sending real yield soaring, with the 10-Year TIP rising to 100 bps, which means the TIP ETF is making another new low. When the TIP ETF makes new lows, it’s terrible news for the QQQ ETF and the overall stock market. Because, as we have discussed for months when real yields rise and the TIP ETF drops, the QQQ follows over time.
If the TIP ETF indicates where the QQQ is going and where the stock market is heading, the QQQ will likely be making a new low as the TIP makes new lows. The relationship has been strong for five years, so at this point, to bet on the relationship suddenly decoupling seems low.
Bloomberg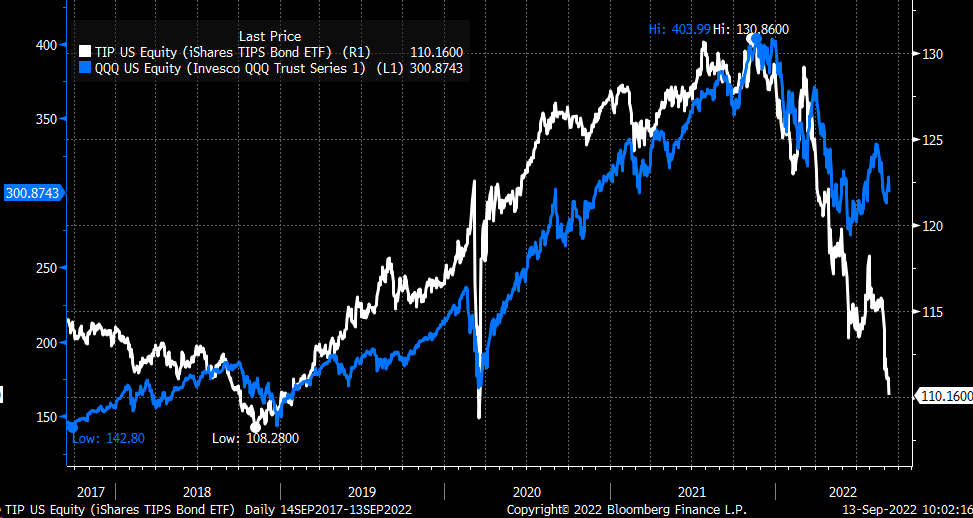
Nasdaq 100
That spread suggests the Nasdaq 100 (NDX) is very expensive relative to the 10-Year real yield. When comparing the Nasdaq earnings yield versus the 10-Year real yield, we find that the Nasdaq hasn’t been this expensive to the 10-Year real Rate since October 2009. To get the spread between the Nasdaq earnings yield and the 10-Year to around 4%. The Nasdaq earnings yield would need to rise by around 60 bps. This is massive and assumes the 10-Year real yield doesn’t rise further.
Bloomberg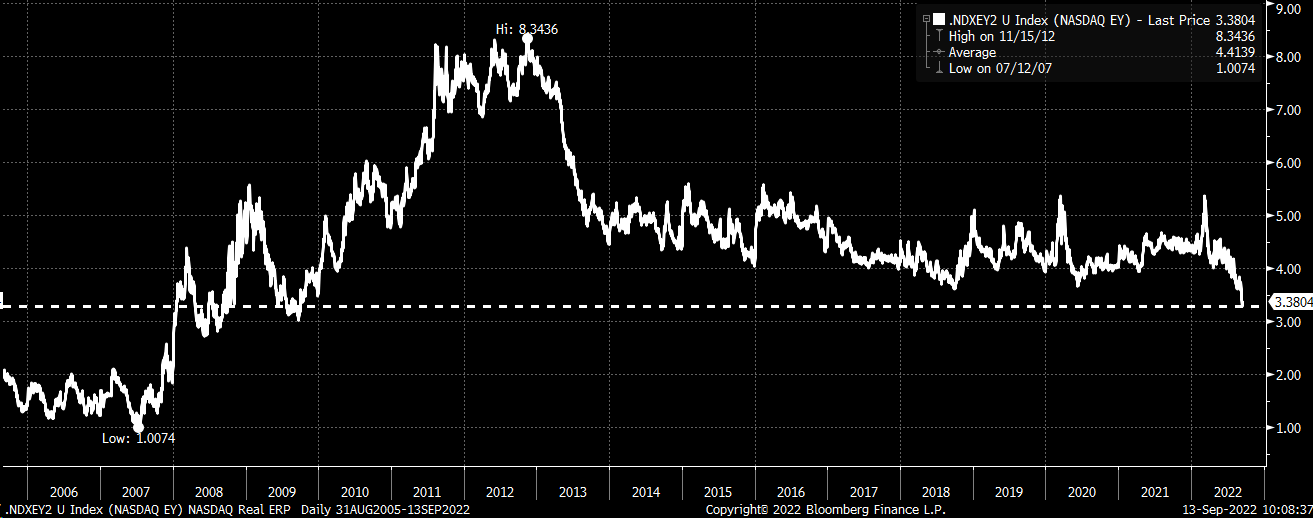
That would be equal to the Nasdaq earnings yield rising from 4.4% to 5%, pushing the PE ratio of the Nasdaq to 20 from 22.8. Based on earnings estimates of $538.35, the Nasdaq 100 would be worth 10,760, which is about 12.5% below current prices of around 12,300, and would send the Nasdaq 100 to a new low. That would be the equivalent of the QQQ dropping from $300 to $260, also a new low. It doesn’t help that earnings estimates in the Nasdaq 100 in 2022 have fallen to their lowest levels this Year.
Bloomberg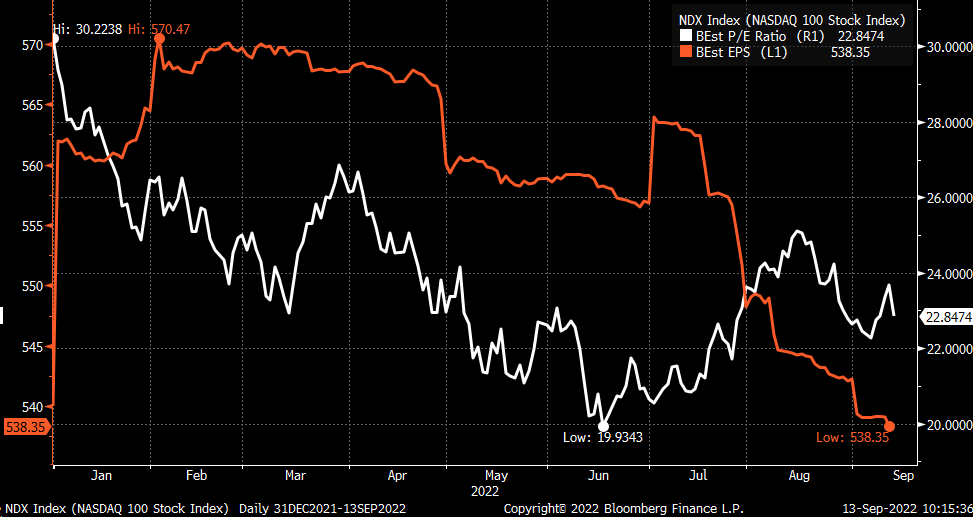
Technical Trends For Nasdaq
The technical pattern suggests the QQQ makes a new low as well with a bearish rising broadening wedge pattern that has been broken to the downside and has already been retested. This bearish pattern also suggests the potential for the QQQ to fall back to its lows.
TradingView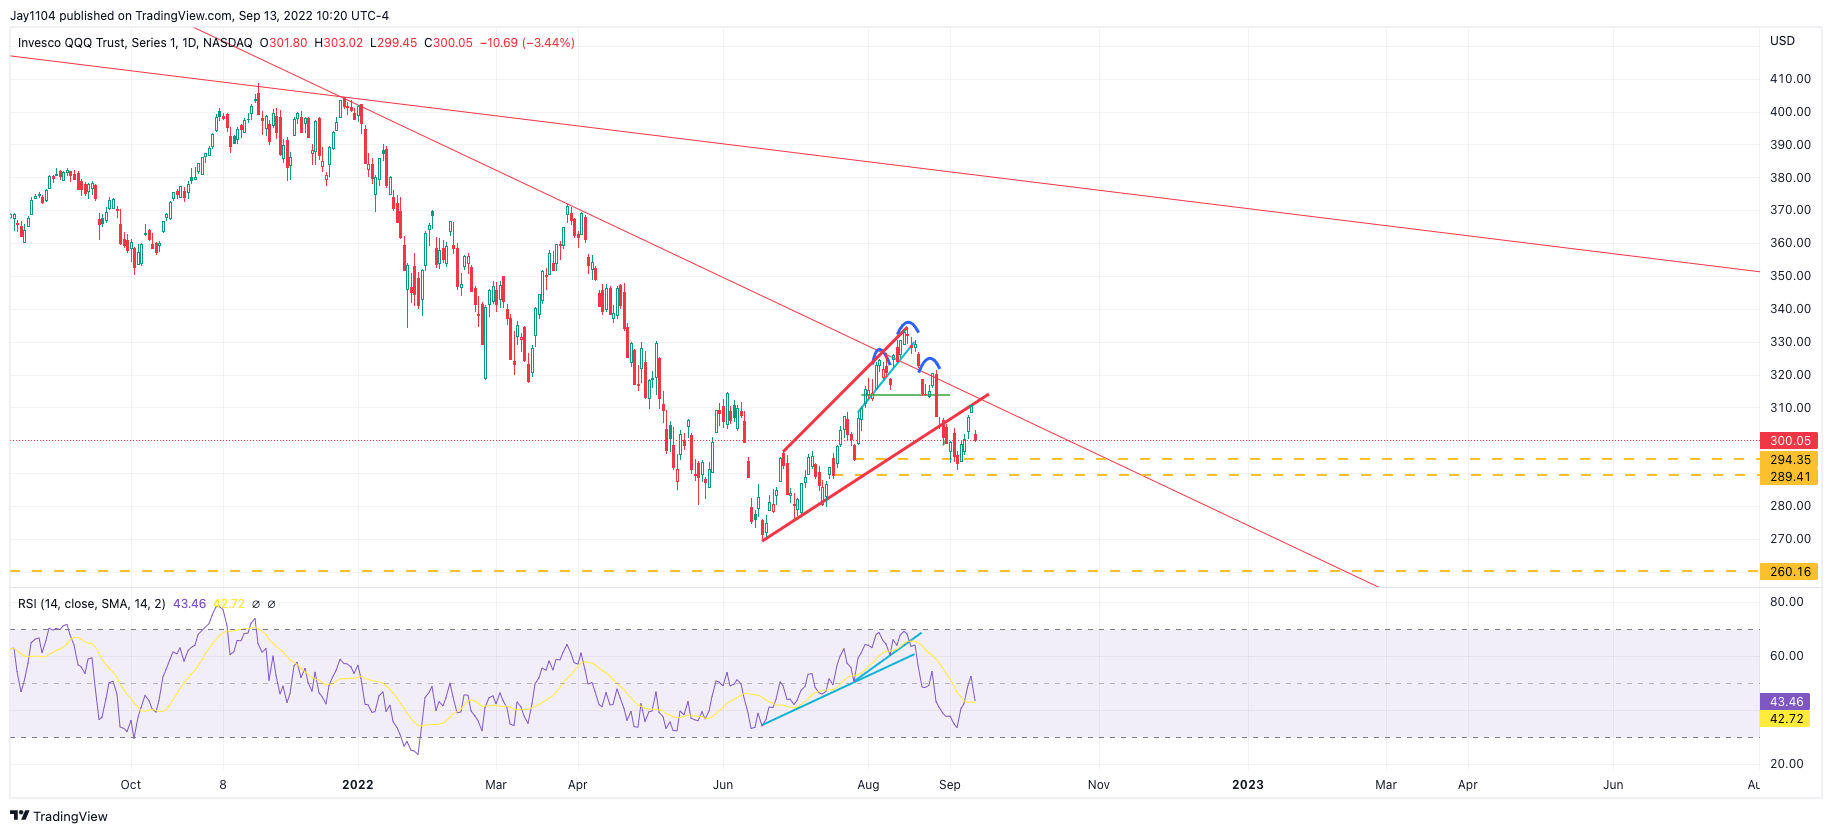
S&P 500
The same pattern is also present in the S&P 500. The only difference is that the S&P 500 hasn’t seen the index fall below the lower uptrend, and once that level breaks, which would come around 3,900, it would also signal new lows coming for the S&P 500.
TradingView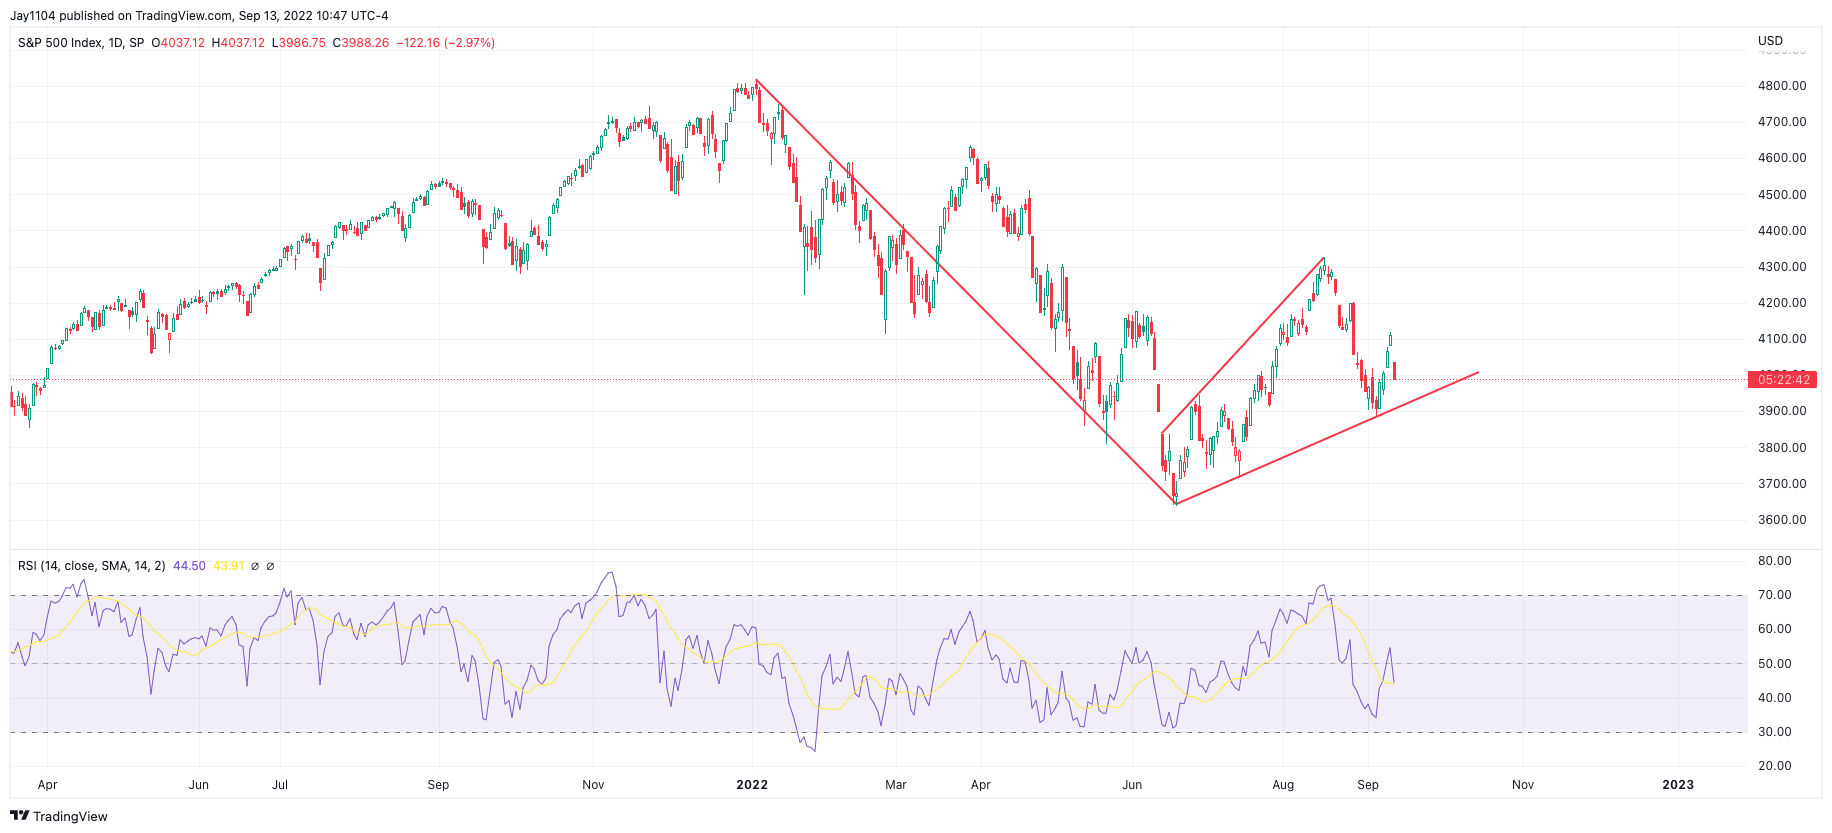
Additionally, as noted over the weekend, the S&P 500 continues to track the 2008 analog and appears to still be on schedule, nearly predicting this current turn lower in the market.
Bloomberg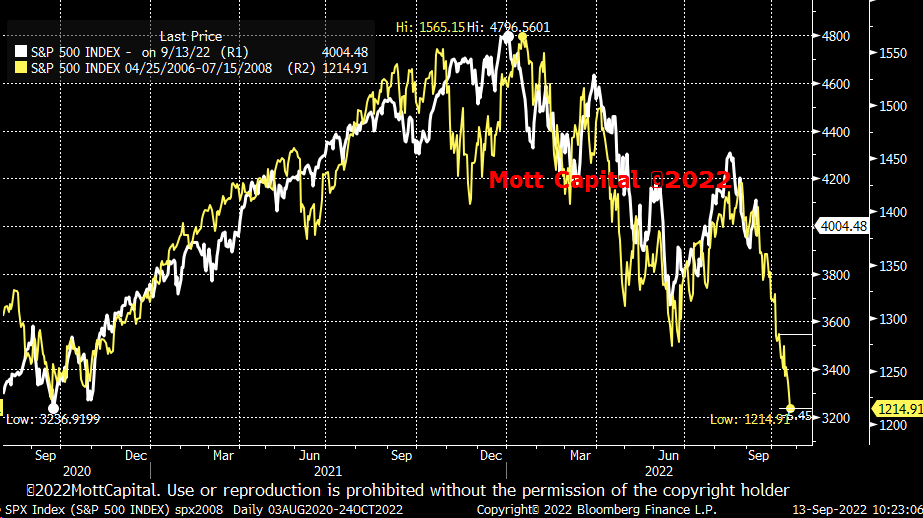
At this point, the market is repricing for even more rate hikes due to this hotter-than-expected CPI. August should have been a relief month, showing inflation under control. It instead turned out to be a disaster, and once again, we learn that the equity market was mispriced, a recurring theme in 2022.
Be the first to comment