

Khanchit Khirisutchalual
Summary Data and Analysis
Figure 1 below highlights key summary data and analysis for this month’s All Items CPI.
Figure 1: All Items: Change, Acceleration, Expectations & Surprise
All Items CPI (BLS, Investor Acumen)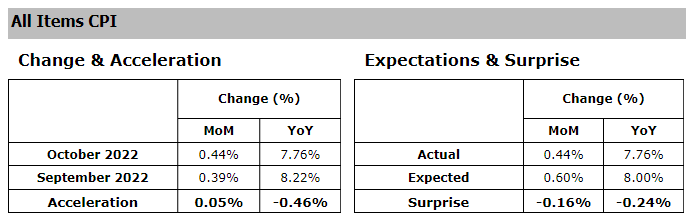
Source: BLS, Investing.com, Investor Acumen
As can be seen above, All-Items CPI decelerated significantly and significantly surprised to the downside.
Figure 2 below highlights key summary data and analysis for this month’s Core CPI.
Figure 2: Core: Change, Acceleration, Expectations & Surprise
Core CPI (BLS, Investor Acumen)
Source: BLS, Investing.com, Investor Acumen
As can be seen above, Core CPI also decelerated significantly, providing a significant downside surprise.
Analysis of Contributions of Key Aggregate Components of CPI
In Figure 3, we display the contributions to CPI inflation of five major aggregate components to the MoM (month-over-month) change in CPI and the MoM acceleration of CPI.
Figure 3: Analysis of Key Aggregate Components of CPI
Aggregate CPI Component Analysis (BLS, Investor Acumen)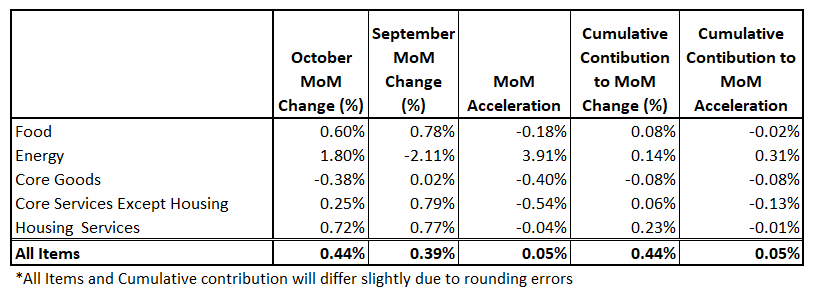
Source: BLS, Investor Acumen
We will briefly review how to interpret the table above (as well as other tables in this report), describing each column from left to right. The first column contains the MoM percent change for the current month. The second column contains the MoM percent change in the prior month. The third column contains the MoM acceleration – i.e. the difference between the percent change this month minus the percent change last month. The fourth column contains the Cumulative Contribution to the percent MoM change of CPI. This describes exactly how much each component contributed to the cumulative All Items MoM percent change in CPI. The sum of the values in this column will yield the MoM percent change of All Items CPI (with minor discrepancy due to rounding). Finally, the rightmost column contains the Cumulative Contribution to MoM Acceleration of All Items CPI. The sum of the contributions in this column adds up to the MoM Acceleration of All Items CPI. Although all five columns provide important information, we recommend that readers pay special attention to the rightmost column (Cumulative Contribution to Acceleration) as it reveals exactly what drove the MoM acceleration/deceleration in CPI during the current month compared to the prior month.
As can be seen in the table above, Core Services ex Housing and Core Goods decelerated very significantly, accounting for most of the overall deceleration in CPI. More details will be provided below.
Analysis of CPI Components that Contributed Most to Change & Acceleration of CPI
In the following section, we perform the same contribution analysis as above, but at a more granular level of detail. In Figure 4 below, we list the top 10 CPI components (most granular level) that contributed negatively and positively to the MoM percent change in All Items CPI. These contributions take into account both the magnitude of the MoM change in each component as well as the weight of each component in All Items CPI.
Figure 4: Top Contributors to MoM Percent Change
Top CPI Contributors (BLS, Investor Acumen)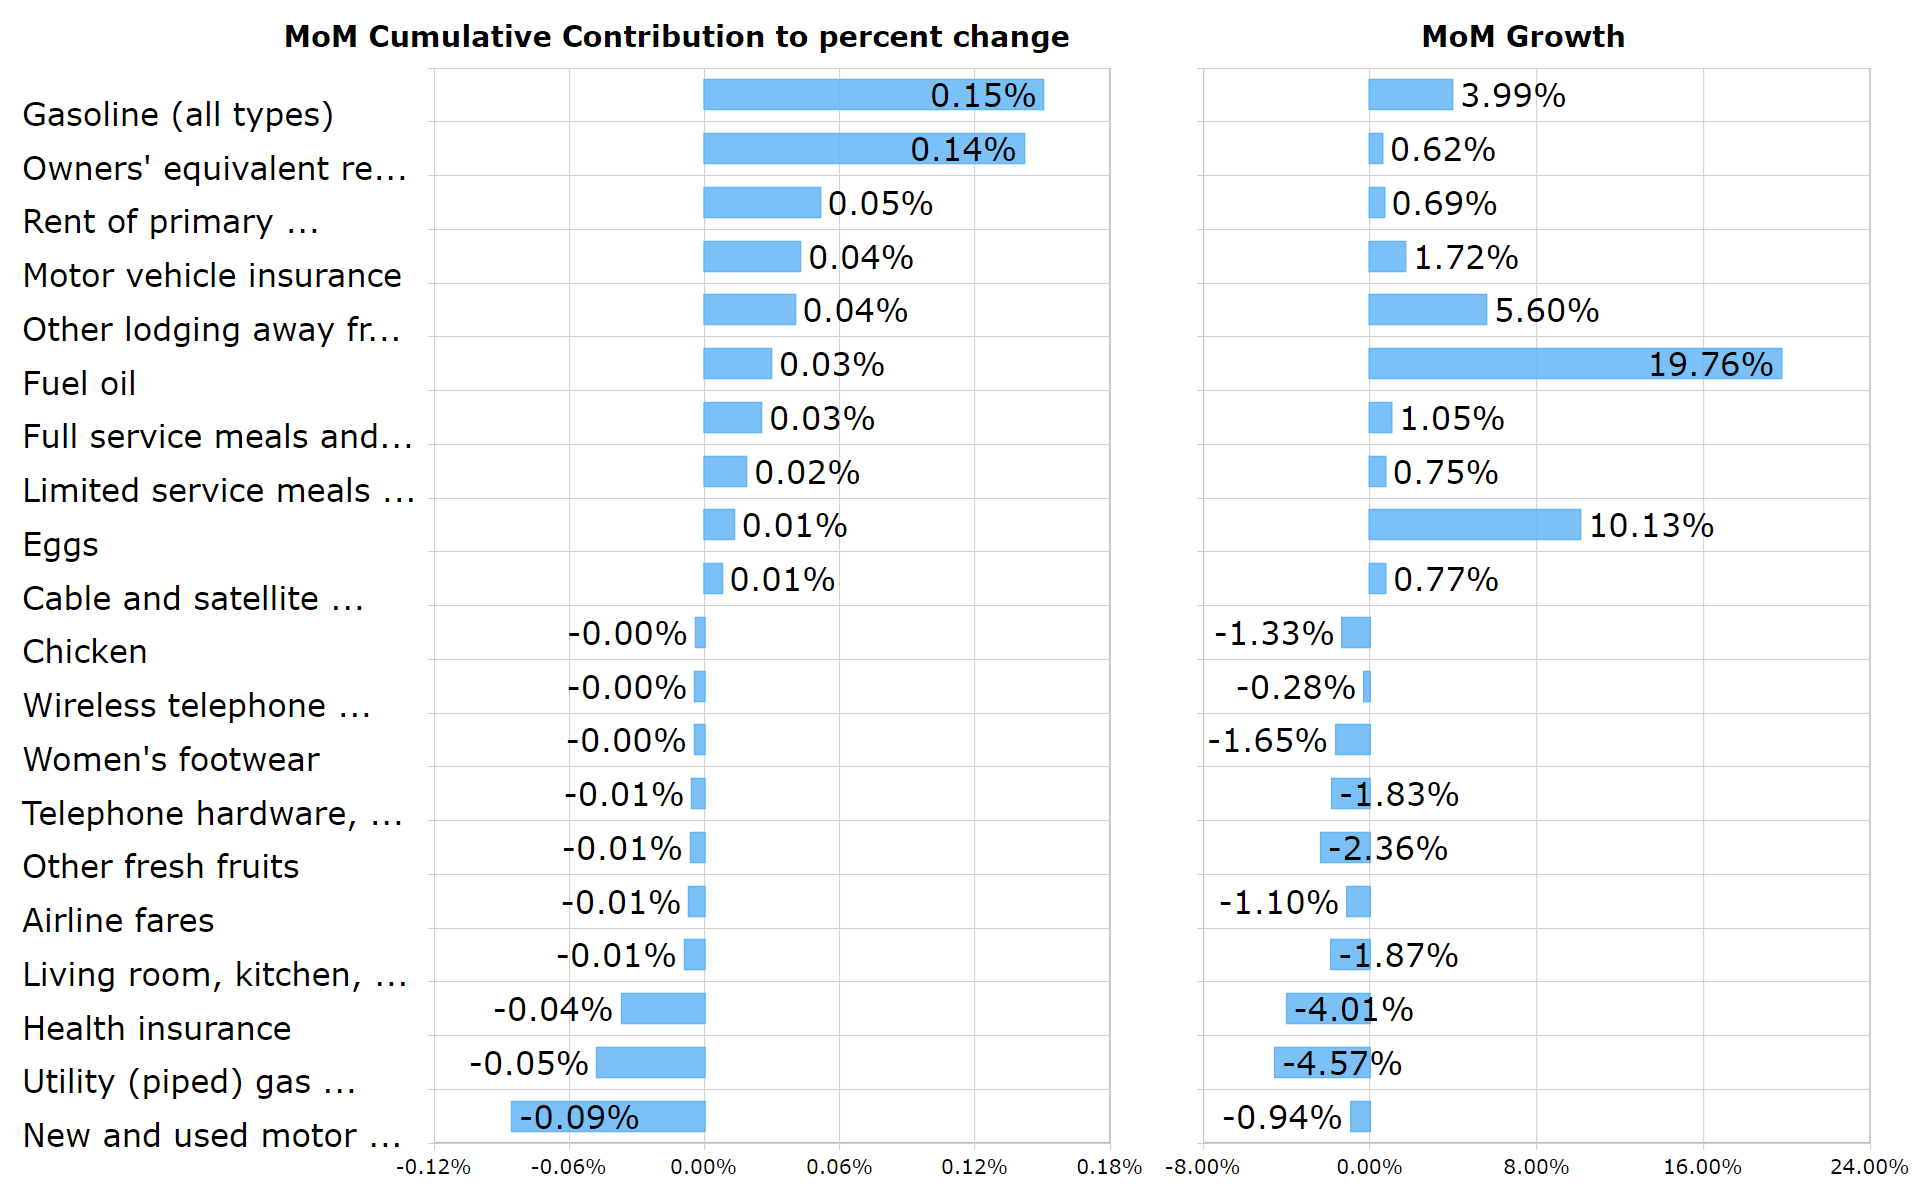
Source: BLS, Investor Acumen
One thing that emerges from this analysis is that a significant share of the deceleration of core CPI this month came from relatively volatile items, that might be considered “one-offs”. For example, the significant decline in new and used car prices and health insurance may not be representative of core inflationary dynamics.
In Figure 5 below, we list the top 10 CPI components, at the most granular level, that contributed negatively and positively to the MoM acceleration (expressed in percent change) of All Items CPI. These contributions take into account both the magnitude of the MoM accelerations in the components as well as the weight of each component All Items CPI.
Figure 5: Top Contributors to MoM Acceleration
Top CPI Acceleration Contributors (BLS, Investor Acumen)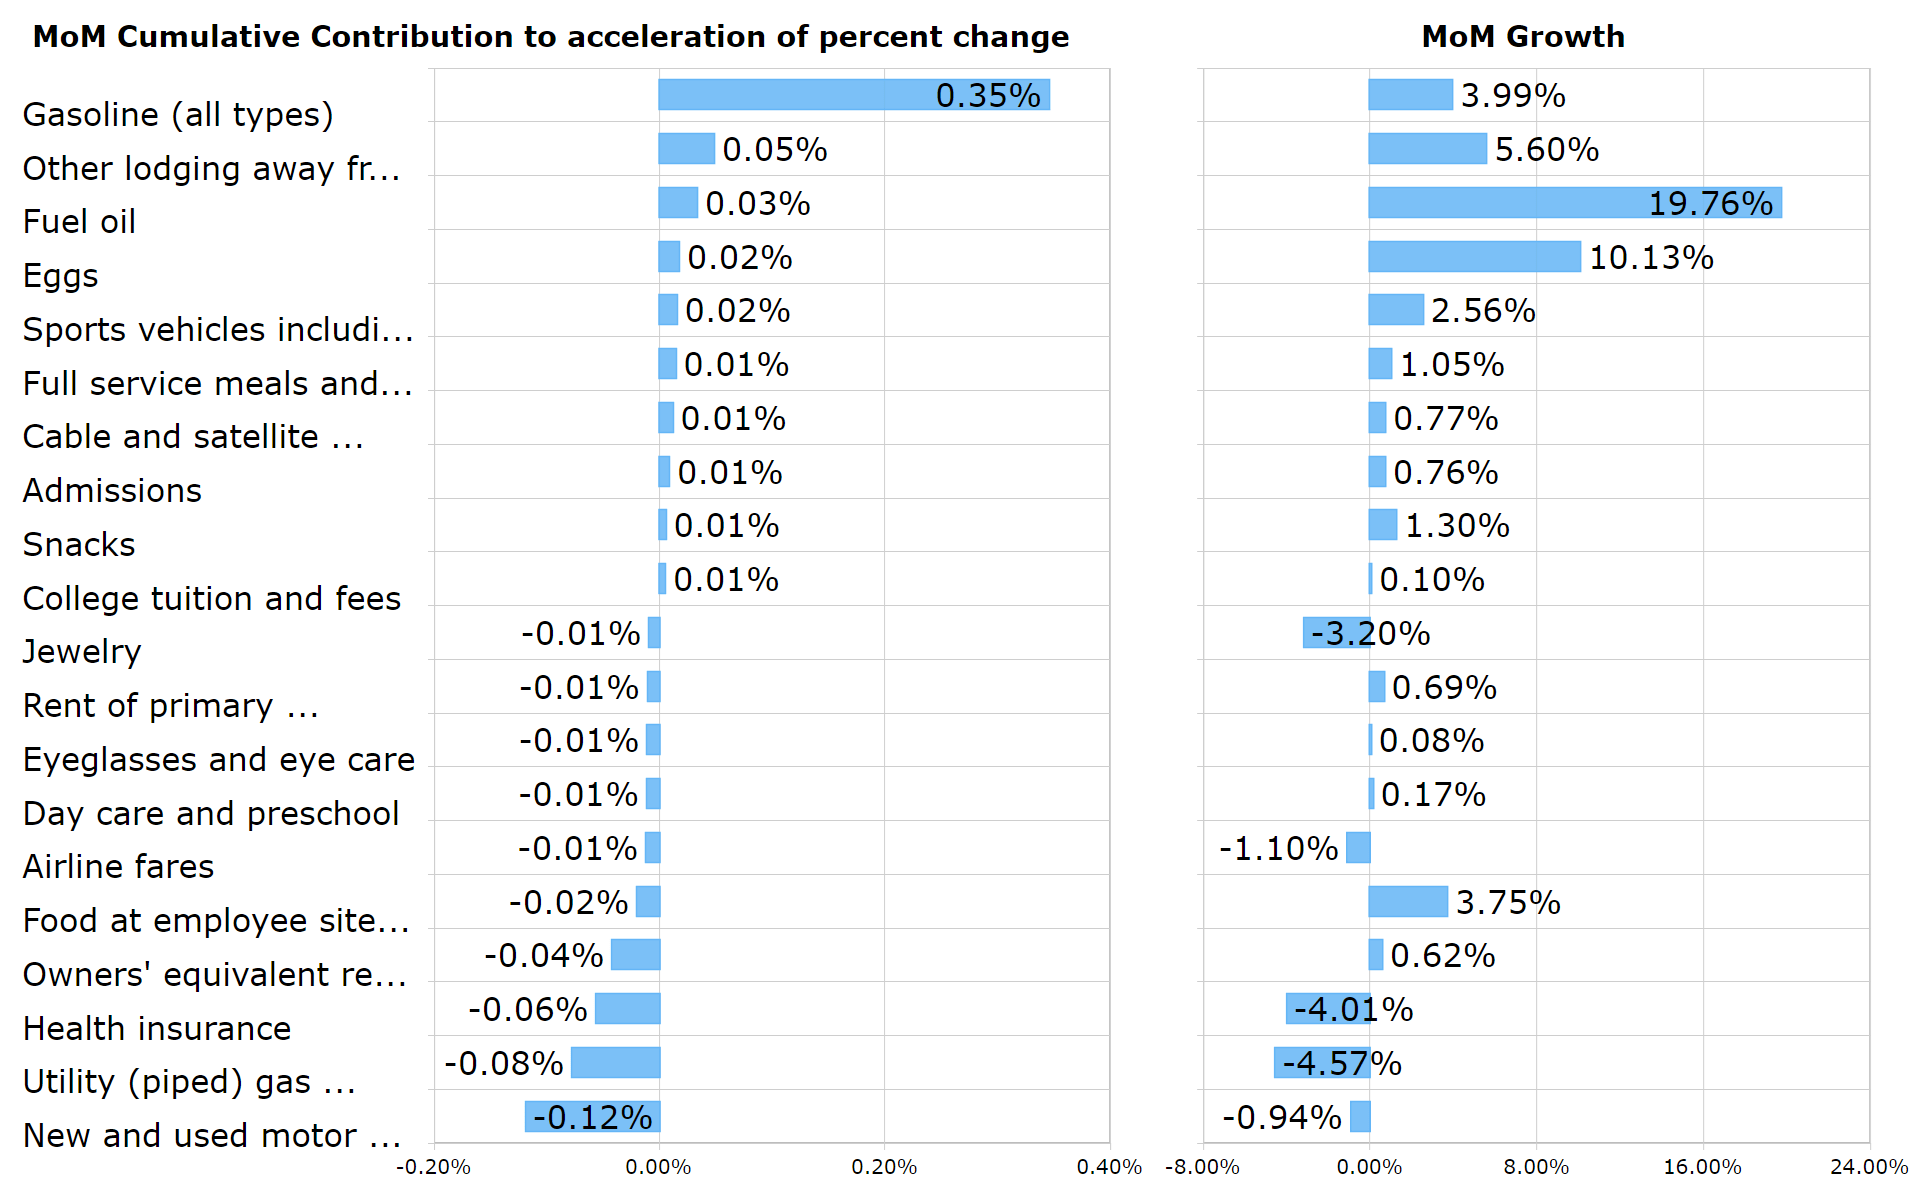
Source: BLS, Investor Acumen
As can be seen above, new and used cars, utilities and health insurance accounted for 0.26% of CPI deceleration — the lion-share of deceleration and “surprise” for the month.
Also, somewhat notable, was the deceleration in Owner’s Equivalent rent as well as Rent of Primary Residence — both decelerating by 0.1% relative to last month. This indicates that housing inflation may possibly have peaked for this cycle and could be headed in a downward direction.
It is worthwhile to examine tables 4 and 5 above carefully as they are likely to include most or all of the items which surprised forecasters during the month.
Top Movers
In Figure 6 below, for general interest purposes, we show the components with the largest positive and negative MoM change (%). The YoY change in these particular components is to the right.
Figure 6: Top Movers MoM Percent Change
Top CPI Movers (BLS, Investor Acumen)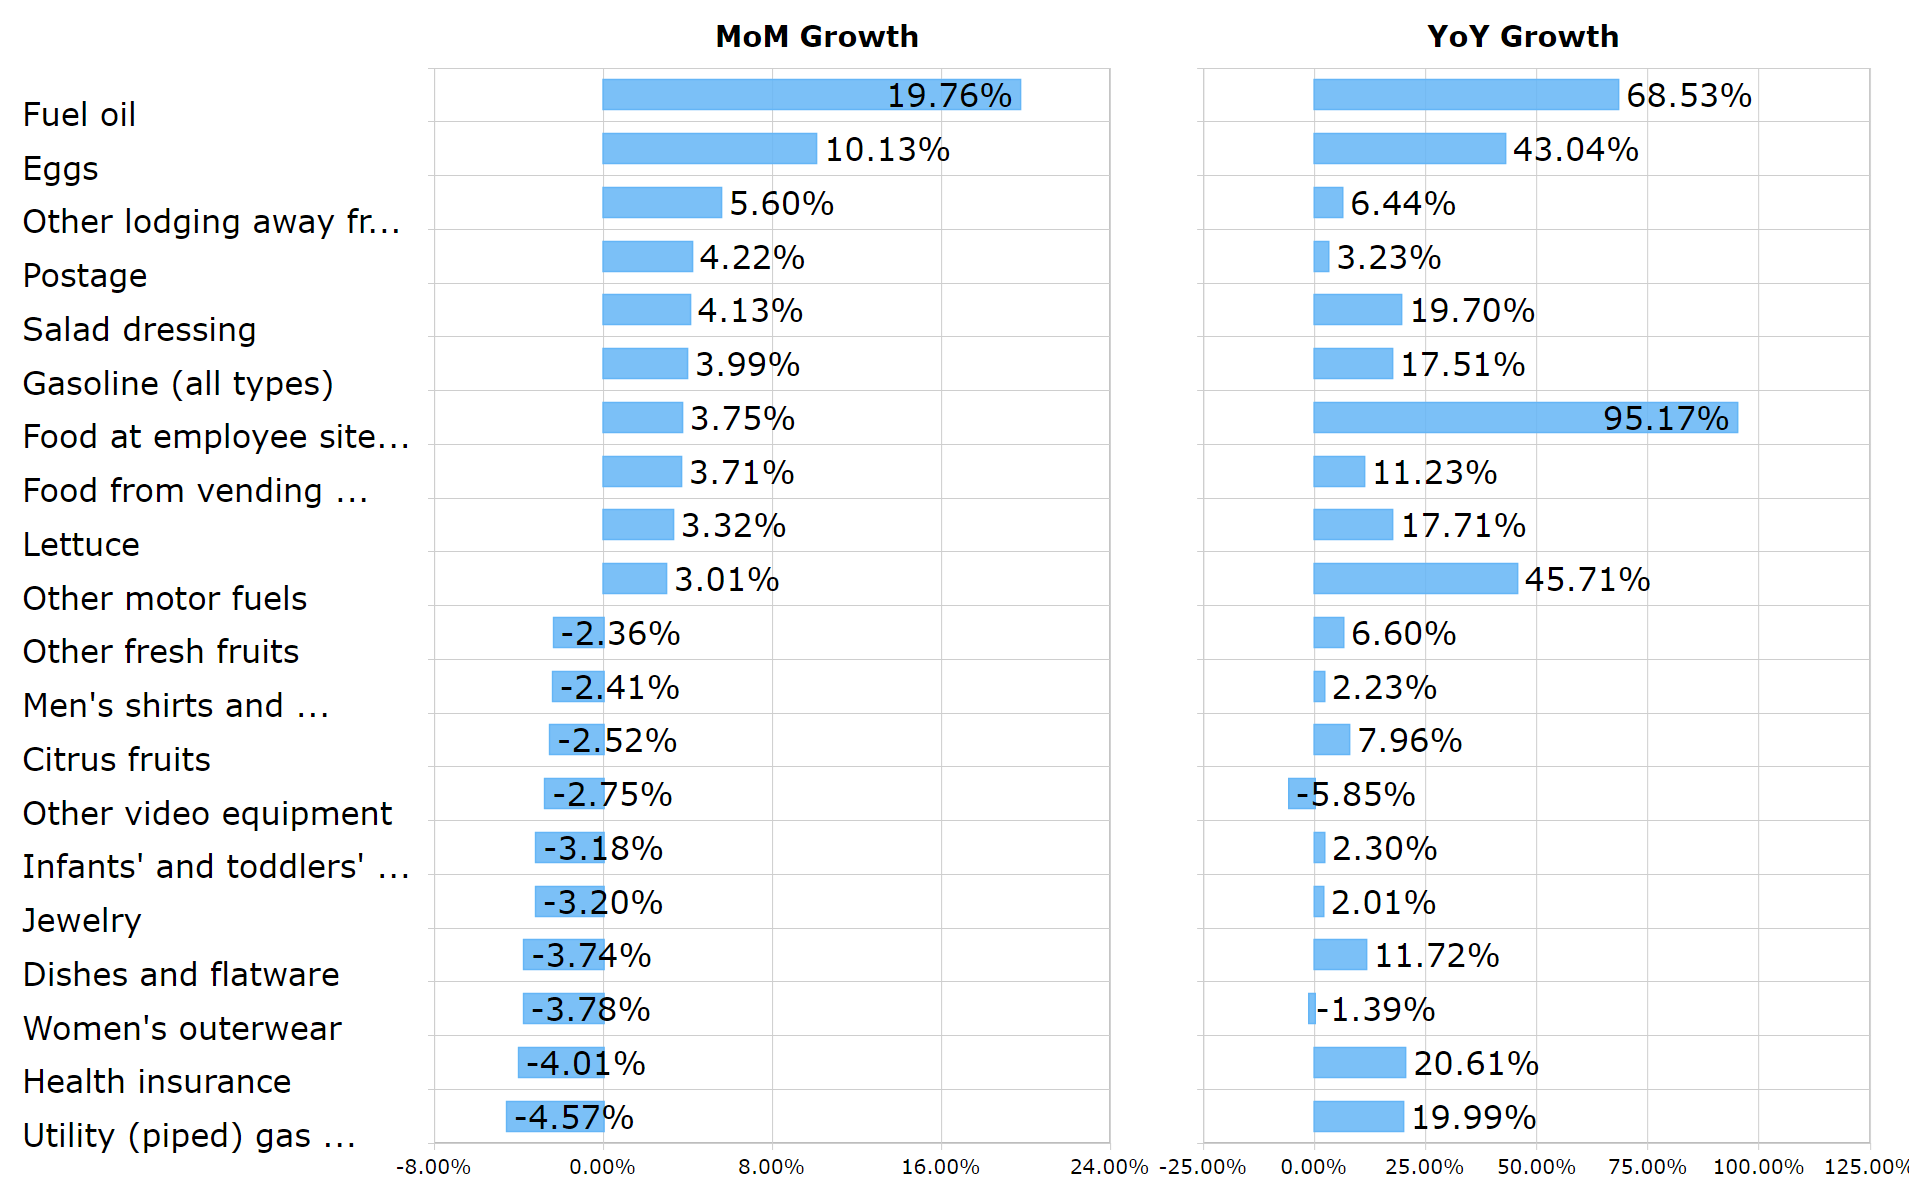
Source: BLS, Investor Acumen
Implications for Policy and Economic Performance
In this section, we review the potential implications of this month’s CPI report on policy (monetary & or fiscal) and the overall outlook for the US economy.
Impact on Policy. On the margin, this month’s deceleration of All-Items and Core CPI incrementally decreases pressure on the Fed to tighten overall financial conditions more than markets have expected. In fact, today’s numbers may tend to lower market expectations regarding how much (“terminal rate”), how fast and for how long the Fed may increase the Federal Funds interest rate.
Impact on Economic Performance. On the margin, today’s numbers may lead to speculation that inflation has peaked and is heading down in the intermediate term. This will take pressure off of interest rates across the economy such as mortgage interest rates. This could alleviate some of the headwinds that the economy has recently been experiencing, particularly in interest rate sensitive sectors.
Potential Financial Markets’ Impact
Today’s CPI report, on the margin, will likely decrease risk perceptions regarding the probability of the Fed being forced to tighten monetary policy to a degree that would induce recession. In particular, market expectations of the Fed’s so-called “terminal rate” may decrease. This would cause the cost of financing across the economy to decrease and overall financial conditions to ease somewhat. This should provide a positive boost for both bond and equity markets.
This month’s report may provide a “window of opportunity” for bonds and stocks to rise during the next month, until the next CPI report comes out.
I would caution that the internal details of this report, although generally positive, may not be quite as bullish as they appear on the surface. Much of the deceleration in both All-Items CPI and Core CPI was due to a few volatile components, which may not be representative of underlying inflationary trends. Still, this is the best news on inflation that the market has had in quite a while, and a significant relief rally in stocks and bonds can probably be expected.
Be the first to comment