

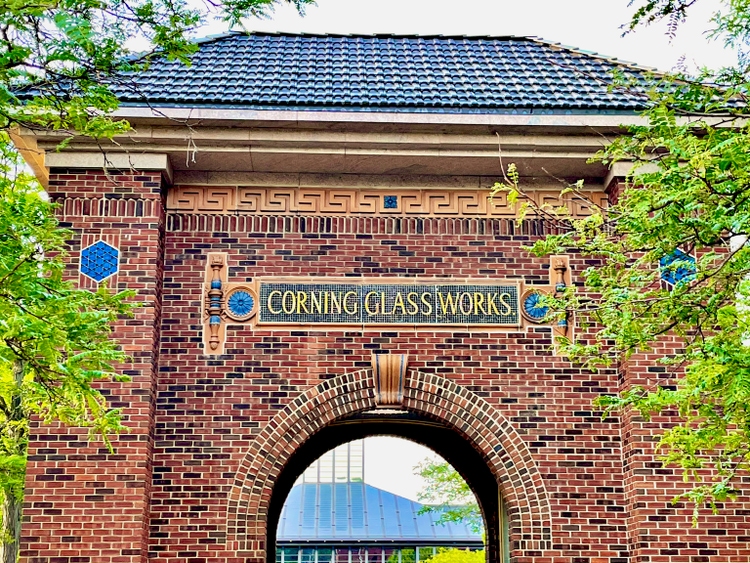
John M. Chase/iStock Unreleased via Getty Images
Thesis
Corning (NYSE:GLW) is a leading innovator and leading large-cap firm in materials science with strong synergies and market share across its business segments. Corning strategically positions itself to compete in related markets and has the potential to take advantage of that future growth if actioned correctly. Corning’s historical trends do showcase concerning aspects like a large exodus on insider capital through the past two years and a heavy reliance on a smaller customer base that could be potentially devastating if encroached. Utilizing a Discounted Cash Flow model with analyst expectations derives a fair value of approximately $28 though $22 should be sought to factor in a margin of safety given the underperformance risks.
Overall, Corning has a hold rating at current pricing since an investment at current prices is unlikely to outperform other strategic investments especially in the current environment.
Synergistic Segments & Future Growth
Corning operates in five reportable segments and “other” across multiple countries around the world. These segments are Optical Communications, Display Technologies, Specialty Materials, Environmental Technologies, and Life Sciences. When considering how to value Corning, it is important to attempt to understand the future demand and growth of each individual segment to help make logical predictions and value whether Corning is a good present buy.
Optical Communications
The demand for optical fiber, cable, and connectivity is supported by a global secular trend summarized by increasing connectivity and data transference needs. According to Digital Journal, the market for these products is projected to grow at a CAGR of 6.32% by 2028 while Global Newswire estimates a CAGR of 9.5%. This segment is the largest revenue producer of Corning and the market growth will play a significant impact on Corning’s revenue growth. Corning does believe that while this market is competitive, they maintain a leadership position due to their business synergies and intellectual property.
Display Technologies
According to their 2021 10-K, Corning is the largest worldwide producer of glass substrates for flat panel display glass. This product is well suited for another global secular trend of vehicle electronics and consumer electronics and is expected to grow at a CAGR of 5.7% through 2028.
Specialty Materials
The Specialty Materials segment provides a wide variety of products to meet specialized customer needs ranging from smartphone glass, tablets, laptops, smartwatches to precision equipment for aerospace/defense and radiation shielding. The growth of this segment is largely tied to mobile consumer device sales and the expected CAGR is 11.5% according to Global Newswire.
Environmental Technologies
Corning manufactures ceramic emission control substrates for gasoline and diesel applications. According to PR Newswire, the automotive emissions ceramics market size is due to grow by a CAGR of 4.5% through 2026. This market could face resistance into and beyond 2030 as the transition to more electric vehicles decreases the demand for automotive emission control substrates.
Life Science
Corning is a global supplier of laboratory products and manufactures a wide variety of glassware and general labware. According to Global Newswire, the laboratory equipment market is expected to grow at a CAGR of 7.4% through 2028.
Other
Corning is expanding into other emerging growth businesses and has a variety of prospects including solar and semiconductor products, pharmaceutical technologies, and other emerging innovation products. They have the expertise to continue to move into relatable markets and develop these revenue segments throughout the next decade.
Historical Trends
Price and Earnings
Visualizing the price and earnings quarterly trends since 2006 shows a lot of volatility in Corning’s earnings (Figure 1). The price (yellow line, left y-axis) has generally trended upwards though they have experienced poor price action growth overall. The earnings (blue-line, right y-axis) have also been very volatile over certain time periods like in 2008, 2017, 2018, and 2020.
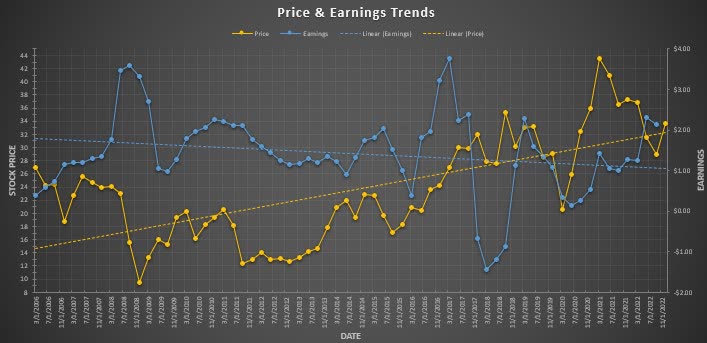
Figure 1. Price and earnings trend (Author)
Margins
The gross and EBIT margins both show a slow downward trend since 2012 (Figure 2). The gross margin (blue-line) has deteriorated from approximately 43% to 30% and the EBIT margin (yellow-line) has reduced from approximately 19% to 9%.
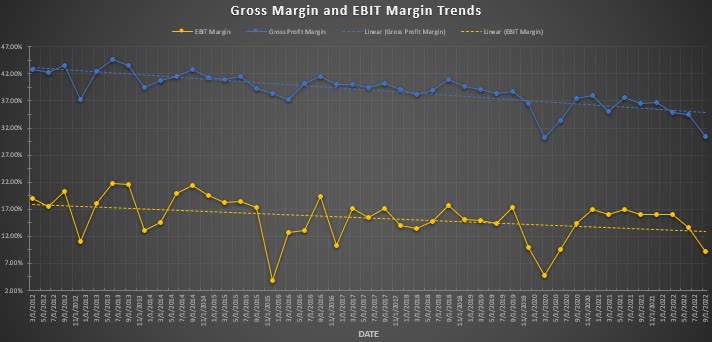
Figure 2. Gross and EBIT margins trend (Author)
Cash Conversion Cycle, Quick Ratio, and EBIT/Interest Expense
The cash conversion cycle, quick ratio, and EBIT/interest expense trends show insightful information for investors (Figure 3). The cash conversion cycle (blue-line, right y-axis) shows a firm that has had a trending increase since 2012 in days to convert cash from investment to returns. It then shows volatility around 2019 and 2020 but a better performance in 2021 and 2022. The quick ratio (orange line, left y-axis) shows the available liquid assets as a ratio to current liabilities and is a representation of whether the company can acutely pay back their short-term debts. Corning has had a downward trending quick ratio which was approximately a value of 4 to their most recent quarter being a value of 0.63 while having a value of less than 1 shows a lack of liquid assets in comparison to short-term debts. The EBIT/interest expense ratio (gray line, left y-axis) measures a firm’s ability to cover its outstanding debts and Corning has shown a decreasing value since 2012. It’s important for firms to make sure they maintain a margin of safety on their cash and EBIT for contingencies and 2020 was a good example as to how unknown events can challenge the leverage of a firm.
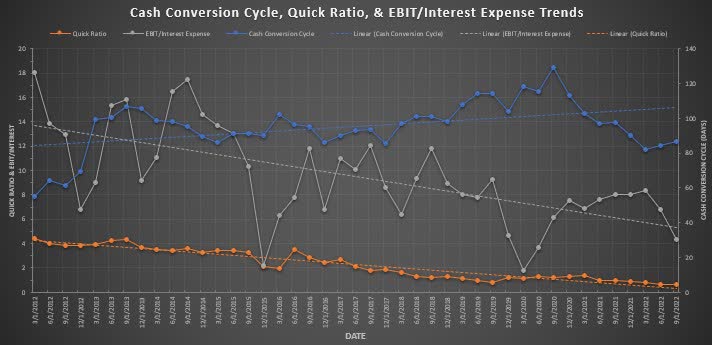
Figure 3. cash conversion cycle, quick ratio, and EBIT/interest expense trends (Author)
Financial Leverage
Observing the financial leverage trends of Corning shows a firm that has been increasing their debt since 2012 (Figure 4). The debt/assets (blue-line), debt/equity (orange-line), and debt/capital (gray-line) have all risen substantially. Leveraging can be positive since the capital structure can produce greater returns for shareholders and the interest on the debt can act as a tax shield. It could also be construed as a negative aspect since leveraging capital structure exposes a company to more risks which is important for Corning considering they are a high fixed costs firm that rely on a smaller customer base and debt is becoming more expensive in the immediate future.
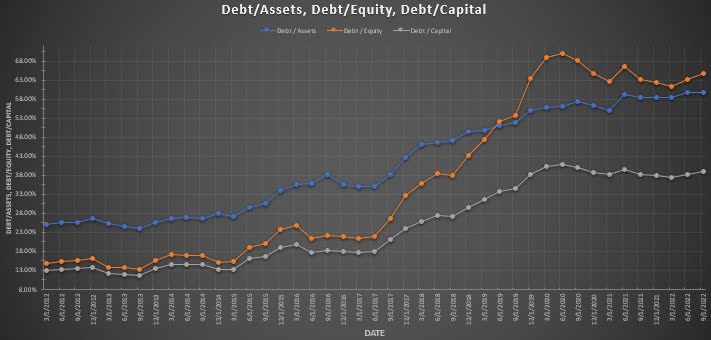
Figure 4. Financial leverage (Author)
Return on Assets, Equity, & Capital
Tying the previous figures together with firm profitability can substantiate whether the firm leveraging is effective. The return on assets (ROA, blue-line), return on equity (ROE, orange-line, right y-axis), and return on capital (ROC, gray-line) are all trending in a slightly positive manner since 2012. The ROE has exhibited very volatile movements in comparison to the ROA and ROC while all three have declined in the most recent quarter.
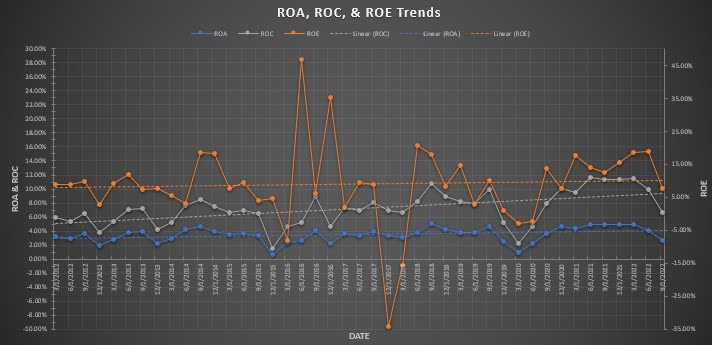
Figure 5. ROA,ROE, and ROC trends (Author)
Trend Summary
Attempting to bring these historical trends into perspective and generating a thesis for the future holds insight for investors. Based on this analysis it seems that the earnings and price action of Corning are inconsistent and the margins have been declining. The cash conversion cycle has moved to better levels not seen since 2017 and the EBIT/interest ratio is still healthy over 4. The quick ratio has been declining and when paired with the large increases in debt forces a consideration of the health of the financial leverage of the firm. Lastly, the profitability metrics are showing slight increasing trends over the long-term which is a good sign for investors. Overall, these trends indicate that investors should be attentive with the financial leverage and liquidity of the firm and should demand a higher margin of safety when valuing.
Analytics
The intent of exploring the future growth of each segment and historical trends was to help extrapolate multiple potential scenarios for different valuation models when valuing Corning. The first step was to derive a Weighted Average Cost of Capital using the Capital Asset Pricing Model to determine that Corning has an approximate WACC of 10.59%. Considering the risks of the financial leverage as discussed earlier, it is prudent to increase the discount rate to 12.5% allowing for a margin of safety into the models. The first scenario of both models’ inputs was derived from a growth forecast from the weighted effects of each of Corning’s segments assuming constant market share to determine an annual revenue growth rate of 6.86% with consistent margins and payout ratios if future macro-projections hold true (Figure 6). The second scenario for each model will be based off of analysts’ projections discounted back to present value at 12.5%.
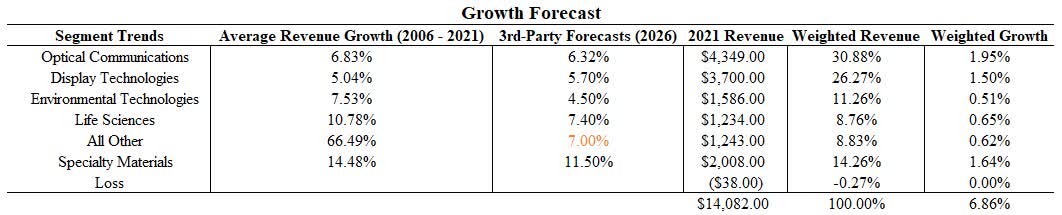
Figure 6. 3rd-party growth forecast extrapolation (Author)
Dividend Discount Models
The Dividend Discount Models are two-stage models from 2023 to 2027 and have a terminal value growth rate of 3.5% (Figure 7). Scenario 1 and Scenario 2 result in a present value of $16.07 and $15.94 per share respectively. This model would signify that Corning is significantly overvalued for the expected return of 12.5%.
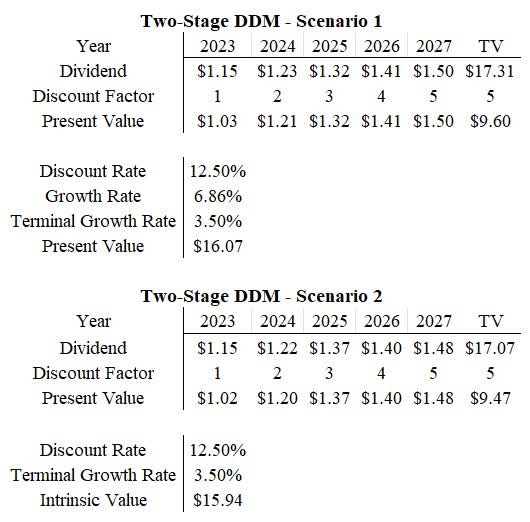
Figure 7. Dividend Discount Model (Author)
Discounted Cash Flow Model
The Discounted Cash Flow Models are two-stage models from 2023 to 2027 and have a terminal value growth rate of 3.5% (Figure 8). Scenario 1 and Scenario 2 result in a present value of $15.55 and $21.32 per share respectively. This model would signify that Corning is significantly overvalued for the expected return of 12.5%.
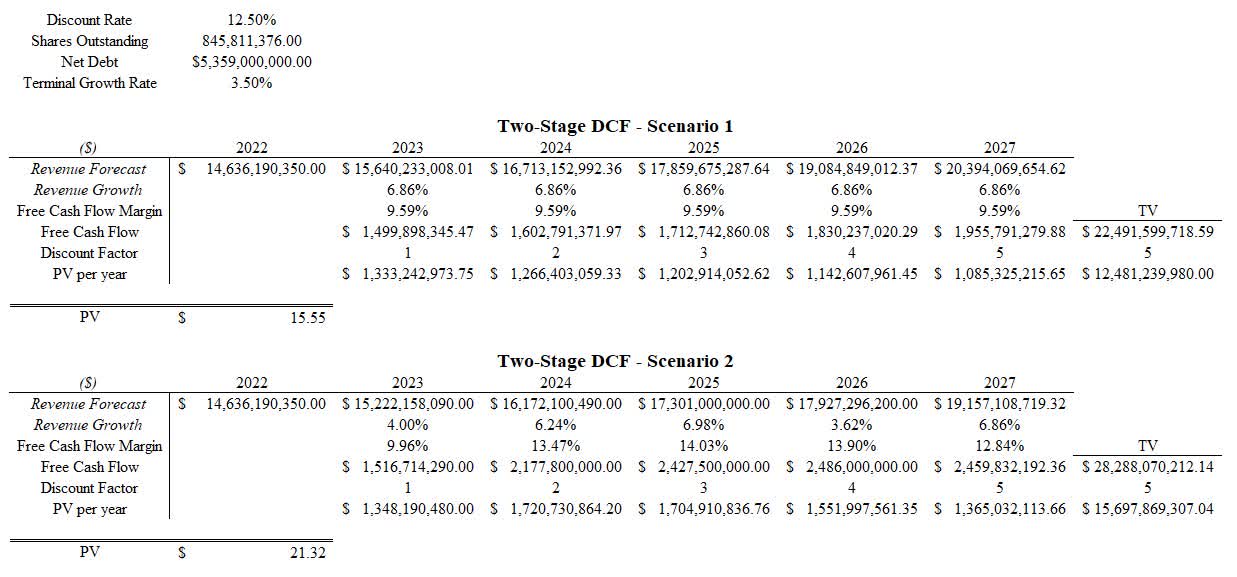
Figure 8. Discounted Cash Flow Model (Author)
Is Corning at a Fair Value?
Understanding the model inputs and how the discount rate and WACC are utilized in these models is important for valuing. The calculated WACC of 10.59% can be substituted as the discount rate to determine what the fair value is (which does not include a margin of safety). Inputting this into the Analyst assumption Discounted Cash Flow Model results in a fair value of $28.90. What this means is that until Corning price action moves into this range, better investment opportunities await and Corning may underperform if purchased above this price.
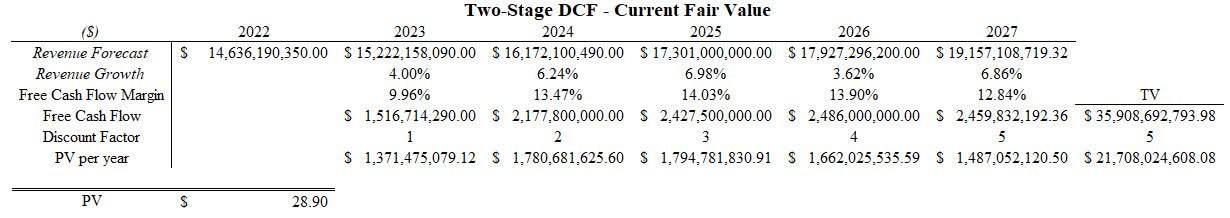
Figure 9. Fair-value DCF (Author)
Risks & Considerations
Concentrated Customer Base
A substantial risk to Corning is the high concentration of its twelve largest customers which made up approximately 41% of their total revenue in 2021 (Figure 12). This is significant because the company could be adversely affected by a change to any one of these larger customers though they strategically attempt to mitigate these risk by maintaining co-investments, having strong products, and maintaining their cost-efficiency advantage from their sizing.
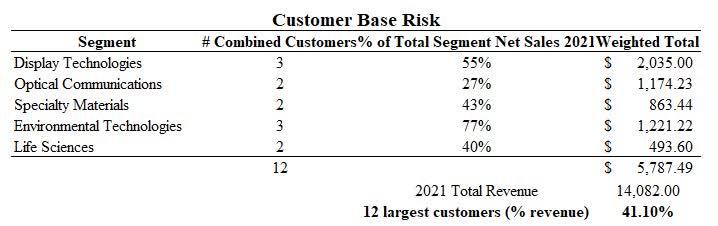
Figure 10. Customer base risk (Corning 10-K-2021)
Patent Expiration
Corning is a substantial owner of Intellectual Property and works to maintain their competitive edge through patents (Figure 11). Fortunately there is a worldwide diversification of their patents though approximately 0.5% to 3% of their United States patents are expiring prior to 2024 which could possess certain risks for them in the markets that they compete in.
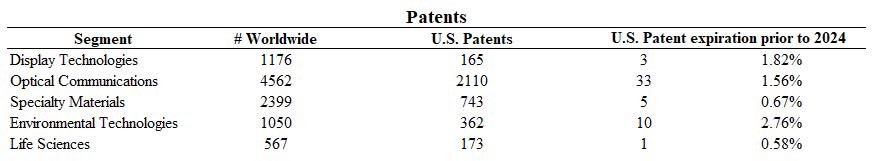
Figure 11. Patents (Corning 10-K-2021)
Insider Net Selling
A substantial amount of insider transactions has taken place since December of 2020 (Figure 12). The total value of insider selling is over $57 million with an average price of $40.94 per share while the total value of insider buying is around $300 thousand with an average of $43.11 per share. This signifies an immense outflow of insider investments and could be seen as a risk for retail investors though there may be a variety of reasons for the insider price action actions.
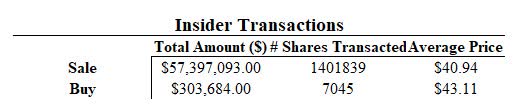
Figure 12. Insider Transactions (Author)
Conclusion
Corning is a strong competitor in the markets that it competes in and has proven that through its exceptionally long history. The past decade has highlighted the positive attributes like its strategic ability to develop revenue segments that may continue to be sought into the future. Corning leverages its synergies and size well though there are substantial risks for investors looking to establish a position like the large exodus of insider positions, the heavy reliance on a small customer base, the decreasing margins, and the large increase in financial leverage. Factoring in a larger margin of safety to help offset these risks puts a buy-rating on Corning in the range of $15-22, though the shares are fairly valued given current information and analyst estimates around $28. Overall, this calls for a hold rating for Corning as the investment at these current prices are unlikely to outperform other strategic investments.
Be the first to comment